Enthalpy of Mixing in Al–Tb Liquid

1
Division of Materials Science and Engineering, Ames Laboratory, United States Department of Energy, Ames, IA 50011, USA
2
Department of Materials Science and Engineering, Iowa State University, Ames, IA 50011, USA
*
Author to whom correspondence should be addressed.
Entropy 2017, 19(6), 290; https://doi.org/10.3390/e19060290
Submission received: 10 April 2017
/
Revised: 14 June 2017
/
Accepted: 15 June 2017
/
Published: 21 June 2017
(This article belongs to the Special Issue Thermodynamics in Material Science)
Abstract
:The liquid-phase enthalpy of mixing for Al–Tb alloys is measured for 3, 5, 8, 10, and 20 at% Tb at selected temperatures in the range from 1364 to 1439 K. Methods include isothermal solution calorimetry and isoperibolic electromagnetic levitation drop calorimetry. Mixing enthalpy is determined relative to the unmixed pure (Al and Tb) components. The required formation enthalpy for the Al3Tb phase is computed from first-principles calculations. Based on our measurements, three different semi-empirical solution models are offered for the excess free energy of the liquid, including regular, subregular, and associate model formulations. These models are also compared with the Miedema model prediction of mixing enthalpy.
1. Introduction
Phase selection pathways in glass-forming metallic liquids are influenced by the development of short- and medium-range order [1,2,3,4,5,6,7,8,9,10], which contribute to local energetics and dynamics. Even in binary glass-forming systems, clear evidence of the influence of ordering in the liquid state has been reported [3,4,5,11,12,13,14,15,16,17]. For example, the marginal glass-forming ability in the Al–RE (aluminum rare-earth) systems has been associated with ordering in the liquid phase [18,19,20,21,22,23,24,25,26,27,28,29]. In addition, due to their relative simplicity compared to conventional many-component glass-forming alloys, Al–RE and Al–RE–TM (TM denotes transition metal) alloys are excellent model systems for the investigation of phase stability [30,31,32,33], metallic glass formation [34,35,36,37], liquid properties and crystallization [38,39,40], and glassy alloy structure/properties [25,41,42]. As with all glass-forming liquids, however, properties may become increasingly temperature dependent near and below the liquidus [43,44,45], highlighting the need for reliable thermodynamic descriptions of the liquid state. Numerous theoretical/computational studies, thermodynamic assessments, and associated CALPHAD models for the Al–RE systems are available [32,33,46,47,48,49,50], but reported experimental measurements of excess mixing quantities for Al–RE liquids are very limited, as listed for the Al–lanthanides in Table 1.
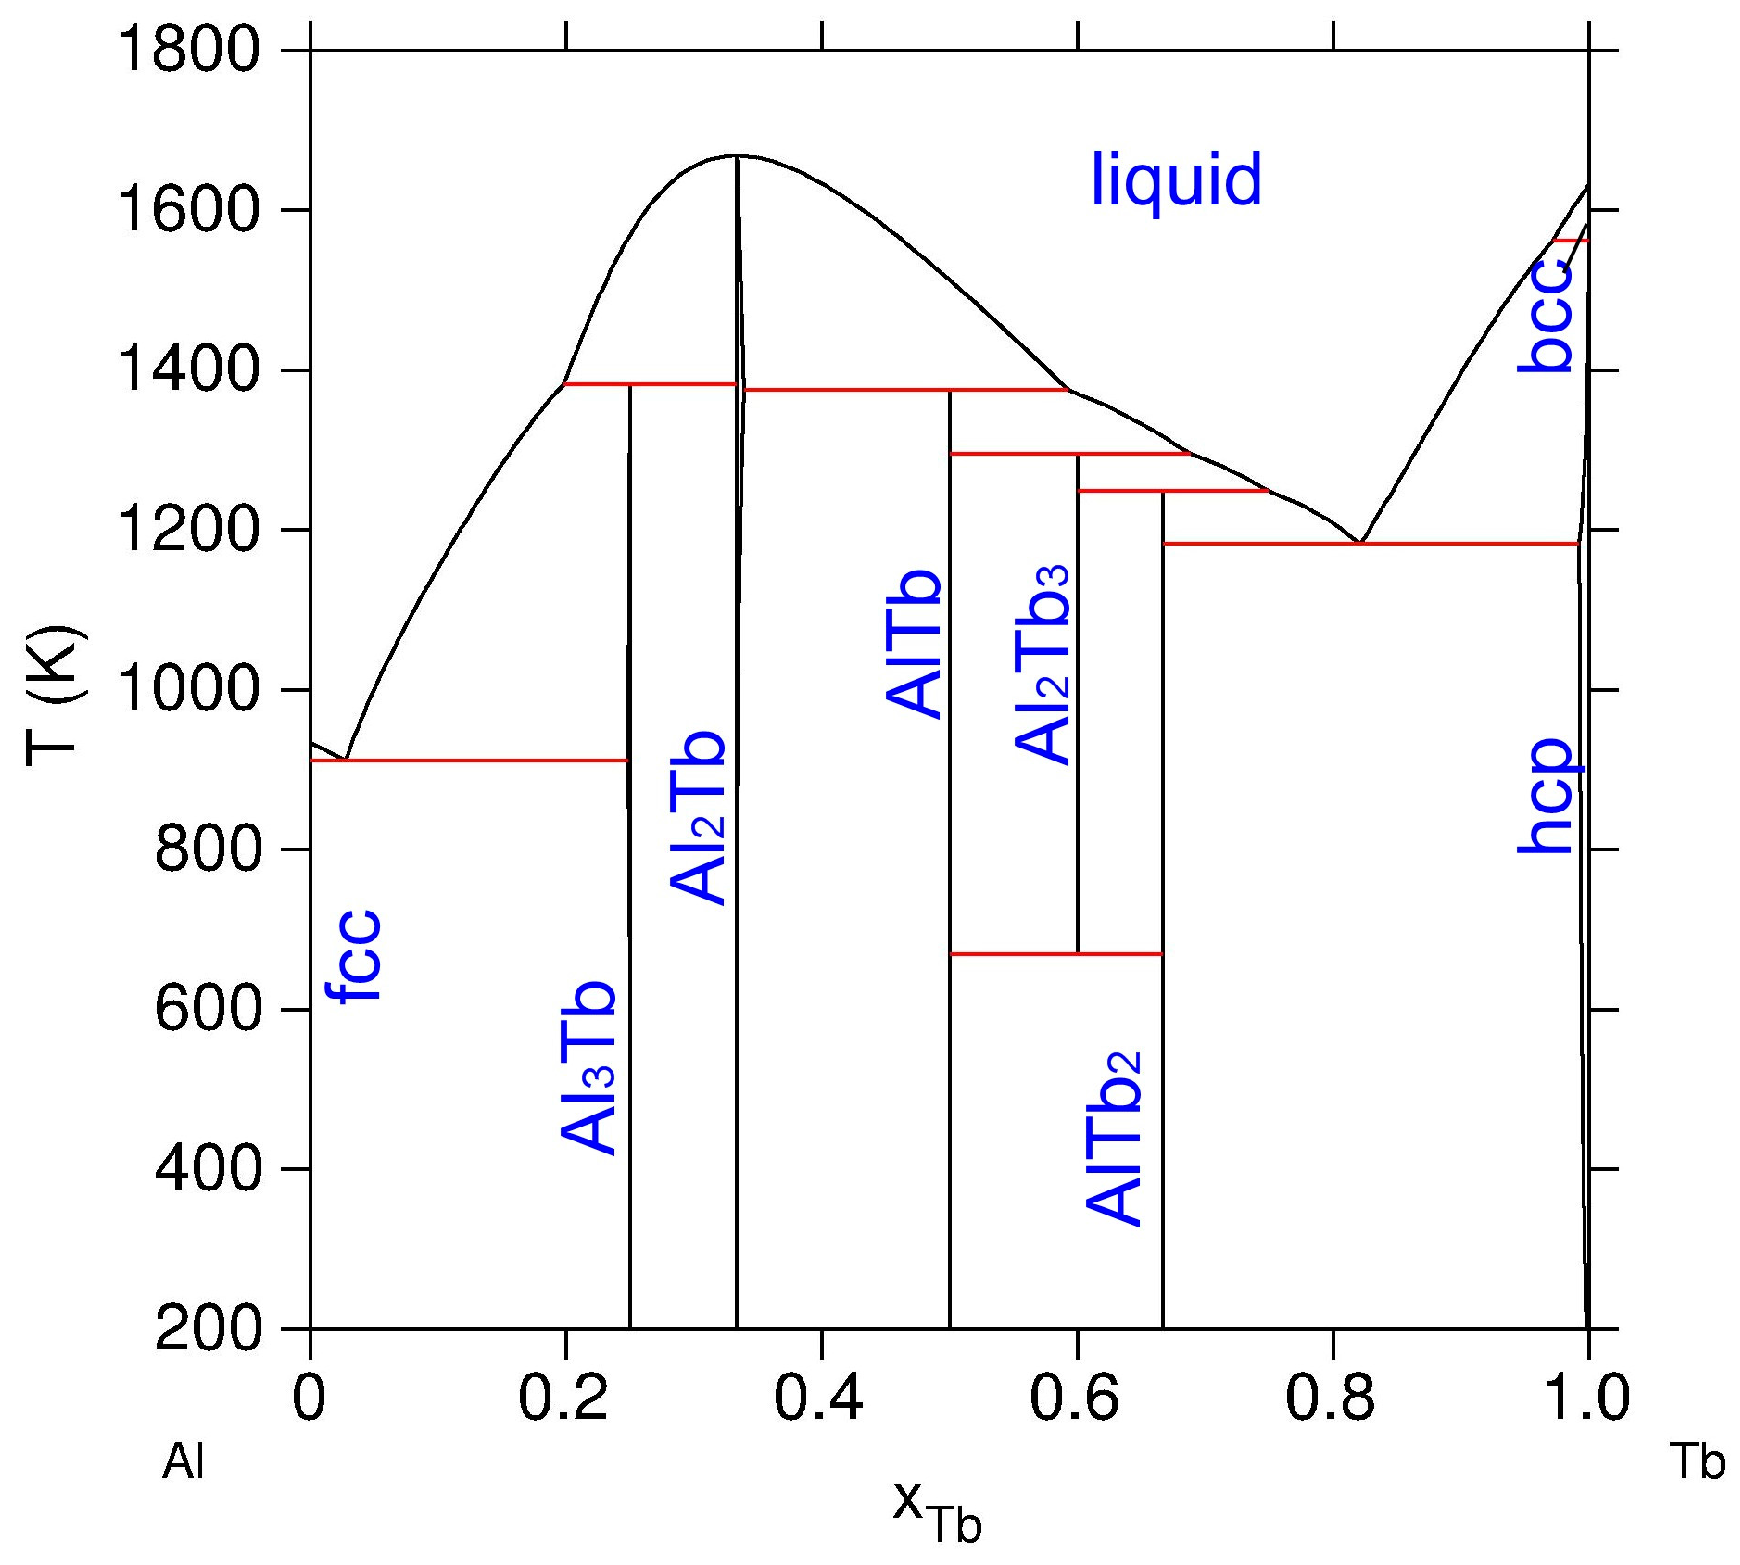
In the current work, we focus on the Al–Tb binary system (see Figure 1) and make critical measurements of the enthalpy of mixing, , for the liquid phase. Specifically, we perform solution calorimetry and electromagnetic levitation drop calorimetry to measure in dilute Al–Tb alloys with Tb content up to (mole fraction). In addition, we compare three different semi-empirical solution models for the excess free energy of the liquid, incorporating regular, subregular, and associate [75] formulations for the mixing enthalpy These are compared with the Miedema model [76,77,78] for this system.
2. Calorimetry Experiments
We employ here two different calorimetric techniques to determine for the Al–Tb liquid phase in the stable temperature range. Using an isothermal solution calorimetry (ISC) method, we measure the thermal transient associated with the dissolution of a small amount of Tb in a liquid Al solvent, permitting direct determination of for the liquid phase. Using an electromagnetic levitation drop calorimetry (EMLDC) method, we measure the heat evolved upon rapid cooling of the high temperature equilibrium alloy liquid to a low temperature multi-phase state, from which we determine the high temperature mixing enthalpy, . All test specimens were prepared from the pure elemental components (0.9999 Al and 0.999 Tb, by weight (pure Al and Tb were supplied by Cerac, Inc., Milwaukee, WI, USA)). Alloy specimens of desired composition were prepared for EMLDC by arc melting the pure components five times in succession on a water-cooled copper hearth under a high-purity (ultra-high purity (99.999%) argon, supplied by Matheson Company, Des Moines, IA, USA) argon atmosphere. Test specimens were then cut to the desired size using a diamond saw.
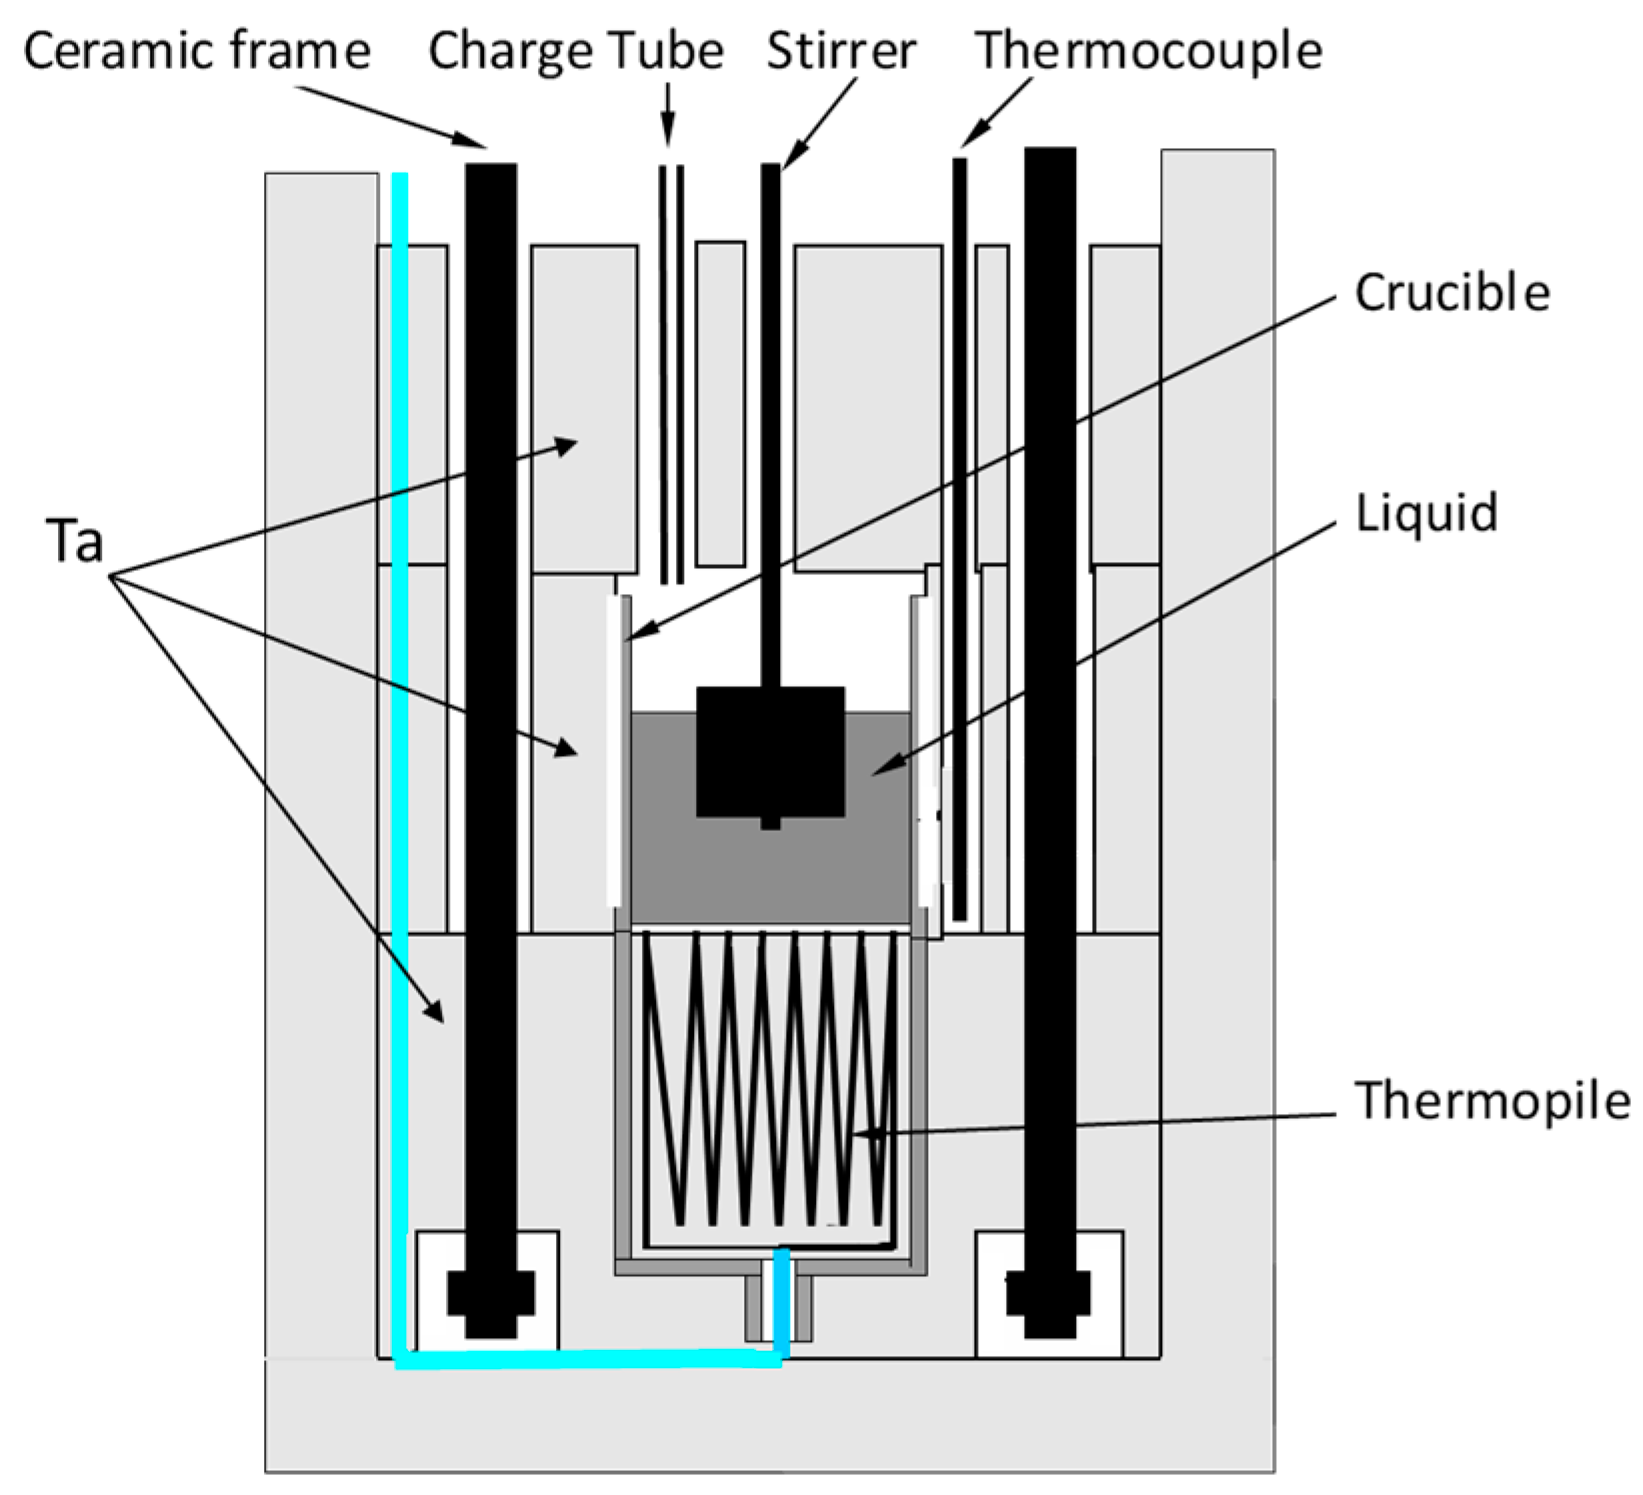
The central components of the custom-built ISC are illustrated schematically in Figure 2. The entire assembly shown in the figure is contained within a vacuum chamber, evacuated to 10−5 torr, refilled to 760 torr with ultra-high purity argon prior to heating, and maintained at this pressure throughout the experiment. For the measurement, a mass (mTb) of pure Tb, initially at ambient temperature (Ta), is introduced into a bath of pure Al liquid of known mass (mAl), with the system held isothermally at T0 using an integrated thermocouple-based closed-loop control system. The resulting net thermal exchange between the calorimeter and the bath associated with isothermal control is given by
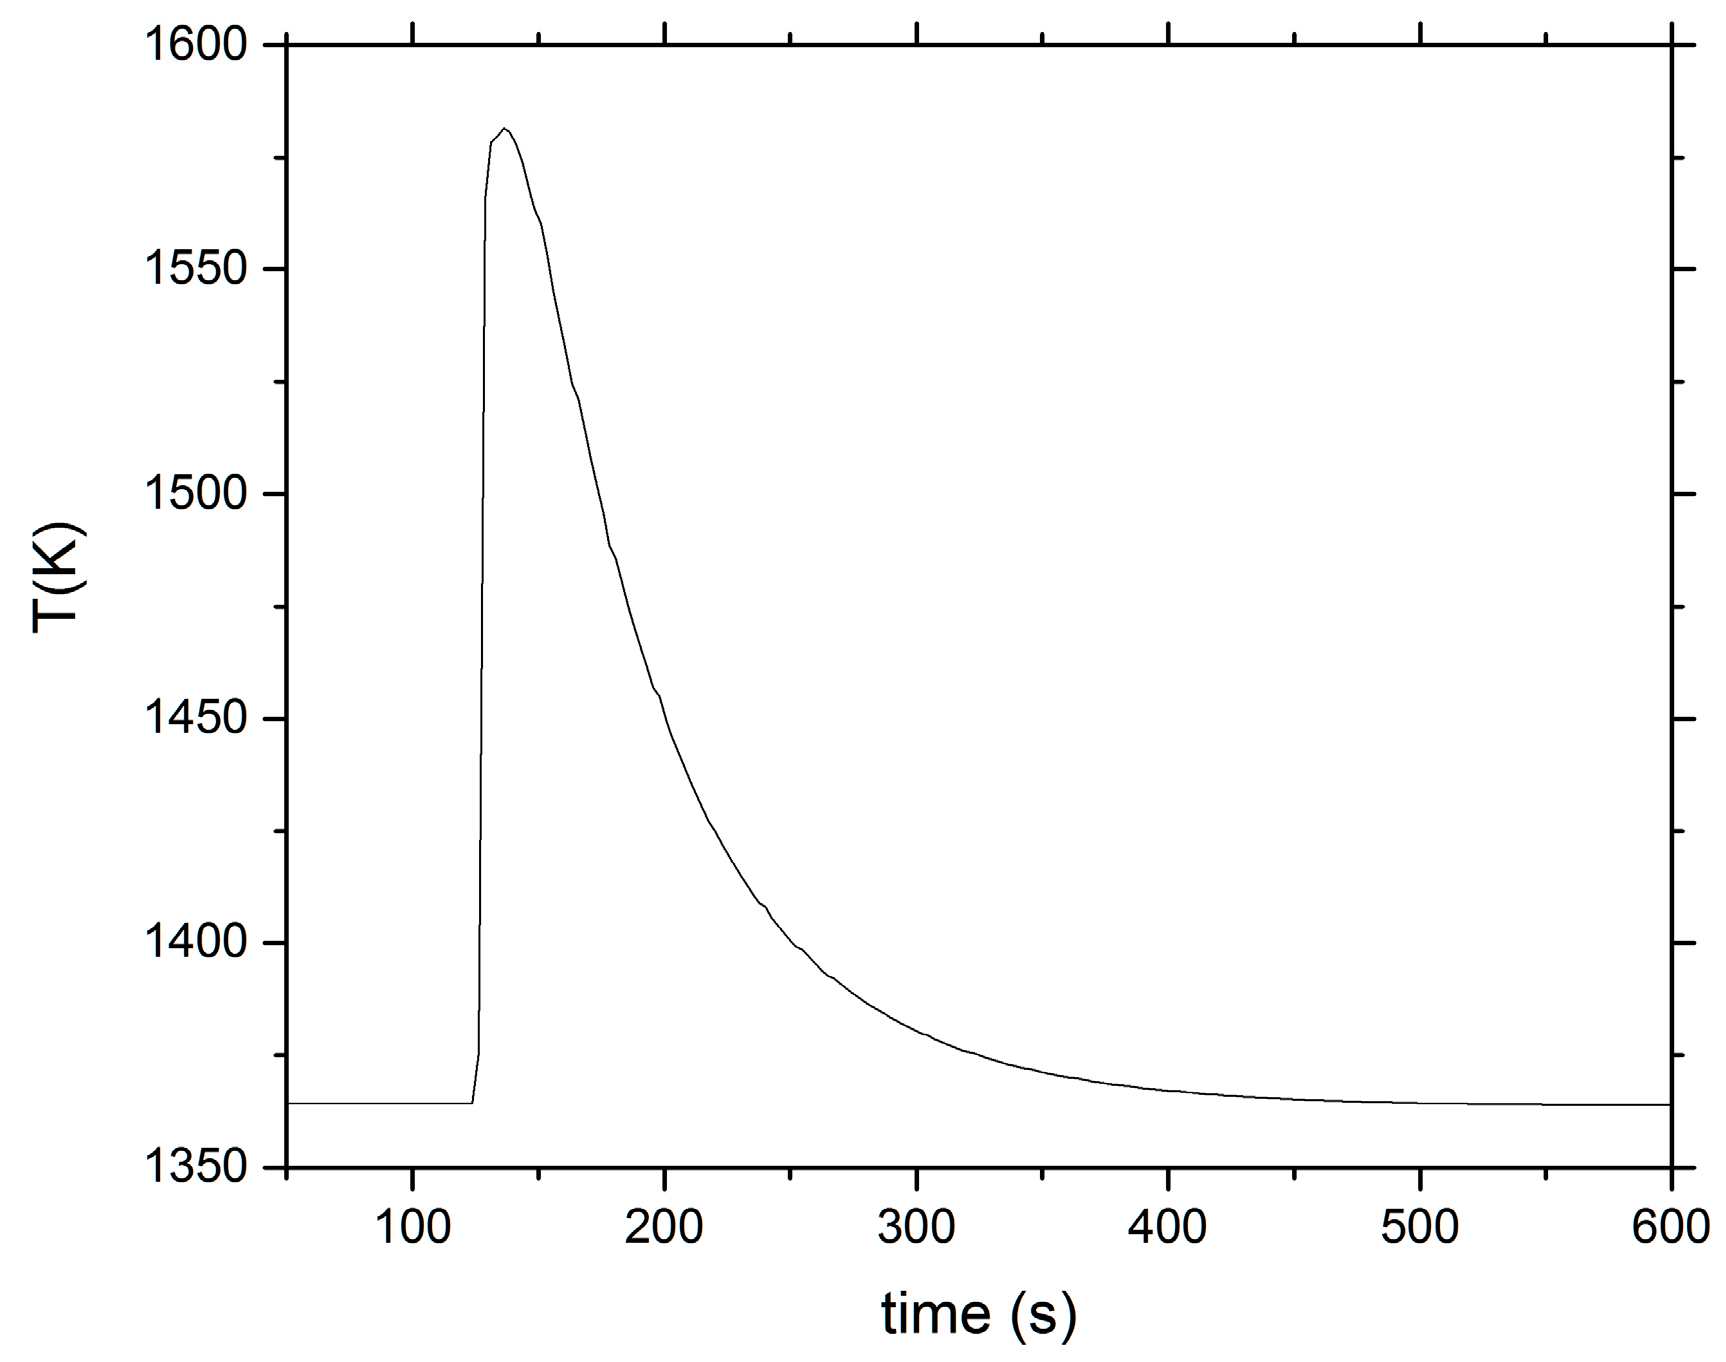
where the first three terms on the right-hand-side (RHS) are exchange fluxes associated with heating, melting, and mixing of the added material, respectively. The fourth term is the heat flux required to maintain isothermal conditions at T0 in the bath, with no addition of material. Upon the addition of the terbium mass, mTb, to the bath, the net exchange gives rise to a sensible thermal transient which is measured using a thermopile in contact with the melt crucible. An example thermal trace is shown in Figure 3. The measured temperature transient is related to the specimen-bath reaction enthalpy according to:
and we compute the incremental heat of mixing for this transient as
where
Here, MTb and mTb denote the molar and total mass of the Tb specimen, respectively, and β is the ISC calorimeter constant. The temperature dependent molar heat capacities (cp) were determined from SGTE free energy parameterizations [79].
The ISC calorimeter constant, β, was determined using pure Al solid specimens and a pure Al bath. In this case, , and the left-hand side (LHS) of Equation (2) can computed from the heat capacity and enthalpy of melting for Al, which are explicitly known. The right-hand side (RHS) of Equation (2) is determined from the measured temperature signal, permitting quantitative determination of β for the specific temperature and mass of the bath, using Equations (3)–(5). Calibration measurements used to determine the calorimeter constant are summarized in Table 2, and the constant was determined as −0.08336 J/sK (The reported uncertainty of ±5% for β is based on 1.5 standard deviations, with respect to pure Al measurements, as described in Appendix A).
Immediately following the calibration measurement, measurements were performed at T0 = 1364 K by introducing solid Tb (Ta = 298 K) to the melt in incremental amounts of 1.8528 g, 3.4288 g, and 4.861 g, yielding alloys with mole fractions of Tb () of 0.030, 0.054, and 0.075, respectively. The results are summarized in Table 3. Incremental mixing enthalpy (relative to the previous state) is denoted as δqmix while the mixing enthalpy relative to the unmixed pure Al and Tb components is denoted as ∆Hmix. Attempts to perform ISC measurements with higher Tb content resulted in non-negligible reaction with the ZrO2 calorimeter crucible, which interfered with the thermal transient signal. Measured quantities are shown in Table 3 for these cases, but no enthalpy of mixing is reported.
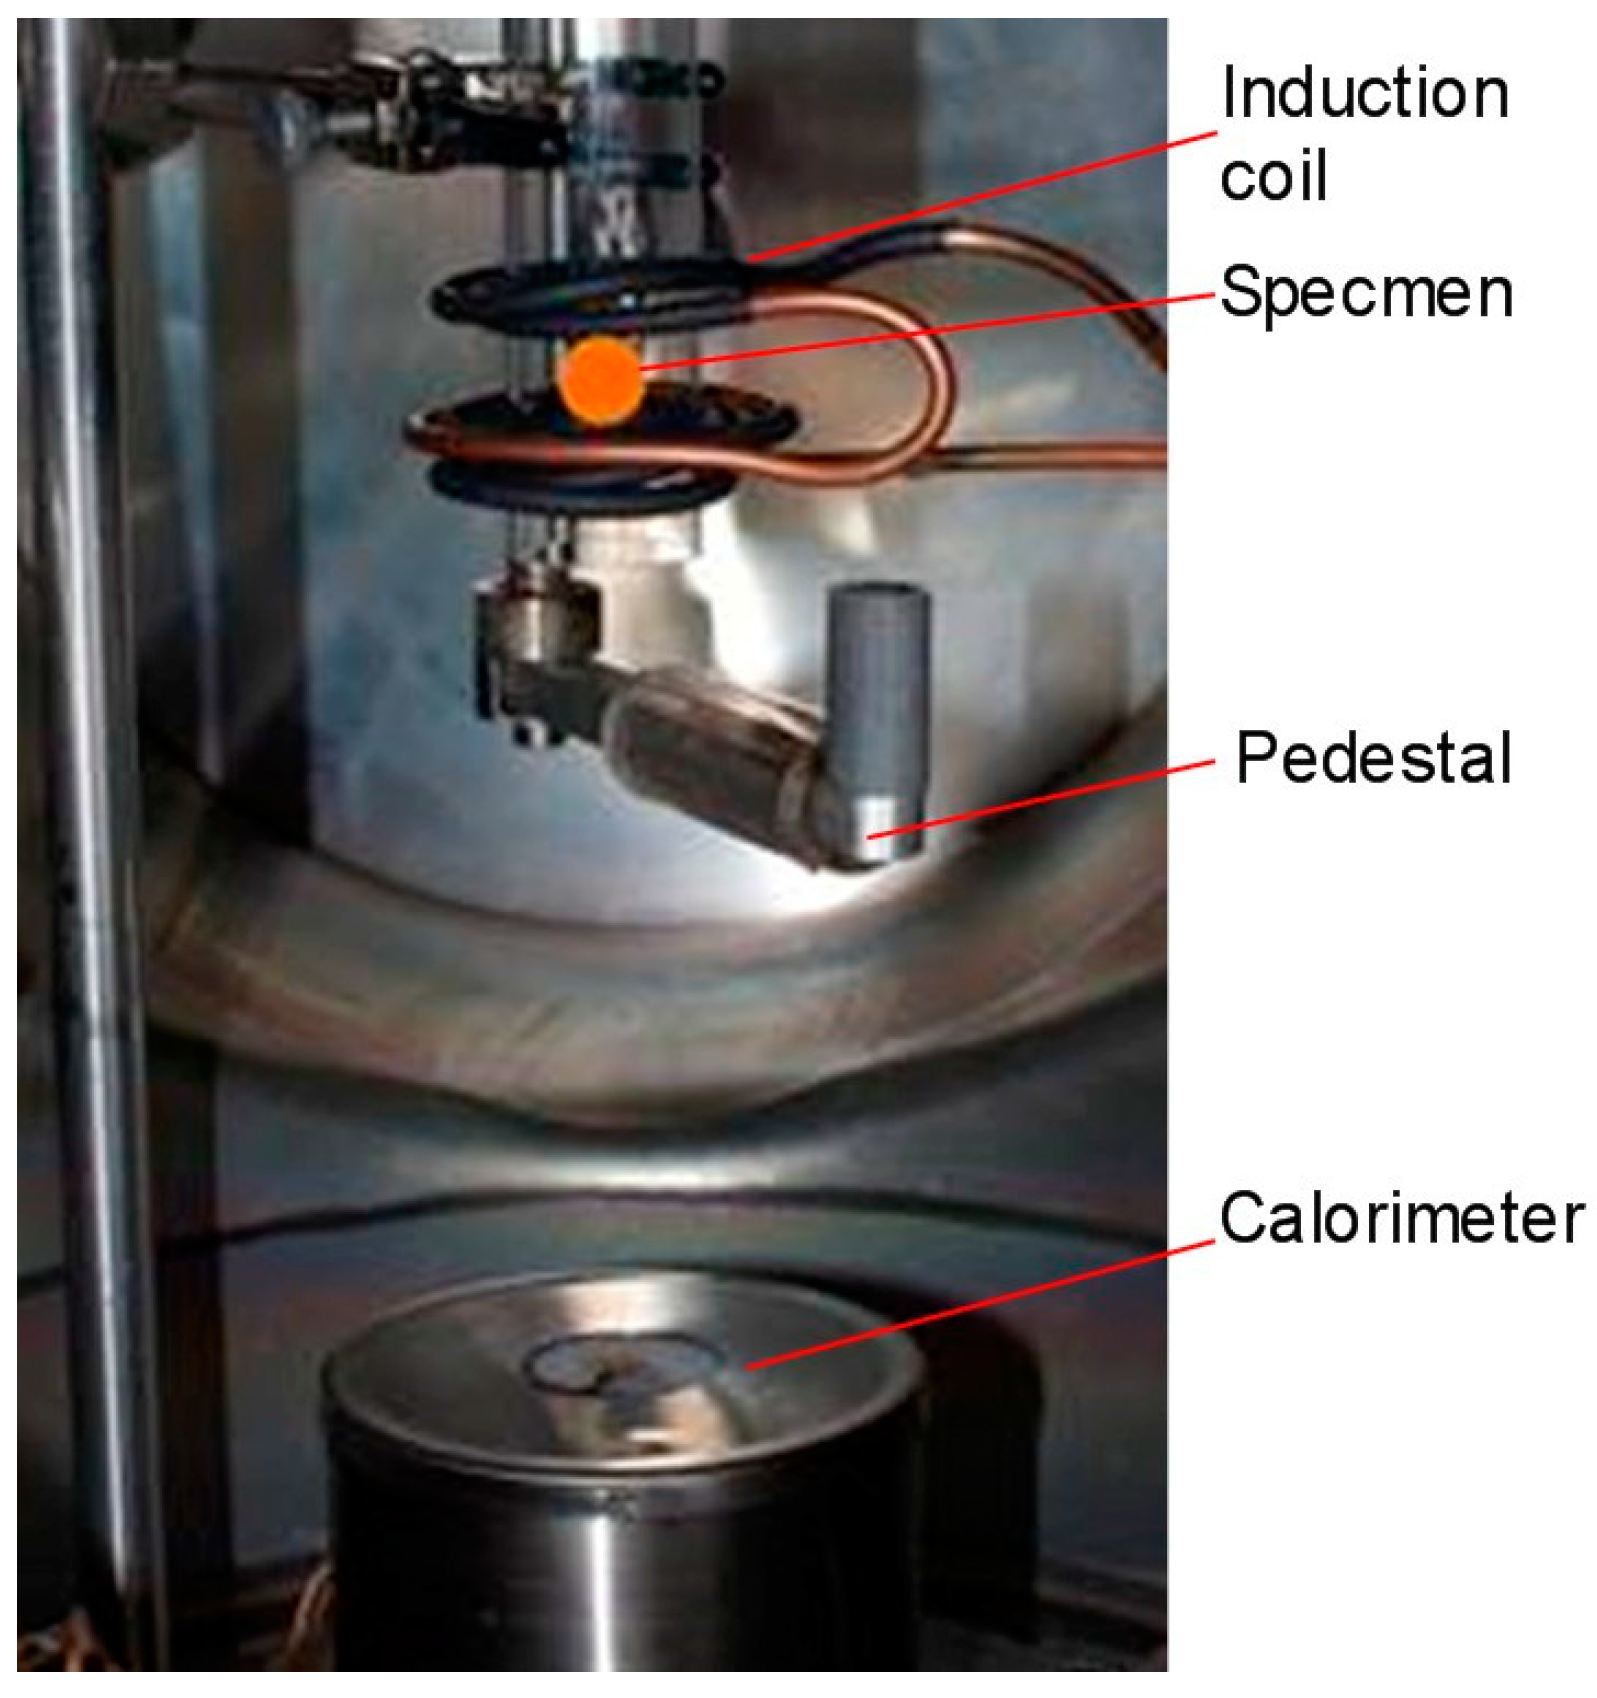
For higher solute content, we turn to a container-less approach and employ electromagnetic levitation coupled with drop-calorimetry (EMLDC). The basic setup is shown in Figure 4. In this method, a stable levitation condition is established with a specimen of known mass under vacuum (10−6 Torr) at a fixed temperature (Tdrop). Temperature is controlled by induction heating with forced gas (ultra-high purity (99.999%) He + 5% H2 gas, supplied by Matheson Company) (He + 5% H2) and measured using a non-contact infrared pyrometer. After a stable condition is reached at Tdrop, the coil is de-energized and the specimen falls by gravity into the calorimeter vessel. The calorimeter vessel is simply a solid copper cup with a conical bottom and a total mass of 167.0 g. The specimen temperature at the time of contact with the calorimeter (Tcon) is computed by accounting for heat loss during the fall period (see Appendix B). The temperature transient in the calorimeter is measured using a thermocouple positioned just below the contact surface. A typical thermal trace is illustrated in Figure 5. The measured signal reflects rapid heat transfer from the specimen to the calorimeter upon contact and the evolution of heat during solidification and other phase changes. After the initial local heating, the measured signal reveals a slow cooling effect associated with heat redistribution within the calorimeter and heat loss from the calorimeter to its surroundings as it returns to temperature, T0.
The measured thermal exchange in the calorimeter is generally given as
where the first three terms on the right-hand-side give contributions from the dropped specimen, including cooling, freezing, and any other solid-state phase transitions that may occur, respectively. The last term is associated with thermal equilibration of the calorimeter, involving heat transfer within the calorimeter itself and thermal exchange with the surroundings. The thermal transient measured in the calorimeter includes all of these contributions, so the specimen contribution is given by
The enthalpy of mixing in the liquid can be determined as
where n is the total number of moles (of atoms) in the specimen, ∆Hf is the molar enthalpy of formation of a given phase at 298 K, fp is the molar phase fraction of each phase, and the first term in parentheses is summed over all phases present in the quenched droplet. The second term in parentheses reflects the total molar enthalpy change for each elemental component, between the 298 K ground state and the liquid at Tcon, and it is summed over all components (Al and Tb in the present case), where xi is the mole fraction of each component. Explicitly:
and
Note that the expression in brackets in Equation (8) gives the total molar enthalpy difference between the quenched droplet at ambient temperature and the unmixed liquid at T = Tcon. The required formation enthalpy (for Al3Tb) is computed using a DFT approach (see Appendix C).
For our experiments, the time scale for the measured local calorimeter heating upon specimen contact is much shorter than the time scale for cooling back to ambient conditions. Accordingly, we model the heating as instantaneous and locally adiabatic followed by Newtonian cooling with a characteristic exponential decay. We note that conditions are not adiabatic, but we define a local adiabatic equivalent temperature, TA, as the maximum temperature that would be reached in the limit of instantaneous adiabatic heating of a small local (i.e., effective) mass of the calorimeter upon specimen contact. The thermal transient measured upon contact with the non-adiabatic copper calorimeter is modeled as
where τ is a calorimeter relaxation time, and TA is a local adiabatic equivalent temperature corresponding to the limit of rapid heat extraction from the specimen. This temperature is treated as a fit parameter, along with τ. Equation (11) describes the measured behavior very closely, as shown by the root-mean-square-error (RMSE) values listed in Table 4, determined over the temperature range T < TA − 0.25 K. Once the values of τ and TA have been determined, the appropriate heat balance can be applied. Moreover, since for this adiabatic heating, Equations (7)–(10) yield
where the calorimeter constant, φ, includes the effective calorimeter mass associated with non-uniform rapid heating upon contact, so that it includes the effects of specimen size and calorimeter size and shape.
The time-dependent heat transfer will be influenced by specimen size for a given calorimeter configuration (size, shape, insulation, thermocouple placement, etc.). Accordingly, determination of the calorimeter constant requires a standard specimen of the approximate size/mass of the specimen for which the enthalpy measurement is to be performed. In this work, two sets of calibration measurements were performed using pure Al specimens, with masses of 0.25 g and 0.5 g, nominally. Calibration measurements are listed along with applicable alloy test measurements in Table 4. Underlined values of the calorimeter constant (φ) indicate an average of measured values determined from applicable calibration experiments listed. The stated specimen temperatures correspond to those shown in Figure 5. Pure Al specimens were used to determine φ for the two different nominal specimen sizes, where:
where m is the specimen mass. We note that Equation (13) can be recovered from Equations (7)–(9) for a pure Al specimen, since and both are equal to zero. Combining Equations (12) and (13), the calorimeter constant was determined using the pure Al samples, and the enthalpies of the alloy specimens were measured using the mean calorimeter constant determined from the calibration runs, as listed (type “cal”) in Table 4 (standard relative uncertainty of 1.3%; see Appendix A).
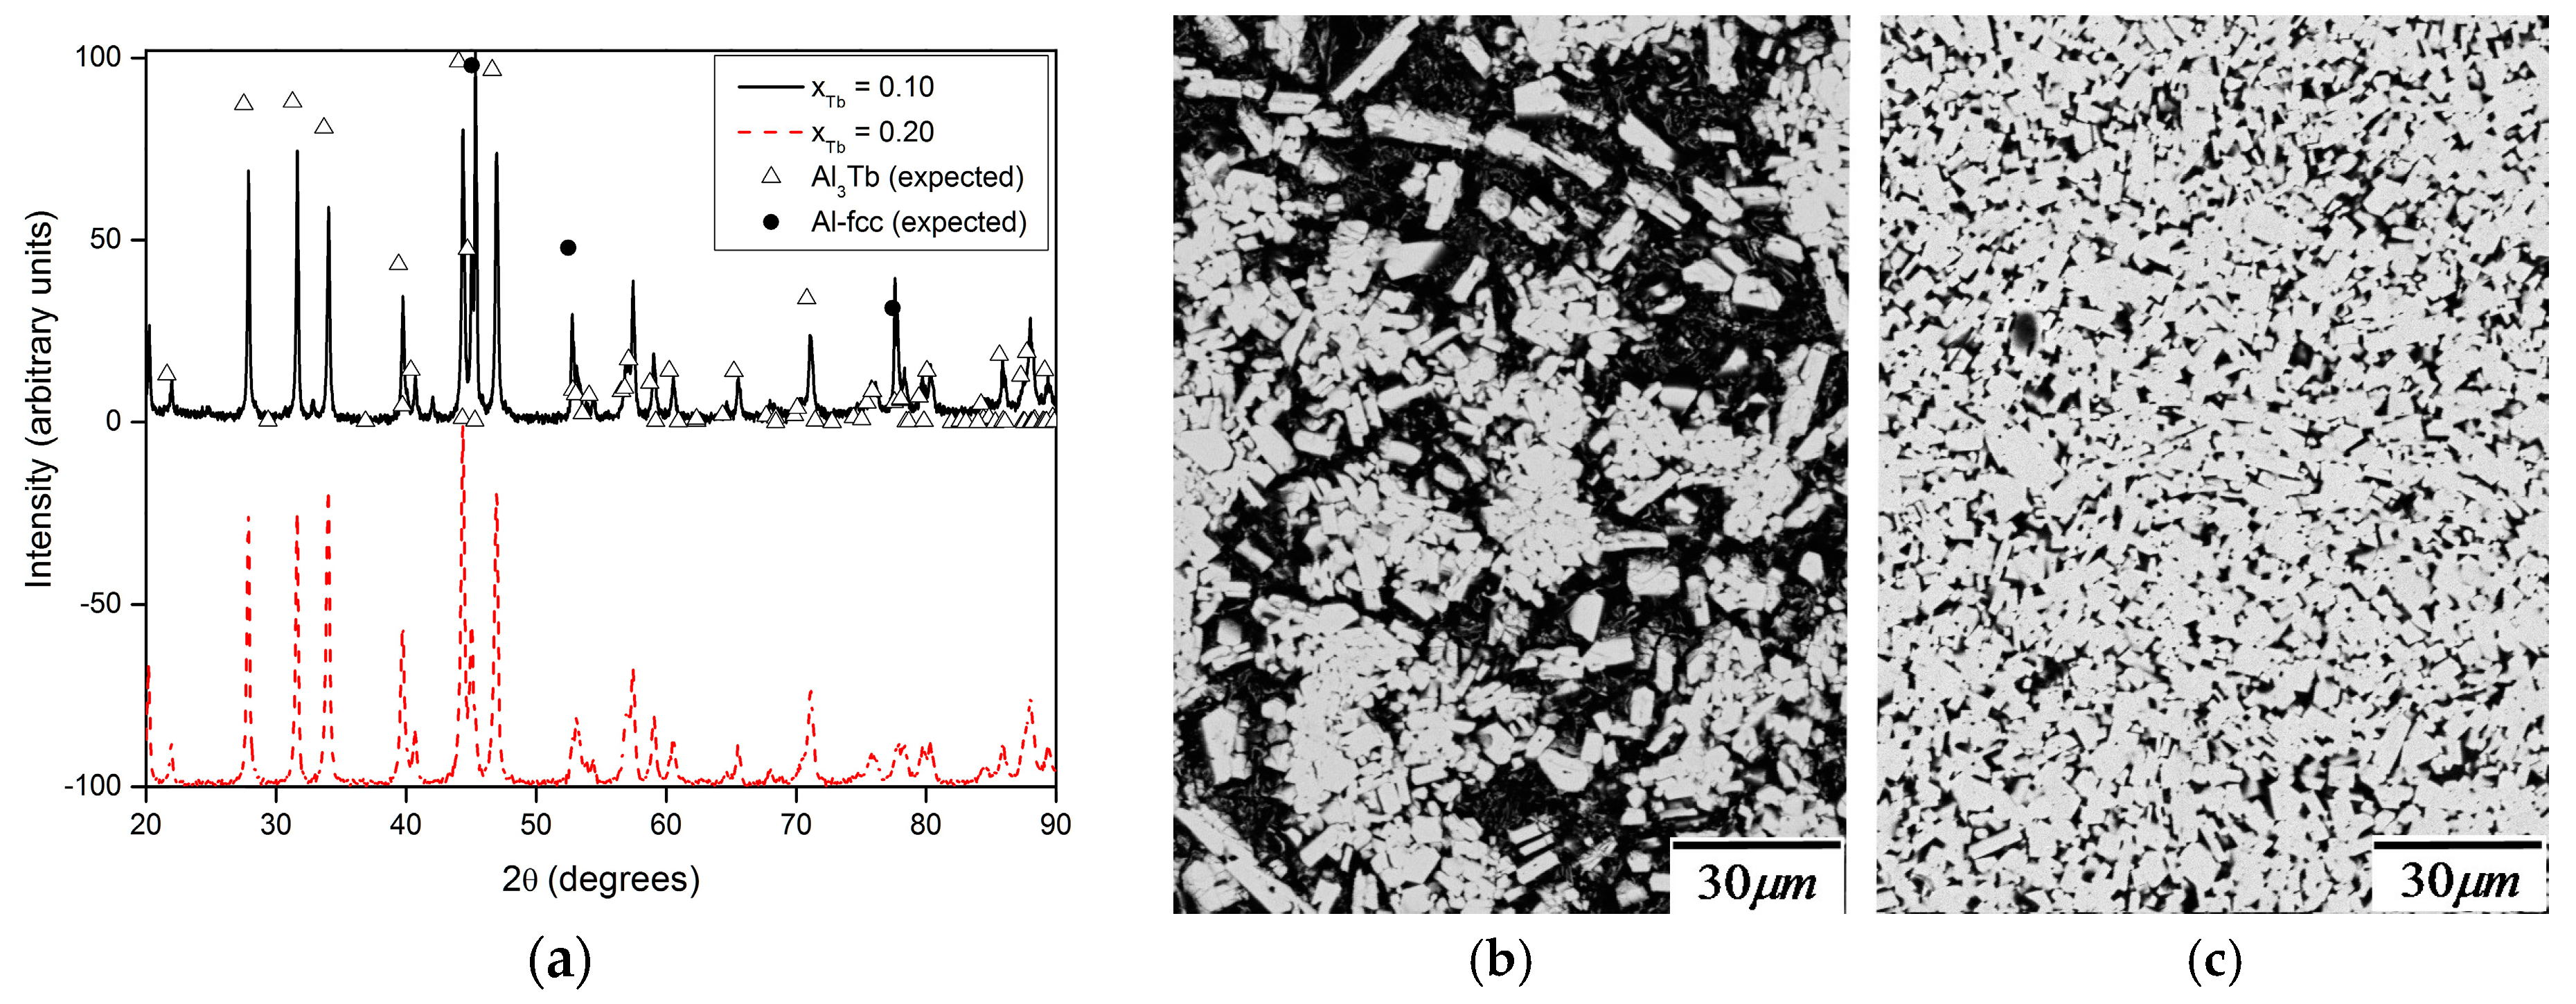
The EMLDC method described above requires determination of the thermodynamic state of the quenched specimen. This requires knowledge of the phases present in the quenched droplet, their relative amounts, and their formation energies. Based on the equilibrium phase diagram, we expect the quenched droplets to be comprised of the Al (fcc) and Al3Tb (δ) phases and estimate the expected molar fraction of the δ phase as 0.4 and 0.8 for alloy compositions () of 0.1 and 0.2, respectively. We verified these estimates experimentally using X-ray diffraction (XRD) and scanning electron microscopy, as shown in Figure 6 (SEM analysis was done using a JEOL JSM-5910LV instrument. XRD was performed with a PANalytical X-Pert Pro diffractometer). Based on the XRD patterns shown in Figure 6a, the phases present in the quenched droplets were identified as Al (fcc) and Al3Tb (δ) for both compositions (. The corresponding microstructures are shown in Figure 6b,c, revealing primary δ phase (light) and a two-phase (fcc + δ) eutectic constituent (dark). To measure the fraction of primary δ, quantitative image analysis was performed using two images (1280 × 960 pixels) for each composition, with pixel sizes of 0.1 and 0.2 mm. Measurements yielding average δ fractions of 0.31 and 0.77 for = 0.1 and 0.2, respectively. Based on the eutectic composition of (see Figure 1), the two-phase eutectic structure is expected to include 12% δ and 88% Al (fcc). Accordingly, the total molar fraction of the δ phase was determined to be 0.396 and 0.797% for 0.1 and 0.2, respectively, in very good agreement with our original estimates of 0.4 and 0.8. Assuming that the formation energy at 0 K is equivalent to the formation enthalpy at 298 K, we computed the required enthalpy of formation for Al3Tb (δ) from first principles, obtaining a value of −43.2 kJ/mol (see Appendix C), relative to the pure Al and Tb reference states at 0 K [53,80].
3. Analysis and Discussion
To establish additional thermodynamic context for our enthalpy of mixing measurements for the Al–Tb liquid phase, we now consider appropriate models and specifically examine the application of three different semi-empirical treatments, all arising from the general model
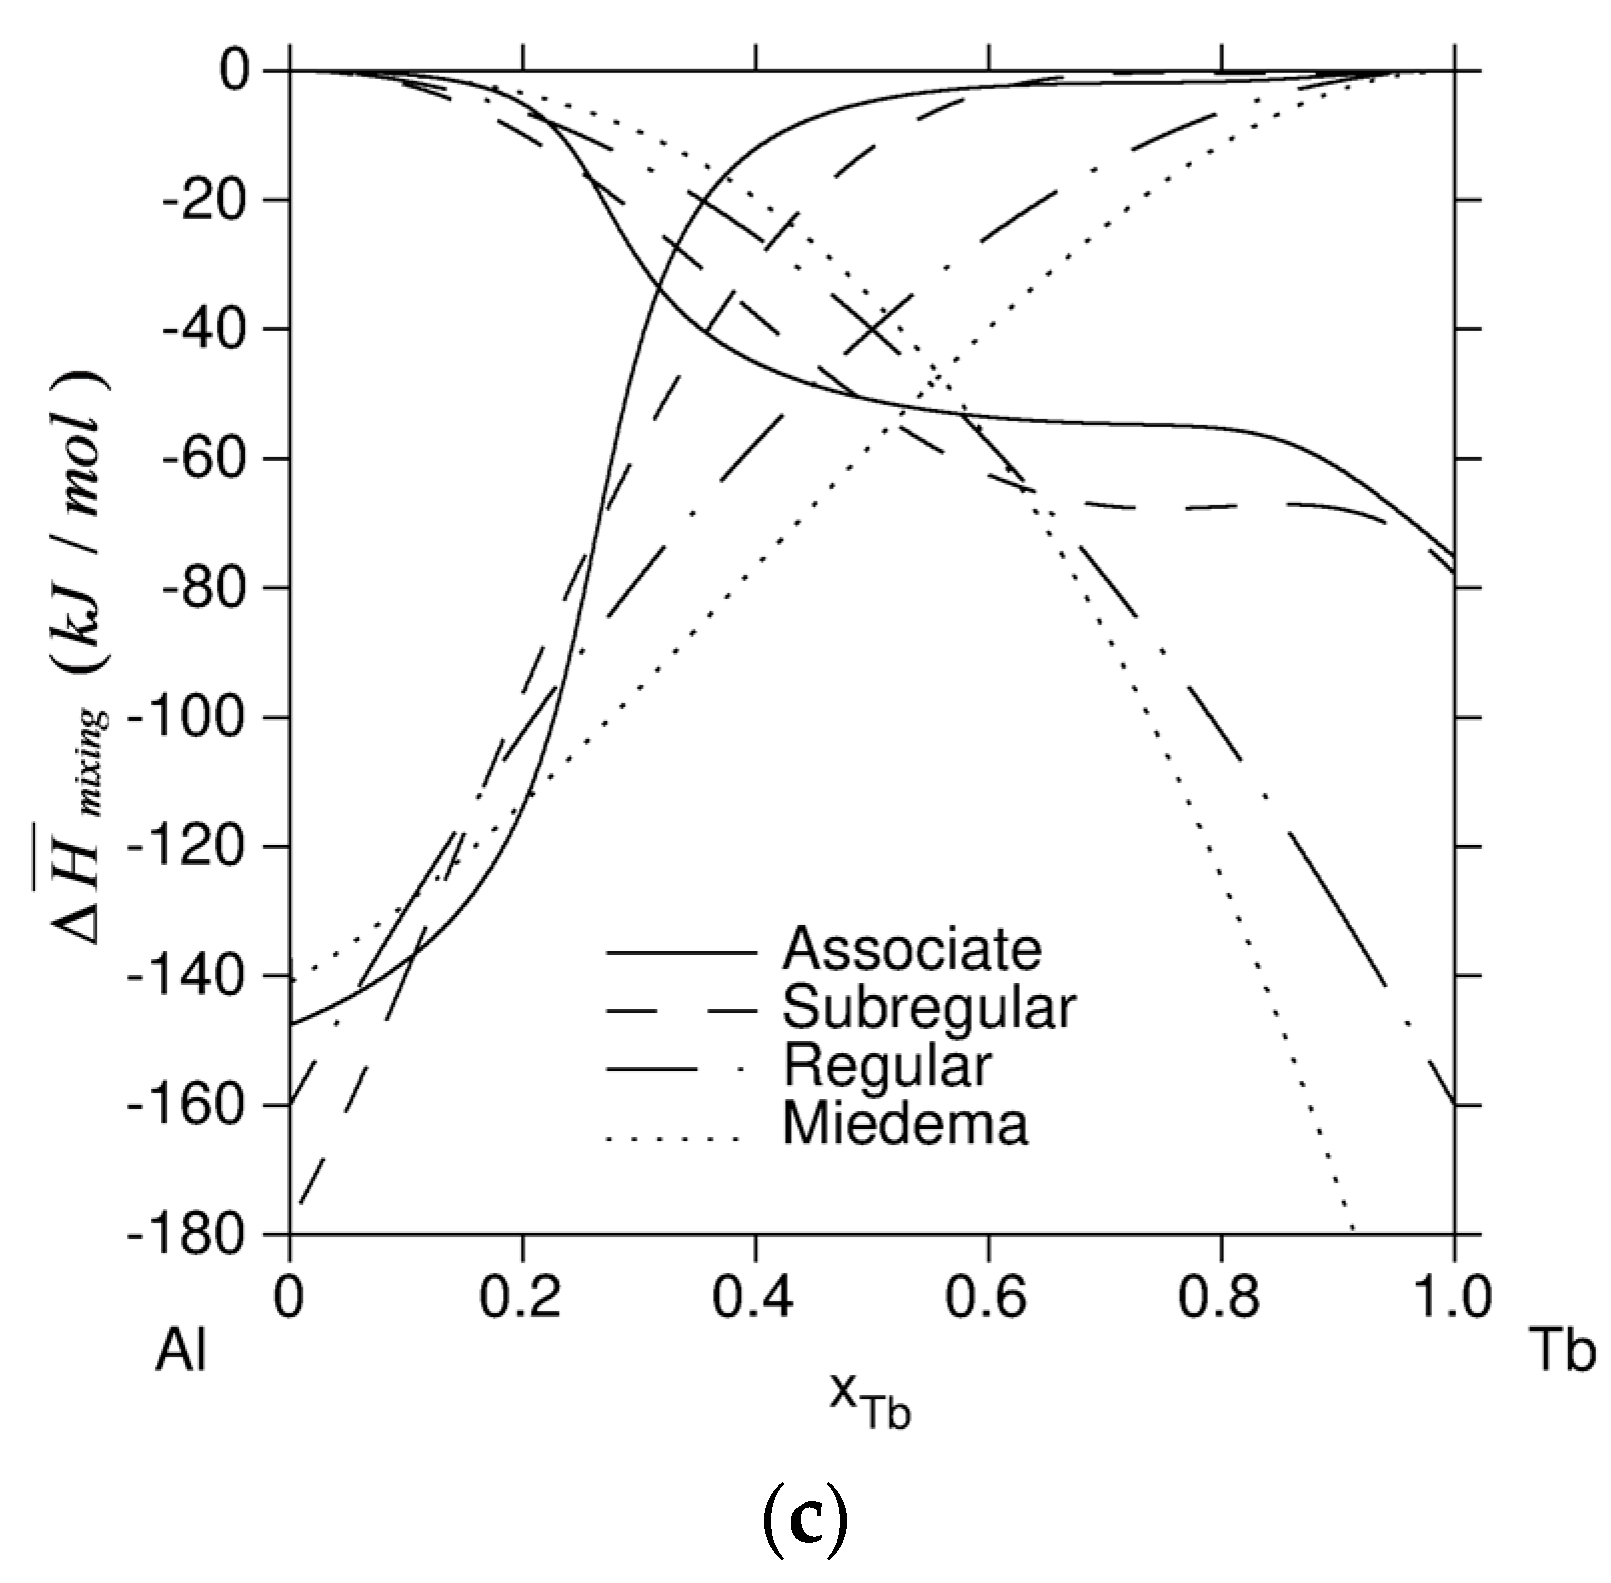
where are the elemental mole fractions, and are mole fractions of associate species Al, Tb, and Al2Tb. The model parameters determined on the basis of our measurements are listed in Table 5. The resulting model descriptions of the mixing enthalpy are plotted in Figure 7 for T = 1364 K and compared with measured values. Corresponding model descriptions of chemical activity and partial molar mixing enthalpy are also plotted. In addition, the Miedema model prediction [76,77,78] is included in each figure for comparison.
It is significant to point out that the experimental data show very good agreement with the Miedema [76,77,78] prediction, which involves no adjustable parameters and serves as a baseline model. These figures also illustrate clearly that all three of the CALPHAD formulations (with the parameters listed in Table 5) provide similar descriptions of ∆Hmix for this alloy over the dilute regime. Comparison of the modeled chemical activities suggests relatively small differences in the non-ideality for Al-rich compositions. This behavior is isolated more clearly in the partial molar mixing enthalpy, plotted in Figure 7c, which shows the different values of in the limit as . Generally, Figure 7 shows that multiple model formulations can provide reasonable descriptions of the measured behavior. Further discrimination will require experimental measurements in intermediate and Tb-rich compositional regimes. Considering the challenges related to crucible reactions, this calls for additional container-less experiments.
4. Conclusions
We report here measurements of the enthalpy of mixing in the liquid phase for Al–Tb alloys, for Tb mole fractions up to . Specifically, we utilize isothermal solution calorimetry and isoperibolic electromagnetic levitation drop calorimetry to measure the enthalpy of mixing, employing X-ray diffraction, scanning electron microscopy, and first principles calculations to provide necessary quantification of the quenched states and component reference states. Based on our measurements, we offer three different assessed semi-empirical solution models for the excess free energy of the liquid, including regular, subregular, and associate model formulations for the enthalpy of mixing. All three of these model formulations provide very good representation of the measured behavior over the limited range examined. Our results highlight the need for additional measurements targeting the composition range of 0.5 < < 0.7, which would enable further refinement of the general model.
Acknowledgments
This work was supported by the U.S. Department of Energy (DOE), Office of Science, Basic Energy Sciences, Materials Science and Engineering Division. The research was performed at the Ames Laboratory, which is operated for the U.S. DOE by Iowa State Univ. under contract No. DE-AC02-07CH11358.
Author Contributions
Shihuai Zhou designed the ISC experiments. Ralph Napolitano and Carl Tackes designed the EMLDC experiments. Shihuai Zhou and Carl Tackes performed the experiments; Shihuai Zhou and Ralph Napolitano analyzed the data. Ralph Napolitano and Shihuai Zhou wrote the paper. All authors have read and approved the final manuscript.
Conflicts of Interest
The authors declare no conflict of interest.
Appendix A
The uncertainties for the calibration constants, β and φ for ISC and EMLDC, respectively, were determined through a series of measurements using pure aluminum (0.9999) standards. For ISC, the measurements were performed with the specimen under argon at atmospheric pressure and a constant temperature of 1411 K. By successive incremental additions of aluminum (at ambient temperature, 298 K) in small amounts (~0.5 g) to a liquid Al bath held in an Al2O3 crucible, ISC measurements of the thermal transient yielded a series of independent measurements of β, with a relative standard deviation of 3.4%, shown in Table A1. Similarly, a set of six measurements were performed to determine the EMLDC calibration constant (φ), using pure aluminum specimens, nominally 0.5 g each (also shown in Table 5). The relative standard deviation was determined to be 0.85%, as shown in Table A1. Based on these measurements and taking the standard uncertainties as 1.5 standard deviations as measured in the calibration experiments, we estimate the standard uncertainties for the ISC and EMLDC methods as 5% and 1.3%, respectively.

Table A1.
Summary of experiments for determination of the standard uncertainty for ISC and EMLDC.
| ISC | EMLDC | |||
|---|---|---|---|---|
| Incremental Mass, Al (g) | Cumulative Mass, Al (g) | Calibration Const. (β) | Total Mass, Al (g) | Calibration Const. (φ) |
| - | 0.10152 | −0.33261 | 0.5206 | 2.692 |
| 0.06331 | 0.16483 | −0.32971 | 0.5159 | 2.710 |
| 0.04129 | 0.20612 | −0.31686 | 0.5190 | 2.657 |
| 0.04251 | 0.24863 | −0.30591 | 0.5133 | 2.693 |
| 0.06162 | 0.31025 | −0.32572 | 0.5173 | 2.717 |
| - | - | - | 0.5168 | 2.718 |
| Mean | - | −0.32216 | - | 2.698 |
| Standard Deviation (SD) | - | 0.01085 | - | 0.023 |
| SD (relative) | - | 3.4% | - | 0.85% |
| Relative Uncert. (1.5 SD) | - | 5.0% | - | 1.3% |
Appendix B
For the EMLDC method, specimen cooling during the drop period was computed to determine the specimen temperature upon contact with the calorimeter:
where and describe convective and radiative cooling during freefall. Using the parameters defined in Table A2, these were computed, respectively, as
where for the spherical drop:
and the Prandtl and Reynolds numbers were taken, respectively, as
Table A2.
Parameters used in the calculation of Tcon.
| Parameter | Description | Units |
|---|---|---|
| Stephan-Boltzmann constant (taken here as 5.67 × 10⁻⁸) | J/m2sK4 | |
| Total hemispherical emissivity (taken here as 0.084) | - | |
| Specimen heat capacity | J/mol | |
| Mass of specimen | g | |
| Specimen molar mass | g/mol | |
| Surface area of specimen | m2 | |
| Volume of specimen | m3 | |
| Fall duration | s | |
| Heat transfer coefficient | W/m2K | |
| Dynamic viscosity (gas) (taken here as 1.90 × 10⁻⁵) | Ns/m2 | |
| Thermal conductivity (gas) (taken here as 0.1513) | W/mK | |
| Specimen diameter | m | |
| Fluid velocity (taken as the average fall velocity) | m/s | |
| Specimen density | Kg/m3 |
Appendix C
The total energy Eθ is computed for each phase using the Vienna ab initio simulation package (VASP) [81,82,83] employing projector augmented wave method [83,84] and Perdew–Burke–Ernzerhof generalized gradient approximation (PBE-GGA) [85]. The “high precision” choice to ensure that the computed absolute energies were converged to a few meV. The spin-polarized electronic-structure calculations were enabled and the Monkhost 24 × 24 × 20 “k-points” were employed for high precision. For each compound, the cell was fully relaxed with respect to distortion and dilatation, and it was confirmed the crystal structure was maintained. The enthalpy of formation for the a given compound is calculated as the difference between the energy Eθ of the compound and the linear combination of the pure element reference state energies, and , so that can be calculated as .
References
- Xing, L.Q.; Hufnagel, T.C.; Eckert, J.; Loser, W.; Schultz, L. Relation between short-range order and crystallization behavior in Zr-based amorphous alloys. Appl. Phys. Lett. 2000, 77, 1970–1972. [Google Scholar] [CrossRef]
- Chen, G.L.; Hui, X.D.; He, G.; Bian, Z. Multicomponent chemical short range order, undercooling, and the formation of bulk metallic glasses. Mater. Trans. 2001, 42, 1095–1102. [Google Scholar] [CrossRef]
- Chen, G.L.; Hui, X.D.; Fan, S.W.; Kou, H.C.; Yao, K.F. Concept of chemical short range order domain and the glass forming ability in multicomponent liquid. Intermetallics 2002, 10, 1221–1232. [Google Scholar] [CrossRef]
- Jakse, N.; Pasturel, A. Glass forming ability and short-range order in a binary bulk metallic glass by ab initio molecular dynamics. Appl. Phys. Lett. 2008, 93, 113104. [Google Scholar] [CrossRef]
- Hao, S.G.; Kramer, M.J.; Wang, C.Z.; Ho, K.M.; Nandi, S.; Kreyssig, A.; Goldman, A.I.; Wessels, V.; Sahu, K.K.; Kelton, K.F.; et al. Experimental and Ab initio structural studies of liquid Zr2Ni. Phys. Rev. B 2009, 79, 104206. [Google Scholar] [CrossRef]
- Huang, L.; Wang, C.Z.; Hao, S.G.; Kramer, M.J.; Ho, K.M. Short-and medium-range order in amorphous Zr2Ni metallic alloy. Phys. Rev. B 2010, 81, 094118. [Google Scholar] [CrossRef]
- Fang, X.W.; Wang, C.Z.; Yao, Y.X.; Ding, Z.J.; Ho, K.M. Signature of Al11Sm3 fragments in undercooled Al90Sm10 liquid from ab initio molecular dynamics simulations. J. Phys. Condens. Matter 2011, 23, 235104. [Google Scholar] [CrossRef] [PubMed]
- Zhao, Y.F.; Lin, D.Y.; Chen, X.H.; Liu, Z.K.; Hui, X.D. Sluggish mobility and strong icosahedral ordering in Mg–Zn–Ca liquid and glassy alloys. Acta Mater. 2014, 67, 266–277. [Google Scholar] [CrossRef]
- Zhang, F.; Sun, Y.; Ye, Z.; Zhang, Y.; Wang, C.-Z.; Mendelev, M.I.; Ott, R.T.; Kramer, M.J.; Ding, Z.-J.; Ho, K.-M. Solute-solute correlations responsible for the prepeak in structure factors of undercooled Al-rich liquids: A molecular dynamics study. J. Phys. Condens. Matter 2015, 27, 205701. [Google Scholar] [CrossRef] [PubMed]
- Sterkhova, I.; Lad’yanov, V.; Kamaeva, L.; Umnova, N.; Umnov, P. On the tendency of the Co-, Ni-, and Fe-based melts to the bulk amorphization. Metall. Mater. Trans. A 2016, 47, 5487–5495. [Google Scholar] [CrossRef]
- Zhu, A.W.; Shiflet, G.J.; Miracle, D.B. Glass forming ranges of Al-rare earth metal alloys: Thermodynamic and kinetic analysis. Scr. Mater. 2004, 50, 987–991. [Google Scholar] [CrossRef]
- Iwamatsu, M.; Lai, S.K. Lowest-energy structures of 13-atom binary clusters: Do icosahedral clusters exist in binary liquid alloys? J. Non Cryst. Solids 2007, 353, 3698–3703. [Google Scholar] [CrossRef]
- Zhu, A.W.; Shiflet, G.J.; Poon, S.J. Atomic bond deficiency as a structural defect in amorphous metals: Relevance to glass transitions. Acta Mater. 2008, 56, 593–601. [Google Scholar] [CrossRef]
- Tian, H.; Zhang, C.; Wang, L.; Zhao, J.J.; Dong, C.; Wen, B.; Wang, Q. Ab initio molecular dynamics simulation of binary Cu64Zr36 bulk metallic glass: Validation of the cluster-plus-glue-atom model. J. Appl. Phys. 2011, 109, 123520. [Google Scholar] [CrossRef]
- Tian, H.; Liu, H.; Zhang, C.; Zhao, J.J.; Dong, C.; Wen, B. Ab initio molecular dynamics simulation of binary Ni62.5Nb37.5 bulk metallic glass: Validation of the cluster-plus-glue-atom model. J. Mater. Sci. 2012, 47, 7628–7634. [Google Scholar] [CrossRef]
- Hao, S.G.; Wang, C.Z.; Li, M.Z.; Napolitano, R.E.; Mendelev, M.I.; Ho, K.M. Prediction of cooling rate dependent ordering in metallic glass transition using a two-state model. Comput. Mater. Sci. 2010, 49, 615–618. [Google Scholar] [CrossRef]
- Hao, S.G.; Wang, C.Z.; Li, M.Z.; Napolitano, R.E.; Ho, K.M. Dynamic arrest and glass formation induced by self-aggregation of icosahedral clusters in Zr1−xCux alloys. Phys. Rev. B 2011, 84, 064203. [Google Scholar] [CrossRef]
- Guo, J.Q.; Ohtera, K.; Kita, K.; Nagahora, J.; Kazama, N.S. Crystallization behavior of Al100−xSmx (x = 8–14 at%) amorphous-alloys. Mater. Lett. 1995, 24, 133–138. [Google Scholar] [CrossRef]
- Inoue, A. Amorphous, nanoquasicrystalline and nanocrystalline alloys in Al-based systems. Prog. Mater. Sci. 1998, 43, 365–520. [Google Scholar] [CrossRef]
- Rizzi, P.; Antonione, C.; Baricco, M.; Battezzati, L.; Armelao, L.; Tondello, E.; Fabrizio, M.; Daolio, S. Crystals and nanocrystals in rapidly solidified Al–Sm alloys. Nanostruct. Mater. 1998, 10, 767–776. [Google Scholar] [CrossRef]
- Wilde, G.; Sieber, H.; Perepezko, J.H. Glass formation versus nanocrystallization in an Al92Sm8 alloy. Scr. Mater. 1999, 40, 779–783. [Google Scholar] [CrossRef]
- Wilde, G.; Sieber, H.; Perepezko, J.H. Glass formation in Al-rich Al–Sm alloys during solid state processing at ambient temperature. J. Non Cryst. Solids 1999, 252, 621–625. [Google Scholar] [CrossRef]
- Tjong, S.C.; Wang, J.Q. Microstructure and devitrification behavior of melt-spun Al-rich metallic glasses and nanostructured composites. Z. Metallkunde 2001, 92, 610–616. [Google Scholar]
- Perepezko, J.H.; Hebert, R.J.; Wu, R.I.; Wilde, G. Primary crystallization in amorphous Al-based alloys. J. Non Cryst. Solids 2003, 317, 52–61. [Google Scholar] [CrossRef]
- Kalay, Y.E.; Chumbley, L.S.; Kramer, M.J.; Anderson, I.E. Local structure in marginal glass forming Al–Sm alloy. Intermetallics 2010, 18, 1676–1682. [Google Scholar] [CrossRef]
- Kalay, Y.E.; Yeager, C.; Chumbley, L.S.; Kramer, M.J.; Anderson, I.E. Initial crystallization in a nanostructured Al–Sm rare earth alloy. J. Non Cryst. Solids 2010, 356, 1416–1424. [Google Scholar] [CrossRef]
- Zhang, F.; McBrearty, I.; Ott, R.T.; Park, E.; Mendelev, M.I.; Kramer, M.J.; Wang, C.Z.; Ho, K.M. Discovery of a meta-stable Al–Sm phase with unknown stoichiometry using a genetic algorithm. Scr. Mater. 2014, 81, 32–35. [Google Scholar] [CrossRef]
- Ye, Z.; Zhang, F.; Sun, Y.; Mendelev, M.I.; Ott, R.T.; Park, E.; Besser, M.F.; Kramer, M.J.; Ding, Z.; Wang, C.Z.; et al. Discovery of a metastable Al20Sm4 phase. Appl. Phys. Lett. 2015, 106, 101903. [Google Scholar] [CrossRef]
- Bokas, G.B.; Zhao, L.; Perepezko, J.H.; Szlufarska, I. On the role of Sm in solidification of Al–Sm metallic glasses. Scr. Mater. 2016, 124, 99–102. [Google Scholar] [CrossRef]
- Sanders, W.S.; Warner, J.S.; Miracle, D.B. Stability of Al-rich glasses in the Al–La–Ni system. Intermetallics 2006, 14, 348–351. [Google Scholar] [CrossRef]
- Hackenberg, R.E.; Gao, M.C.; Kaufman, L.; Shiflet, G.J. Thermodynamics and phase equilibria of the Al–Fe–Gd metallic glass-forming system. Acta Mater. 2004, 52, 3745. [Google Scholar] [CrossRef]
- Wang, W.; Tang, Z.L.; Zhan, C.Y.; Nie, Z.R. Calculations of formation enthalpies of Al–Re intermetallics. Rare Met. Mater. Eng. 2009, 38, 2100–2105. [Google Scholar]
- Wang, H.Y.; Gao, X.Y.; Zeng, J.M.; Ren, H.P.; Zhao, Y.J. First-principles of phase stability and solubility of Al–Re (La, Y) alloy. Rare Met. Mater. Eng. 2017, 46, 735–739. [Google Scholar]
- Wu, R.I.; Wilde, G.; Perepezko, J.H. Glass formation and primary nanocrystallization in Al-base metallic glasses. Mater. Sci. Eng. A 2001, 301, 12–17. [Google Scholar] [CrossRef]
- Sun, S.P.; Yi, D.Q.; Liu, H.Q.; Zang, B.; Jiang, Y. Calculation of glass forming ranges in Al–Ni–Re (Ce, La, Y) ternary alloys and their sub-binaries based on Miedema’s model. J. Alloys Compd. 2010, 506, 377–387. [Google Scholar] [CrossRef]
- Zhu, A.W.; Poon, S.J.; Shiflet, G.J. On glass formability of Al–Gd–Ni (Fe). Scr. Mater. 2004, 50, 1451–1455. [Google Scholar] [CrossRef]
- Csontos, A.A.; Shiflet, G.J. Formation and chemistry of nanocrystalline phases formed during deformation in aluminum-rich metallic glasses. Nanostruct. Mater. 1997, 9, 281–289. [Google Scholar] [CrossRef]
- Baricco, M.; Gaertner, F.; Cacciamani, G.; Rizzi, P.; Battezzati, L.; Greer, A.L. Thermodynamics of homogeneous crystal nucleation in Al–Re metallic glasses. Mater. Sci. Forum 1998, 269, 553–558. [Google Scholar] [CrossRef]
- Boucharat, N.; Rosner, H.; Perepezko, J.H.; Wilde, G. Devitrification of Al-based glass forming alloys. Mater. Sci. Eng. A 2004, 375, 713–717. [Google Scholar] [CrossRef]
- Jia, Y.B.; Song, H.F.; Chao, Q.; Wang, Q.; Dong, Y.D. Glass-forming ability and thermal stability of (Ce–La)–Ni–Al bulk amorphous alloys. Rare Metal Mater. Eng. 2010, 39, 997–1001. [Google Scholar]
- Antonowicz, J. Atomic packing and phase separation in Al-rare earth metallic glasses. J. Mater. Sci. 2010, 45, 5040–5044. [Google Scholar] [CrossRef]
- Li, R.; Stoica, M.; Wang, G.; Park, J.M.; Li, Y.; Zhang, T.; Eckert, J. Glass formation, thermal properties, and elastic constants of La–Al–Co alloys. J. Mater. Res. 2010, 25, 1398–1404. [Google Scholar] [CrossRef]
- Chen, Z.; Angell, C.A.; Richert, R. On the dynamics of liquids in their viscous regime approaching the glass transition. Eur. Phys. J. E 2012, 35, 1–7. [Google Scholar] [CrossRef] [PubMed]
- Angell, C.A. The viscous-liquid-glassy-solid problem. Acs. Sym. Ser. 1997, 676, 14–26. [Google Scholar]
- Angell, C.A. Entropy and fragility in supercooling liquids. J. Res. Natl. Inst. Stand. Technol. 1997, 102, 171–185. [Google Scholar] [CrossRef] [PubMed]
- Gschneidner, K.A., Jr.; Calderwood, F.W. The Al–Re (aluminum-rare earth) systems. Bull. Alloy Phase Diagr. 1988, 9, 658–668. [Google Scholar] [CrossRef]
- Benigni, P.; Hassam, S.; Decreton, A.; Mikaelian, G.; Gajavalli, K.; Barrachin, M.; Fischer, E.; Rogez, J. Enthalpy of mixing in the Ag–Cd–In ternary liquid phase. J. Chem. Thermodyn. 2017, 107, 207–215. [Google Scholar] [CrossRef]
- Debski, A.; Gasior, W. Calorimetric measurements of the Li–Zn system. Direct reaction method and mixing enthalpy. J. Chem. Thermodyn. 2016, 98, 111–117. [Google Scholar] [CrossRef]
- Nusperling, E.M.; Thiedemann, U.; Schaefers, K.; Qin, J.; Rosner-Kuhn, M.; Frohberg, M.G. Mixing enthalpy measurements of liquid Fe–Nb–V alloys by levitation alloying calorimetry. Rev. Metall. 1997, 94, 219–226. [Google Scholar]
- Naguet, C.; Azzaoui, M.; Fionari, J.M.; Vassiliev, V.; Hertz, J.; Bourkba, A.; Bouirden, L. Semi-experimental mixing enthalpy of ternary liquid phases as a support of phase-diagrams calculation. J. Chim. Phys. 1997, 94, 1026–1035. [Google Scholar] [CrossRef]
- Zhou, S.; Napolitano, R.E. Phase equilibria and thermodynamic limits for partitionless crystallization in the Al–La binary system. Acta Mater. 2006, 54, 831–840. [Google Scholar] [CrossRef]
- Jin, L.L.; Kang, Y.B.; Chartrand, P.; Fuerst, C.D. Thermodynamic evaluation and optimization of Al–La, Al–Ce, Al–Pr, Al–Nd and Al–Sm systems using the modified quasichemical model for liquids. Calphad 2011, 35, 30–41. [Google Scholar] [CrossRef]
- Gao, M.C.; Rollett, A.D.; Widom, M. Lattice stability of aluminum-rare earth binary systems: A first-principles approach. Phys. Rev. B 2007, 75, 174120. [Google Scholar] [CrossRef]
- Yang, Q.; Liu, X.; Bu, F.; Meng, F.; Zheng, T.; Zhang, D.; Meng, J. First-principles phase stability and elastic properties of Al–La binary system intermetallic compounds. Intermetallics 2015, 60, 92–97. [Google Scholar] [CrossRef]
- Esin, Y.O.; Kolesnikov, S.P.; Baev, V.M.; Petrushevskii, M.S.; Geld, P.V. Formation enthalpies of liquid binary-alloys of aluminum and tin with lanthanum. Zhurnal Fizicheskoi Khimii 1981, 55, 1587–1588. [Google Scholar]
- Sommer, F.; Keita, M.; Krull, H.G.; Predel, B.; Lee, J.J. Thermodynamic investigations of Al–La alloys. J. Less Common Met. 1988, 137, 267–275. [Google Scholar] [CrossRef]
- Borzone, G.; Cardinale, A.M.; Parodi, N.; Cacciamani, G. Aluminum compounds of the rare earths: Enthalpies of formation of Yb–Al and La–Al alloys. J. Alloys Compd. 1997, 247, 141–147. [Google Scholar] [CrossRef]
- Gao, M.C.; Unlu, N.; Shiflet, G.J.; Mihalkovic, M.; Widom, M. Reassessment of Al–Ce and Al–Nd binary systems supported by critical experiments and first-principles energy calculations. Met. Mater. Trans. A 2005, 36, 3269–3279. [Google Scholar] [CrossRef]
- Kang, Y.B.; Pelton, A.D.; Chartrand, P.; Fuerst, C.D. Critical evaluation and thermodynamic optimization of the Al–Ce, Al–Y, Al–Sc and Mg–Sc binary systems. Calphad 2008, 32, 413–422. [Google Scholar] [CrossRef]
- Ivanov, M.I.; Berezutskii, V.V.; Shevchenko, M.A.; Kudin, V.G.; Sudavtsova, V.S. Thermodynamic properties of binary Al–Ce and Ce–Fe alloys. Powder Metall. Met. Ceram. 2015, 54, 80–92. [Google Scholar] [CrossRef]
- Esin, Y.O.; Ryss, G.M.; Geld, P.V. Enthalpies of the formation of liquid alloys of cerium with aluminum. Zhurnal Fizicheskoi Khimii 1979, 53, 2380–2381. [Google Scholar]
- Kober, V.I.; Lebedev, V.A.; Nichkov, I.F.; Raspopin, S.P.; Yamshchi, L.F. Thermodynamic properties of aluminum-rich Ce–Al alloys. Russ. Metall. 1973, 2, 163–166. [Google Scholar]
- Shevchenko, M.O.; Berezutskii, V.V.; Ivanov, M.I.; Sudavtsova, V.S. Thermodynamic properties of binary Al–Pr alloys. Powder Metall. Met. Ceram. 2016, 55, 78–90. [Google Scholar] [CrossRef]
- Zviadadze, G.N.; Chkhikvadze, L.A.; Kereselidze, M.V. Thermodynamic properties of binary melts of some rare earth metals with aluminum. Soobshch. Akad. Nauk. Gruz. SSR 1976, 81, 149–152. [Google Scholar]
- Zhou, S.H.; Wang, Y.; Chen, L.Q.; Liu, Z.K.; Napolitano, R.E. Solution-based thermodynamic modeling of the Ni–Ta and Ni–Mo–Ta systems using first-principle calculations. Calphad 2009, 33, 631–641. [Google Scholar] [CrossRef]
- Zhou, S.H.; Napolitano, R.E. Modeling of thermodynamic properties and phase equilibria for the Al–Sm binary system. Met. Mater.Trans. A 2008, 39, 502–512. [Google Scholar] [CrossRef]
- Shevchenko, M.O.; Berezutski, V.V.; Ivanov, M.I.; Kudin, V.G.; Sudavtsova, V.S. Thermodynamic properties of alloys of the binary Al–Sm, Sm–Sn and ternary Al–Sm–Sn systems. J. Phase Equilib. Diffus. 2015, 36, 39–52. [Google Scholar] [CrossRef]
- Bo, H.; Liu, L.B.; Hu, J.L.; Zhang, X.D.; Jin, Z.P. Thermodynamic re-assessment of the Al–Gd and Gd–Zr systems. Thermochim. Acta 2014, 591, 51–56. [Google Scholar] [CrossRef]
- Jin, L.; Kang, Y.B.; Chartrand, P.; Fuerst, C.D. Thermodynamic evaluation and optimization of Al–Gd, Al–Tb, Al–Dy, Al–Ho and Al–Er systems using a modified quasichemical model for the liquid. Calphad 2010, 34, 456–466. [Google Scholar] [CrossRef]
- Grobner, J.; Kevorkov, D.; Schmid-Fetzer, R. Thermodynamic calculation of Al–Gd and Al–Gd–Mg phase equilibria checked by key experiments. Z. Metallkunde 2001, 92, 22–27. [Google Scholar]
- Kanibolotsky, D.S.; Golovataya, N.V.; Lisnyak, V.V. Calorimetric study of liquid gadolinium-based alloys. J. Therm. Anal. Calorim. 2004, 76, 323–327. [Google Scholar] [CrossRef]
- Kanibolotsky, D.S.; Golovataya, N.V.; Bieloborodova, O.A.; Lisnyak, V.V. Calorimetric investigation of liquid Al–Ga–Gd alloys. Thermochim. Acta 2004, 421, 111–115. [Google Scholar] [CrossRef]
- Bo, H.; Liu, L.B.; Xiong, X.; Jin, Z.P. Thermodynamic assessment of the Al–Dy, Dy–Zr and Al–Dy–Zr systems. Chin. Sci. Bull. 2014, 59, 1738–1746. [Google Scholar] [CrossRef]
- Meng, F.G.; Zhang, L.G.; Liu, H.S.; Liu, L.B.; Jin, Z.P. Thermodynamic optimization of the Al–Yb binary system. J. Alloys Compd. 2008, 452, 279–282. [Google Scholar] [CrossRef]
- Sommer, F. Association model for the description of thermodynamic functions of liquid alloys II.—Numerical treatment and results. Z. Metallkunde 1982, 73, 77–86. [Google Scholar]
- Miedema, A.R. A simple model for alloys: I. Rules for the alloying behaviour of transition metals. Philips Tech. Rev. 1973, 33, 149–160. [Google Scholar]
- Miedema, A.R. A simple model for alloys: II. The influence of ionicity on the stability and other physical properties of alloys. Philips Tech. Rev. 1973, 33, 196–202. [Google Scholar]
- Zhang, R.F.; Zhang, S.H.; He, Z.J.; Jing, J.; Sheng, S.H. Miedema calculator: A thermodynamic platform for predicting formation enthalpies of alloys within framework of Miedema’s theory. Comput. Phys. Commun. 2016, 209, 58–69. [Google Scholar] [CrossRef]
- Dinsdale, A.T. SGTE data for pure elements. Calphad 1991, 4, 317–425. [Google Scholar] [CrossRef]
- Colinet, C.; Pastural, A.; Buschow, K.H.J. Molar enthalpies of formation of LnAl2 compounds. J. Chem. Thermodyn. 1985, 17, 1133–1139. [Google Scholar] [CrossRef]
- Kresse, G.; Furthmüller, J. Efficient iterative schemes for ab initio total-energy calculations using a plane-wave basis set. Phys. Rev. B 1996, 54, 11169–11186. [Google Scholar] [CrossRef]
- Kresse, G.; Hafner, J. Ab initio molecular-dynamics simulation of the liquid-metal amorphous-semiconductor transition in germanium. Phys. Rev. B 1994, 49, 14251–14269. [Google Scholar] [CrossRef]
- Kresse, G.; Joubert, D. From ultrasoft pseudopotentials to the projector augmented-wave method. Phys. Rev. B 1999, 59, 1758–1775. [Google Scholar] [CrossRef]
- Blöchl, P.E. Projector augmented-wave method. Phys. Rev. B 1994, 50, 17953–17979. [Google Scholar] [CrossRef]
- Perdew, J.P.; Burke, K.; Ernzerhof, M. Generalized gradient approximation made simple. Phys. Rev. Lett. 1996, 77, 3865–3868. [Google Scholar] [CrossRef] [PubMed]
Figure 1.
The assessed Al–Tb phase diagram.

Figure 2.
A schematic representation of the ISC, showing the essential calorimetry and specimen handling features (primary heating and vacuum systems not shown).
Figure 2.
A schematic representation of the ISC, showing the essential calorimetry and specimen handling features (primary heating and vacuum systems not shown).

Figure 3.
A typical ISC trace showing the thermal transient upon Tb specimen injection.

Figure 4.
The levitation, heating, and calorimetry components of the EMLDC equipment.

Figure 5.
An example thermal trace, showing the characteristic temperatures (as listed in Table 4) for the EMLDC method.
Figure 5.
An example thermal trace, showing the characteristic temperatures (as listed in Table 4) for the EMLDC method.

Figure 6.
(a) XRD patterns indicating the fcc + δ constitution of the quenched alloys, with = 0.4 and 0.8 for = 0.1 and 0.2, respectively (XRD specimens: sectioned and diamond-polished to 0.6 μm finish); (b,c) SEM images of EMLDC specimens showing the δ phase (light) and a two-phase eutectic constituent (dark) for alloy compositions of = (b) 0.1 and (c) 0.2 (backscattered electron contrast, 20 kV accelerating voltage, 10 mm working distance).

Figure 7.
The liquid models: (a) mixing enthalpy with measured values; (b) chemical activity; and (c) partial molar enthalpy of mixing, calculated for T = 1364 K (all referenced to pure Al and Tb liquid states).
Figure 7.
The liquid models: (a) mixing enthalpy with measured values; (b) chemical activity; and (c) partial molar enthalpy of mixing, calculated for T = 1364 K (all referenced to pure Al and Tb liquid states).


Table 1.
A listing of thermodynamic mixing property measurements, calculations, and phase diagram assessments reported for the Al–RE (lanthanide) binary systems.
Table 1.
A listing of thermodynamic mixing property measurements, calculations, and phase diagram assessments reported for the Al–RE (lanthanide) binary systems.
| System | CALPHAD Assessments | FP Calculations of Crystal Phase Energies | Experimental Measurement of Liquid Mixing Properties |
|---|---|---|---|
| Al–La | [51,52] | [53,54] | [55,56,57] |
| Al–Ce | [52,58,59] | [53] | [60,61,62] |
| Al–Pr | [52,63] | [53] | [63,64] |
| Al–Nd | [52,58] | [53] | [64] |
| Al–Pm | - | [53] | - |
| Al–Sm | [52,65] | [53,66] | [67] |
| Al–Eu | - | [53] | - |
| Al–Gd | [68,69,70] | [53] | [71,72] |
| Al–Tb | [69] | [53] | - |
| Al–Dy | [69,73] | [53] | - |
| Al–Ho | [69] | [53] | - |
| Al–Tm | - | [53] | - |
| Al–Yb | [74] | [53] | - |
| Al–Lu | - | [53] | - |
Table 2.
ISC calibration data.
| Parameter | Value |
|---|---|
| Ta | 298 K |
| T0 | 1364 K |
| 9.4869 g | |
| mAl | 0.7009 g |
| MAl | 26.98 g/mol |
| MTb | 158.93 g/mol |
| 826.05 J | |
| 278.26 J | |
| −13,247.6 sK | |
| −0.08336 ± 5% J/sK |
Table 3.
Incremental ISC mixing enthalpy measurements for T0 = 1364 K.
| mAl (g) | δmTb (g) | mTb (g) | δqmix (J/mol) | ∆Hmix (J/mol) | |
|---|---|---|---|---|---|
| 10.1878 | 1.8528 | 1.8528 | 0.03 | −4955.05 | −4955.05 |
| - | 1.5676 | 3.4288 | 0.05 | −3994.04 | −8949.09 |
| - | 1.4322 | 4.8610 | 0.08 | −2044.05 | −10,993.1 |
| 10.85 | 6.4362 | 6.4362 | 0.09 | −1074.16 | - |
| - | 1.4510 | 7.8872 | 0.11 | −943.902 | - |
Table 4.
Summary of EMLDC measurements for ∆Hmix for Al–Tb liquid.
| # | Type | Mass (g) | Tdrop (K) | Tcon | T0 (K) | TA (K) | T∞ (K) | RMSE (K) | qcal (J/mol) | ∆Hmix (kJ/mol) | ||
|---|---|---|---|---|---|---|---|---|---|---|---|---|
| 1 | cal | 0 | 0.5206 | 1245.0 | 1241.8 | 292.3 | 304.4 | 294.9 | 0.013 | 744.4 | 2.692 | - |
| 2 | cal | 0 | 0.5159 | 1161.8 | 1159.1 | 298.0 | 309.0 | 294.7 | 0.004 | 684.9 | 2.710 | - |
| 3 | cal | 0 | 0.5190 | 1176.3 | 1173.5 | 298.2 | 309.7 | 295.2 | 0.031 | 697.6 | 2.657 | - |
| 4 | cal | 0 | 0.5133 | 1078.9 | 1076.5 | 295.9 | 306.2 | 294.6 | 0.042 | 632.7 | 2.693 | - |
| 5 | cal | 0 | 0.5173 | 1303.7 | 1297.7 | 296.5 | 309.0 | 294.7 | 0.016 | 773.2 | 2.717 | - |
| 6 | cal | 0 | 0.5168 | 1258.9 | 1255.7 | 298.1 | 310.1 | 295.3 | 0.001 | 744.7 | 2.718 | - |
| 7 | meas | 0.1 | 0.4796 | 1292.0 | 1286.1 | 297.5 | 305.6 | 296.2 | 0.015 | 493.1 | 2.698 | −16.61 |
| 8 | cal | 0 | 0.2476 | 1080.3 | 1076.5 | 292.9 | 298.1 | 293.2 | 0.001 | 307.5 | 2.570 | - |
| 9 | cal | 0 | 0.2467 | 1245.6 | 1240.7 | 295.4 | 301.4 | 293.7 | 0.024 | 353.6 | 2.585 | - |
| 10 | meas | 0.2 | 0.3476 | 1406.5 | 1394.7 | 294.6 | 300.4 | 294.0 | 0.004 | 343.2 | 2.578 | −27.08 |
| 11 | meas | 0.2 | 0.3249 | 1439.5 | 1426.7 | 293.1 | 298.8 | 293.2 | 0.007 | 332.0 | 2.578 | −26.37 |
Table 5.
Parameters for thermodynamic models of .
| Regular | Subregular | Associate | |||
|---|---|---|---|---|---|
| i | Al | Al | Al | Tb | Al2Tb |
| j | Tb | Tb | Tb | Al2Tb | Al |
| (J/mol) | −160,000 | −128,000 + 29.001T | −75,252 | −20,342 | −35,455 |
| (J/mol) | - | −80,455 + 30.998T | - | - | - |
| (J/mol) | - | 30,342 | - | - | - |
| (J/mol) | - | - | −113,233 + 18.904T | ||
| Notes | | computed from | |||
© 2017 by the authors. Licensee MDPI, Basel, Switzerland. This article is an open access article distributed under the terms and conditions of the Creative Commons Attribution (CC BY) license (http://creativecommons.org/licenses/by/4.0/).
Share and Cite
MDPI and ACS Style
Zhou, S.; Tackes, C.; Napolitano, R. Enthalpy of Mixing in Al–Tb Liquid. Entropy 2017, 19, 290. https://doi.org/10.3390/e19060290
AMA Style
Zhou S, Tackes C, Napolitano R. Enthalpy of Mixing in Al–Tb Liquid. Entropy. 2017; 19(6):290. https://doi.org/10.3390/e19060290
Chicago/Turabian StyleZhou, Shihuai, Carl Tackes, and Ralph Napolitano. 2017. "Enthalpy of Mixing in Al–Tb Liquid" Entropy 19, no. 6: 290. https://doi.org/10.3390/e19060290
Note that from the first issue of 2016, this journal uses article numbers instead of page numbers. See further details here.