Predicting the Influence of Rain on LIDAR in ADAS


Center for Advanced Vehicular Systems, Mississippi State University, Mississippi State, MS 39762, USA
*
Author to whom correspondence should be addressed.
Electronics 2019, 8(1), 89; https://doi.org/10.3390/electronics8010089
Submission received: 19 December 2018
/
Revised: 9 January 2019
/
Accepted: 10 January 2019
/
Published: 15 January 2019
(This article belongs to the Special Issue Machine Learning and Embedded Computing in Advanced Driver Assistance Systems (ADAS))
Abstract
:While it is well known that rain may influence the performance of automotive LIDAR sensors commonly used in ADAS applications, there is a lack of quantitative analysis of this effect. In particular, there is very little published work on physically-based simulation of the influence of rain on terrestrial LIDAR performance. Additionally, there have been few quantitative studies on how rain-rate influences ADAS performance. In this work, we develop a mathematical model for the performance degradation of LIDAR as a function of rain-rate and incorporate this model into a simulation of an obstacle-detection system to show how it can be used to quantitatively predict the influence of rain on ADAS that use LIDAR.
1. Introduction
Among the many challenges involved in the development of safe, reliable advanced driver assist systems (ADAS), sensing and perception in adverse weather remains one of the most difficult problems. In fact, a recent article in Bloomberg magazine entitled “Self-Driving Cars Can Handle Neither Rain nor Sleet nor Snow” claimed that “The ultimate hurdle to the next phase of driver-less technology might not come from algorithms and artificial intelligence—it might be fog and rain [1]”.
The primary technical challenges associated with automated and autonomous driving in rain come from the influence of rain on the vehicles sensors such as cameras and LIDAR. Although the qualitative impacts of weather on these sensors has been studied for quite some time [2], there has been surprisingly little progress in quantitatively predicting the impact of rain on LIDAR sensors typically used in ADAS systems.
Such a model would be useful in both defining a performance envelope for ADAS systems and in the development of weather-aware ADAS algorithms. Ideally, the model would depend on simple environment parameters such as rain rate and simple sensor parameters such as laser power. While recent measurements and a resulting empirical model of the influence of heavy rain on a Hokuyo UTM-30LX-EW were published by [3], their work measured rain rates of 40.5–95.4 mm/h, whereas naturally occurring rain rarely exceeds 25 mm/h. Therefore, the empirical model is not directly applicable to other sensors at lower rain rates. It is more useful to have a physically-based model that is relevant for a variety of realistic sensors and rain-rates.
More recently, ref. [4] published experimental results quantifying the influence of rain on the reflected intensity of a Velodyne VLP-16 sensor. Even though the empirical results are again not generally applicable to all rain rates and sensors, the results are useful in constraining the analytical model developed in this work.
Perhaps the most detailed work on the influence of rain on LIDAR sensors is [5], which gave quantitative predictions for the LIDAR range reduction as a function of rain rate and compared these to laboratory measurements. However, this model requires a detailed measurement of LIDAR specifications and in fact used a LIDAR sensor which is not currently commercially available. Because it is not often possible to easily acquire detailed internal specifications of a LIDAR sensor, a model is developed in this work that uses a simple parametrization of the LIDAR sensor to make predictions of the reflected intensity and range reduction caused by rain. The model is integrated into a physics-based simulator for autonomous driving and several simulated experiments are performed. An ADAS algorithm for obstacle detection is used to evaluate the performance reduction caused by rain in a realistic test environment.
The following sections will discuss the materials and methods used for the experiments, including a detailed description of the software (Section 2), followed by a presentation of the results of several simulated experiments (Section 3). Finally, the consequences of the results will be discussed (Section 4) followed by a brief conclusion to the paper (Section 5).
2. Materials and Methods
In the context of ADAS, light detection and ranging (LIDAR) refers to a broad category of sensors that use reflected light to measure the geometry of the environment near the vehicle. While operating principles can range from structured light [6] to amplitude modulation [7], the most commonly used type of LIDAR sensors in automotive ADAS are time-of-flight (TOF) systems [8], which calculate distance by accurately measuring the time it takes a reflected signal to return to the sensor. These TOF LIDAR sensors have greater range than other types of LIDAR, which is of critical importance in automotive ADAS. Therefore, in this work the influence of rain on TOF sensors will be modeled.
Operation of LIDAR in rain may have two consequences. First, the intensity of the signal reflected from the target may be reduced due to scattering from rain droplets. Secondly, back-scatter from the rain may result in a false positive detection from a rain droplet. Regarding false-positives, several studies have found that given geometrical considerations [9] and scattering properties of rain [10], false positives are very unlikely for modern automotive LIDAR sensors that are commonly used on ADAS systems. Therefore, in this work a model of the intensity reduction, and corresponding range reduction, caused by rain is developed.
2.1. Lidar Theory
The LIDAR equation for a target at a distance z from the sensor is [11]
where [W] is the power received by the LIDAR sensor, [J] is the laser pulse energy, c [m/s] is the speed of light, is the back-scattering coefficient of the target, is the scattering coefficient of the rain along the path to the target, [m] is the effective receiver area, and and are the transmitter and receiver efficiencies, respectively. This equation can be simplified by considering the rainy atmosphere to be a homogenous uniformly scattering medium such that the integral in the exponent is reduced to a constant. Additionally, neglecting the spatial variation of the hard target and letting the sensor parameters be reduced to a single coefficient , the simplified LIDAR equation is then
Finally, because is a constant for a particular sensor, the relative sensor power is given by
Most LIDAR specification sheets list the maximum range, , of the LIDAR sensor in clear conditions () for a 90% diffusely reflecting surface (). In this case, the minimum detectable relative power is estimated as
Equations (3) and (4) can be used to predict the intensity and range reduction for a TOF automotive LIDAR sensor with only two parameters, the rain scattering coefficient, , and the maximum range of the LIDAR sensor for a 90% reflective target in clear conditions, . The parameter is typically listed in LIDAR sensor specification sheets, but the rain scattering coefficient is not as easily measurable. Therefore, the relationship between rainfall rate and the scattering coefficient is preferable. Lewandowski et al. derive this relationship for optical and near-infrared (NIR) wavelengths (most automotive LIDAR operate at NIR) and find it should follow a power law [12].
where R is the rainfall rate in mm/h, is the extinction coefficient, and a and b are empirical coefficients. While [12] find values for a and b by fitting measurements from an aerial LIDAR sensor, for this work it is more appropriate to use the measurements from terrestrial automotive LIDAR in the work of [4] to estimate the values of a and b. In particular, Filgueira et al. quantified the influence of rain on a VLP-16 sensor by measuring the reduction in reflected intensity as a function of rain rate. The fractional reduction, , can be defined in terms of the relative intensity of the reflection as
where is the reflected intensity in the absence of rain. Substituting the model from Equations (3) and (5), the fractional reduction for a given surface at a distance z can then be modeled as
Comparing this model to the intensity reduction values provided in [4], values of and are found to give the best fit to the reported data. Therefore, the final model for the relative intensity returned by the LIDAR as a function of rainfall rate is.
The work of [4] also showed that in addition to reducing the intensity of the LIDAR return, the presence of rain also introduces noise to the range measurement. Their measurements indicate that there is not a strong dependence on the rain rate, and that almost all the errors are less than 2%. Therefore, range errors are modeled by sampling from a normal distribution () around the true range with a standard deviation of to determine the modified range, .
This noise equation has the property that the noise introduced by rain is zero when the rain rate is zero, and the variance increases to a maximum of 2% of the measured range as rain rate increases.
2.2. Integration into a 3D Simulator
The goal of this work is to provide a predictive tool for evaluating the influence of rain on LIDAR sensors in ADAS. In order to achieve this, the model developed in the previous section is integrated into a 3D autonomous vehicle simulator that includes a detailed physics-based LIDAR simulation. This simulator is known as the Mississippi State University (MSU) Autonomous Vehicle Simulator (MAVS), and previous work has shown that it accurately captures the physics of automotive LIDAR by using ray-tracing in geometrically detailed environments and oversampling the laser beam to capture divergence effects [13].
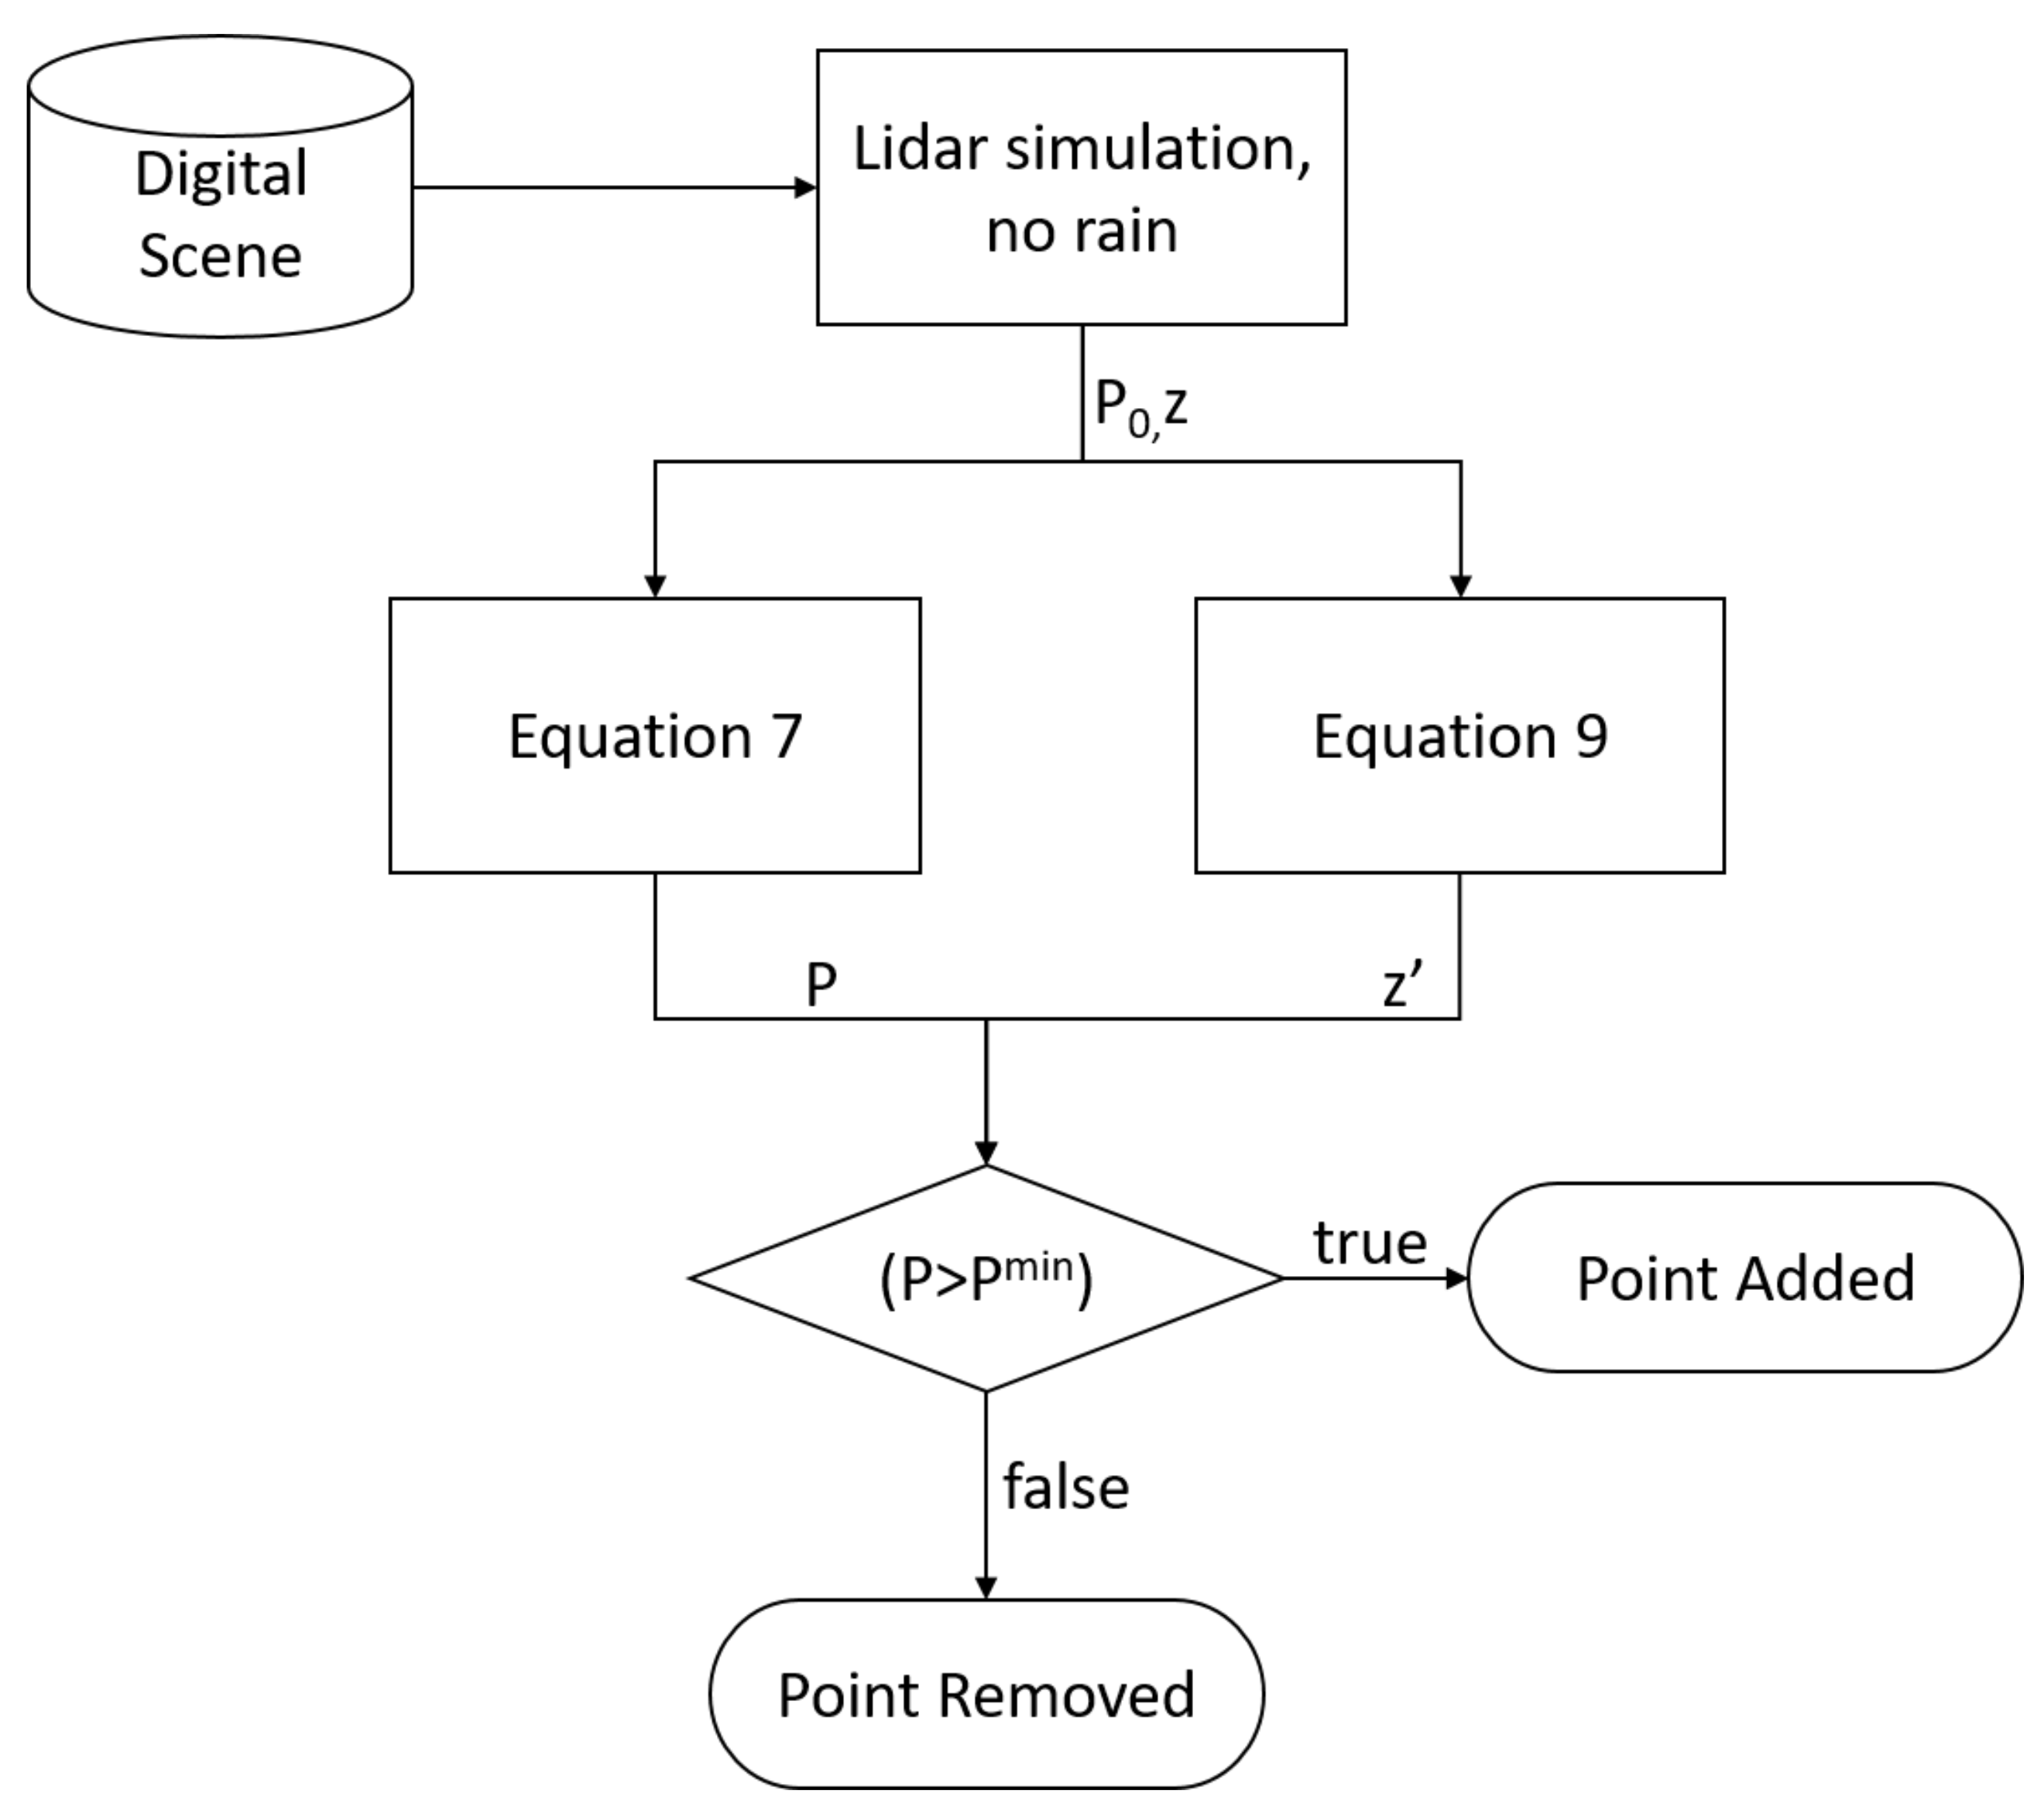
The rain attenuation model was integrated into MAVS using the following procedure (Figure 1):
- The MAVS LIDAR simulation is used to calculate the returned range and intensity in the absence of rain.
- Equation (9) is used to calculate the new range rain-induced with error.
- Equation (7) is used to calculate the reduced intensity value.
- If the reduced intensity falls below the threshold value defined by Equation (4), the point is removed from the point cloud.
The MAVS was used to evaluate the LIDAR-rain interaction model in both simple test scenarios and in more detailed outdoor environments, both of which are discussed in Section 3.
2.3. Maximum Range Experiments
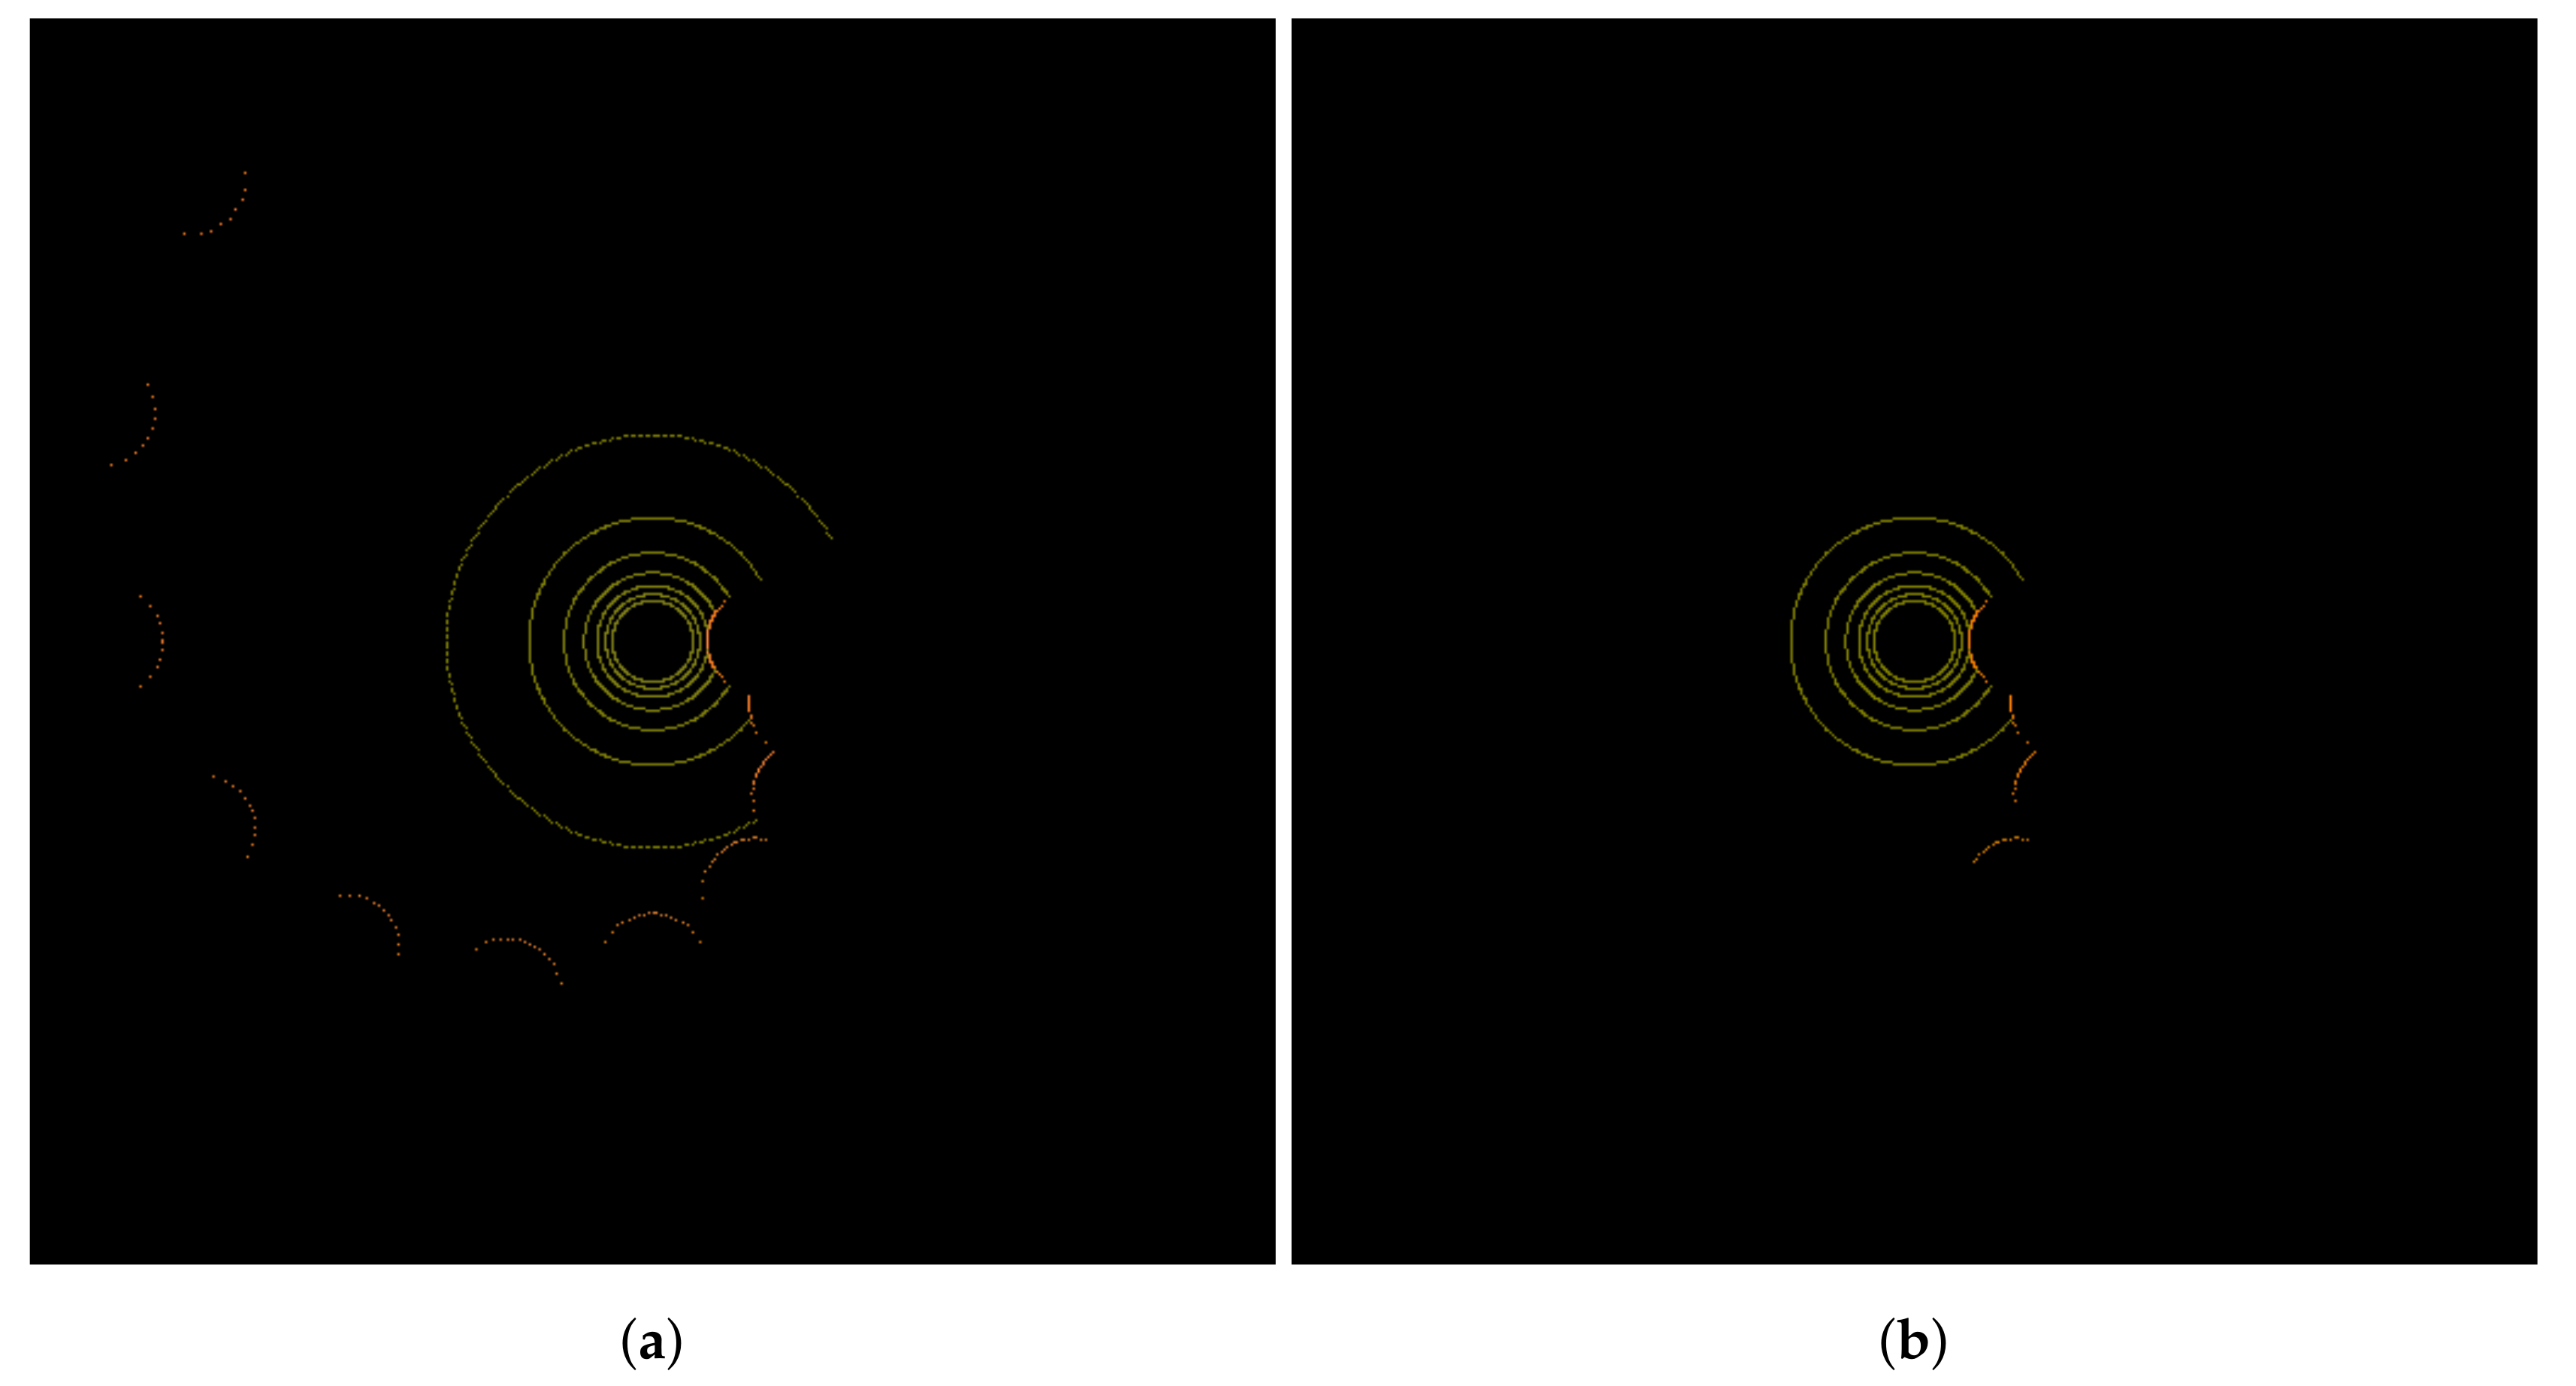
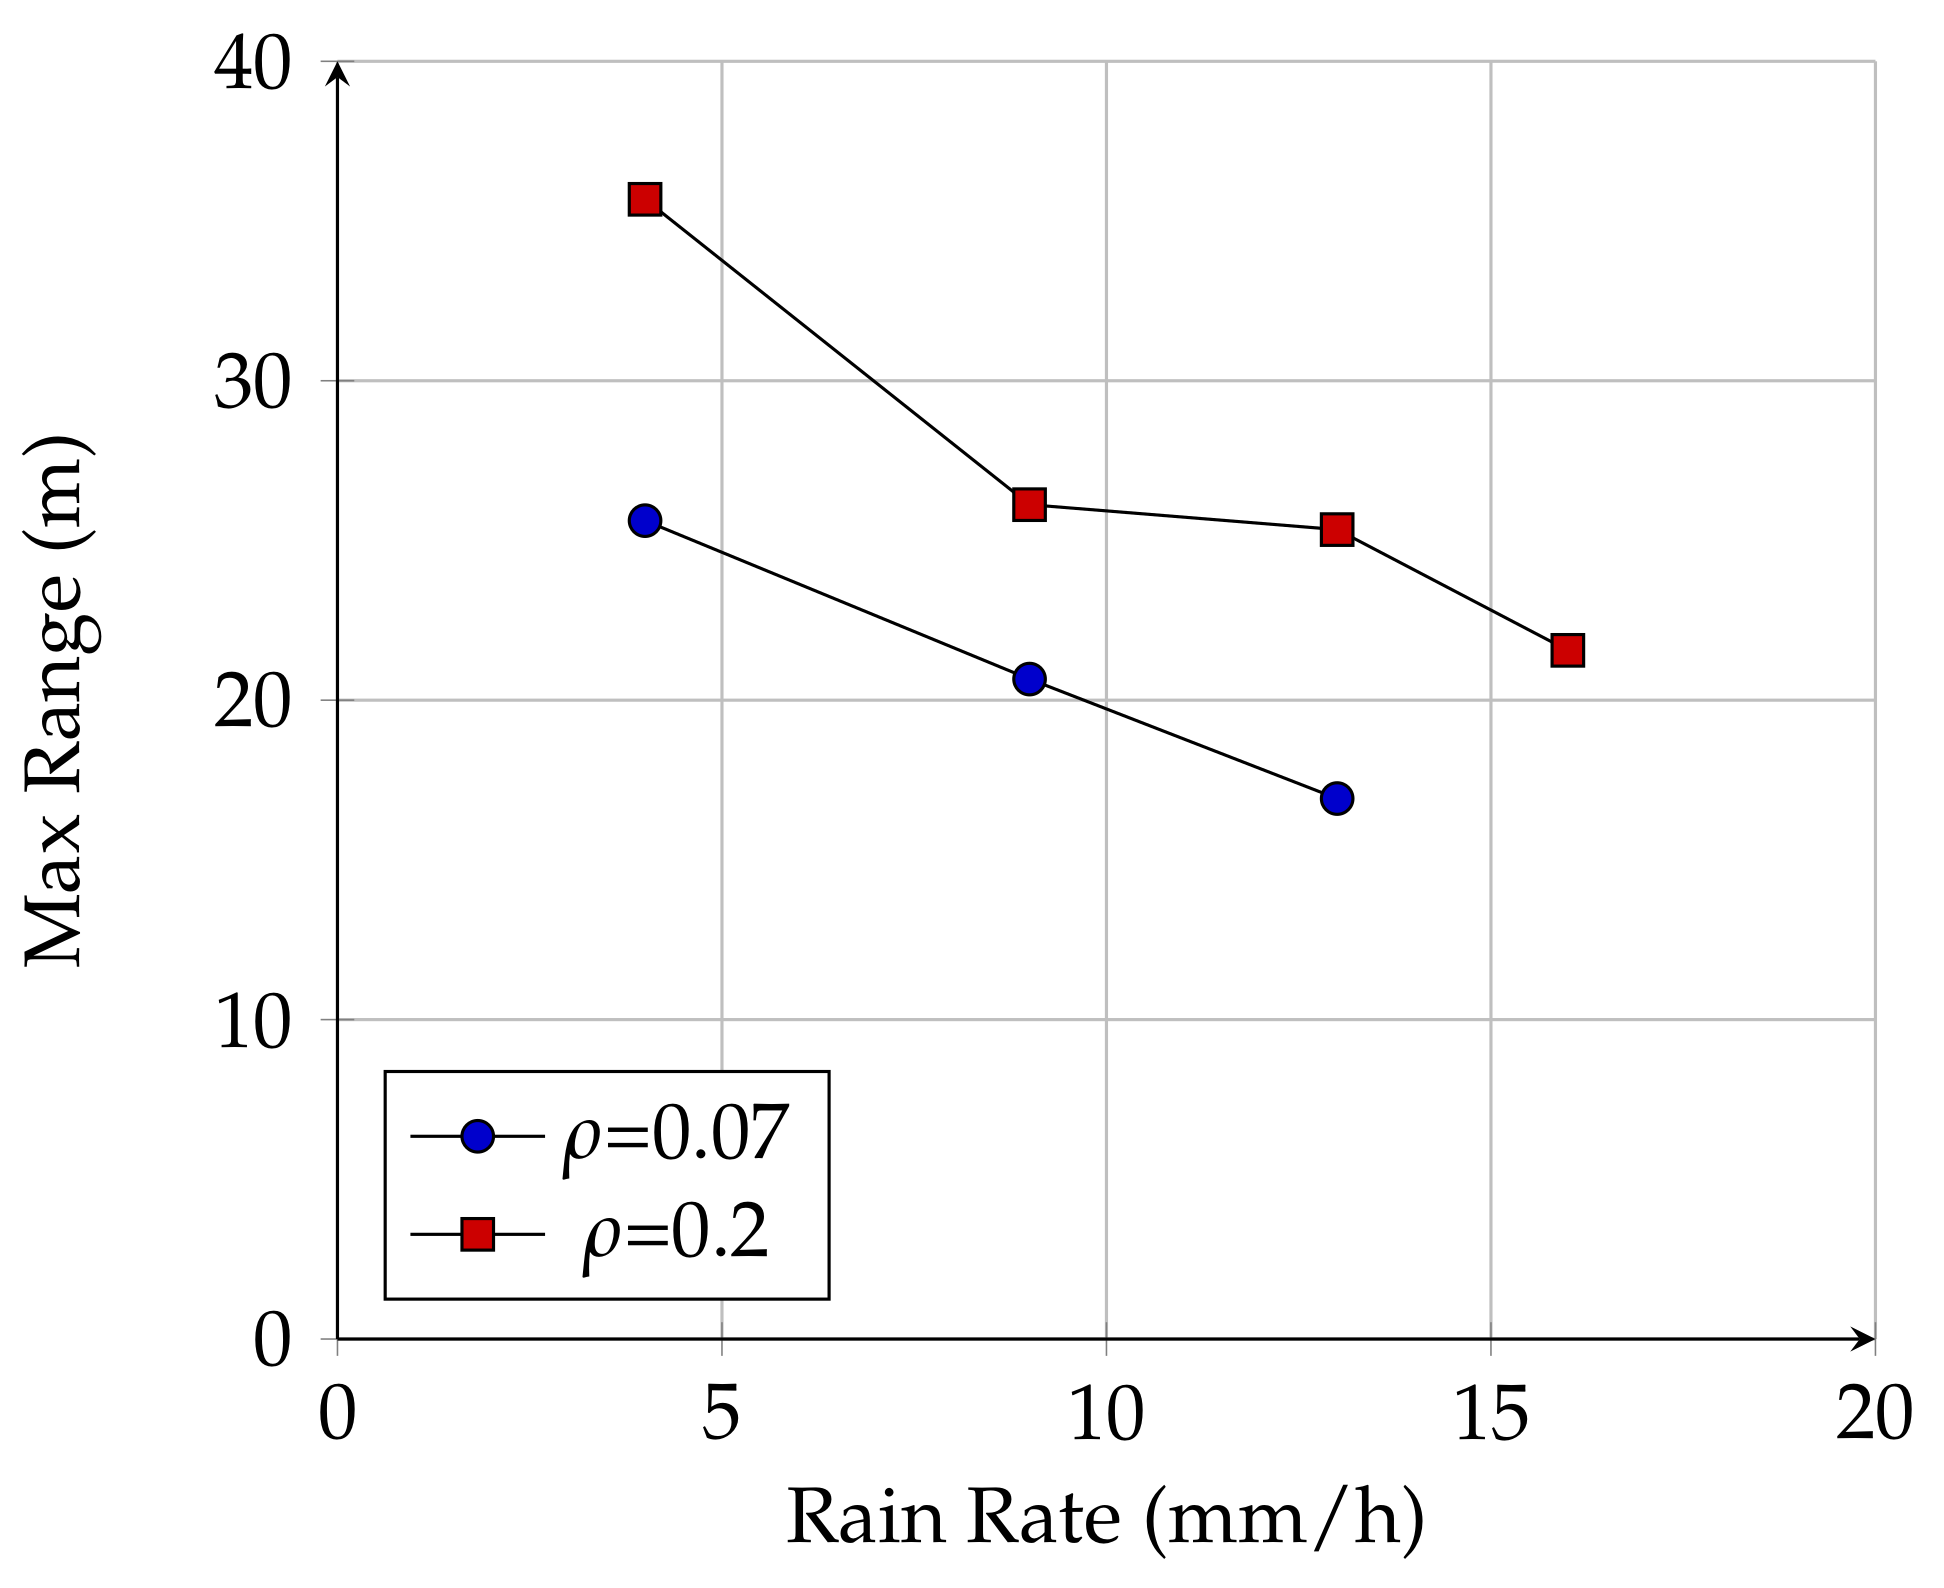
In order to evaluate the validity of the proposed model in a controlled experiment, a simulated test scene was created with large cylinders placed in an arc of increasing radius around the vehicle. This setup provided near-continuous coverage of distance values from 10 m to 80 m, increasing in the clockwise direction around the sensor. In the range experiment, a single scan of a Velodyne VLP-16 [14] sensor was simulated, and the maximum returned range was recorded. The rain rate was increased in the simulation and the experiment was repeated, developing a correlation between rain rate and maximum range for this sensor. The results are presented in Section 3.
2.4. Obstacle Detection in a Realistic Scenario
Simulating the maximum returned range of a LIDAR sensor in a rainy environment provides valuable information, but this information alone is not sufficient to predict the influence of rain on ADAS. Many environmental factors such as the reflectance properties of surfaces in the scene and the geometric complexity of the scene also influence the performance of ADAS, and all of these factors must be considered simultaneously in order to estimate how rain will affect the performance of ADAS for a given environment and safety function.
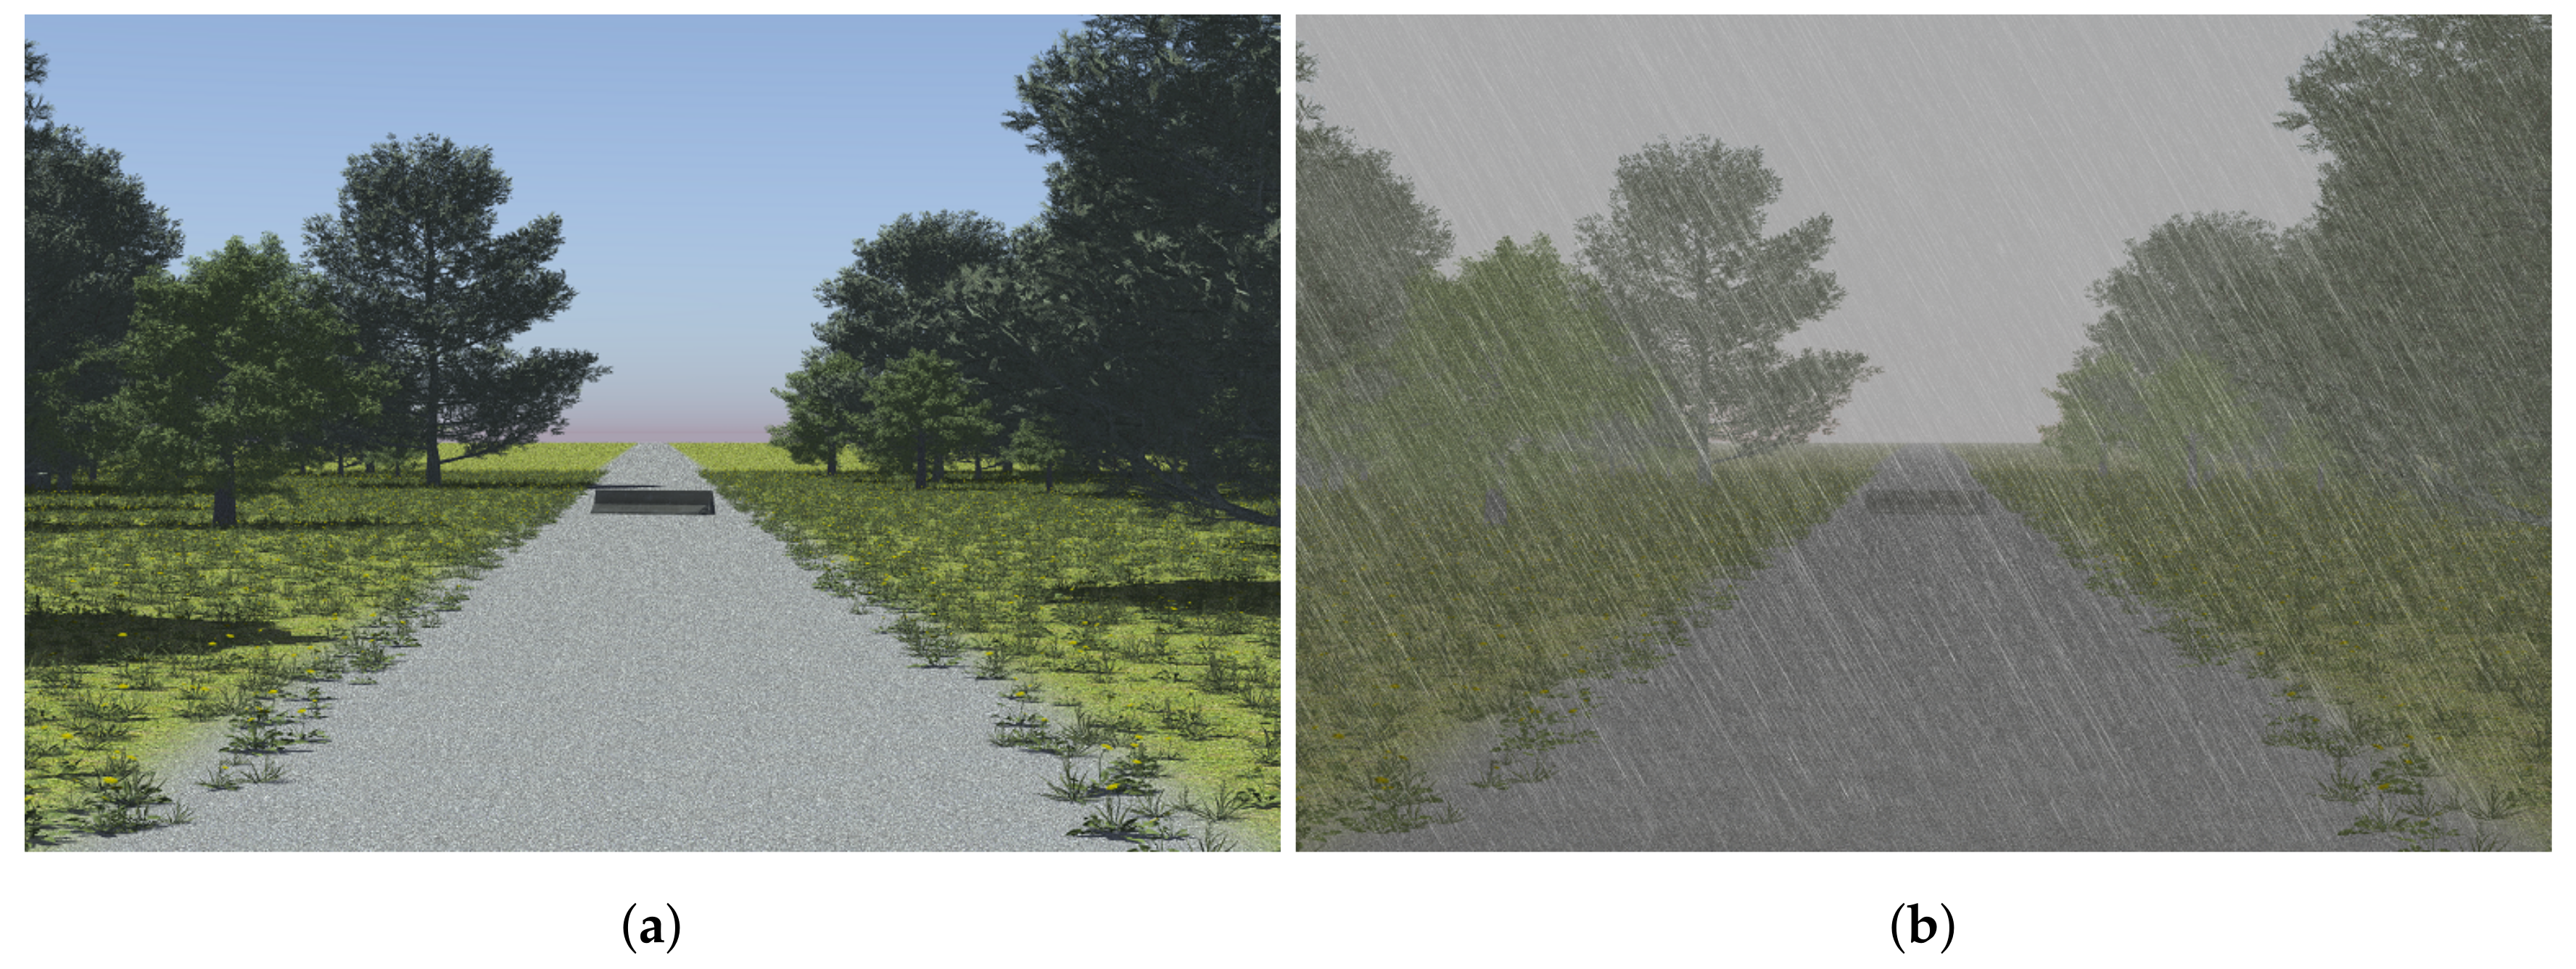
A common safety function of ADAS is to provide obstacle detection and avoidance (ODOA), and LIDAR sensors have proved to be a commonly used sensor in ODOA algorithms [15]. In order to evaluate the influence of rain on LIDAR-based ODOA, a simple scenario was created in which an obstacle was placed on a paved rural road. The obstacle was a concrete barrier about 1 m tall and 2 m wide. The scenario is depicted in Figure 2. Note that the rendering method of the rain in MAVS is similar to the method described in [16].
In this scenario, a vehicle with a top-mounted Velodyne HDL-64E [17] sensor drove toward the obstacle, and a segmentation algorithm was used to calculate the location of all detected obstacles in each scan. The segmentation algorithm was the Euclidean cluster extraction algorithm [18] provided with the Point Cloud Library [19]. In the algorithm, the leaf size was set to 0.1 m, the cluster tolerance was set to 1.0 m, and the minimum cluster size was set to two points. While this parametrization tended to create a high number of small clusters, it also gave the highest likelihood of detecting the obstacle at longer ranges.
The farthest distance in which the obstacle could be detected was recorded, and the experiment was repeated with increasing rain rates. The results of this experiment are shown in Section 3.
3. Results
3.1. Maximum Range Experiments
The results of the maximum range experiments are shown in Figure 3 and Figure 4. Two different target reflectanc valus were measured for several different rain rates in a manner similar to the experiment presented in [5]. Although the Velodyne VLP-16 sensor used in the simulations does not exactly match the specifications of the sensor used in [5], comparison of Figure 4 to Figure 9 from [5] shows very good qualitative agreement, demonstrating that the model derived in the previous section accurately captures the salient aspects of LIDAR performance in rain as a function of rain rate. In particular, the power-law reduction in reflected intensity (and corresponding reduction in range) is accurately predicted by the model, as well as the overall magnitude of the measured range.
3.2. Obstacle Detection in a Realistic Scenario
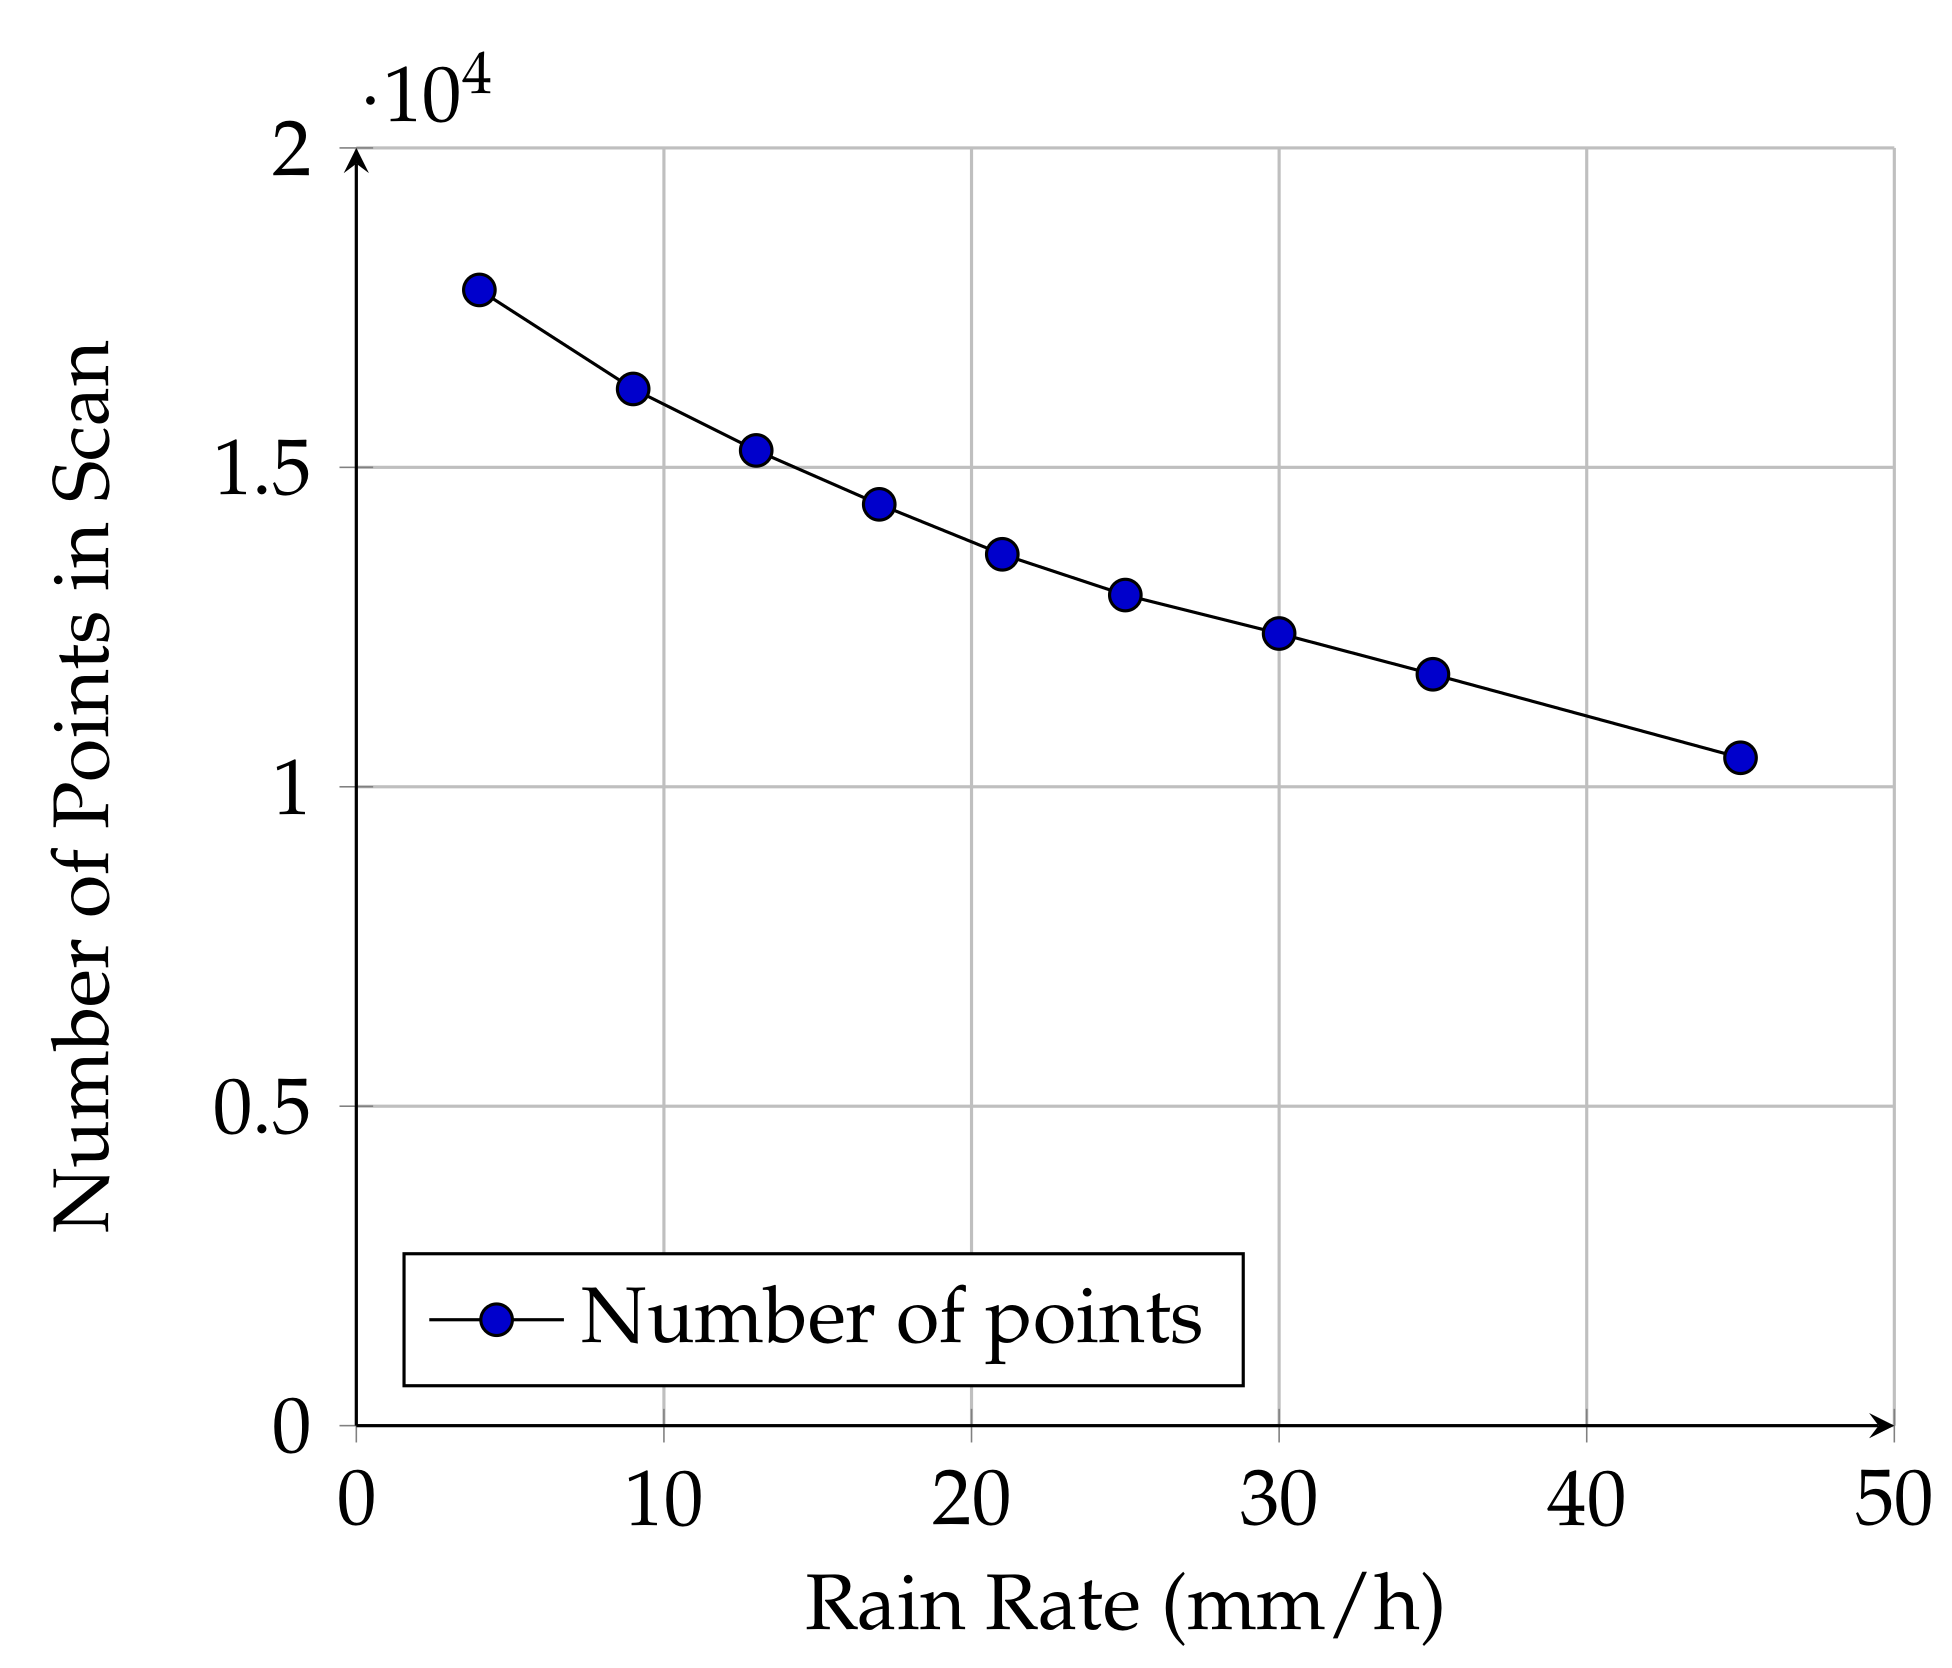
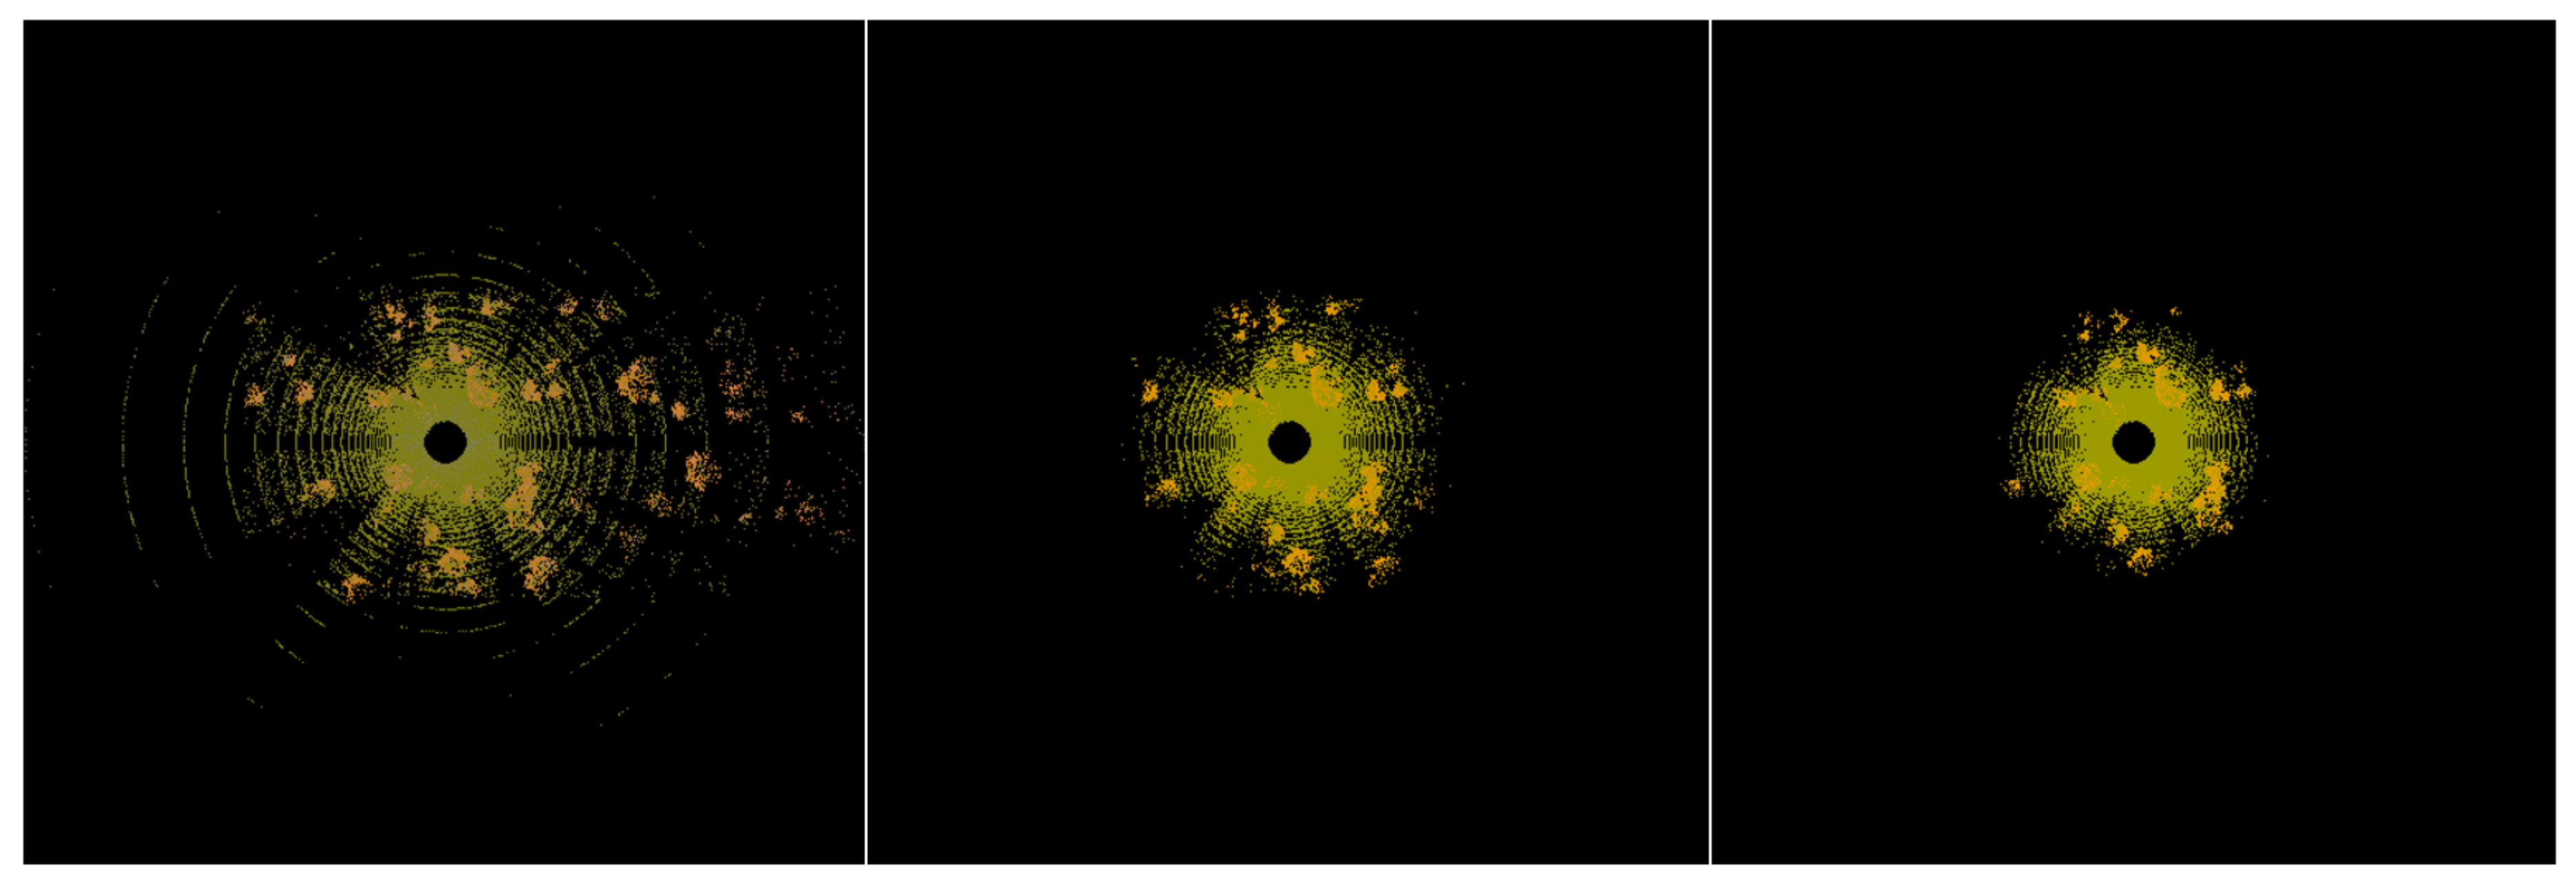
The results of the ODOA scenario are shown in Figure 5, Figure 6 and Figure 7. Figure 5 shows the expected result that the number of points returned for a scan decreases as the rain rate increases, and Figure 7 gives a visualization of how the decreasing range of the LIDAR with increased rain rate results in an overall reduction in the number of points in the scan. Clearly, the resulting point cloud is drastically affected by the increasing rain rate. However, as Figure 6 shows, the LIDAR range reduction does not have as strong of an impact on the detection range for the obstacle.
The capability of the sensor to detect the obstacle is clearly dependent on factors other than the rain. This includes the resolution of the sensor in the horizontal and vertical directions, the ability of the Euclidean cluster extraction algorithm to distinguish the obstacle returns from the ground, and the reflectance properties of the obstacle. It is only when rain rates become quite heavy (21 mm/h) that the range reduction caused by the rain becomes an important limiting factor in the ADAS algorithm.
Figure 6 shows that the ADAS algorithm is only affected after the rain rate reaches 17 mm/h, which is a rather heavy rain that would not frequently be encountered in most environments. Additionally, the variation with rain rate is small, with only a 6-m reduction at a rain rate of 45 mm/h. To put this range reduction in more operational terms, a typical passenger vehicle operating on wet pavement has braking distance, , that varies as the square root of the vehicle speed, [20].
This equation indicates that the maximum safe operating speed on wet pavement is about 14 m/s in clear conditions and about 12 m/s in the heaviest rain (45 mm/h). Therefore, for this simple ADAS algorithm using roof mounted LIDAR, heavy rain does not prove to be a particularly important factor in the system performance.
4. Discussion
The previous sections focused on obstacle detection with LIDAR. However, most ADAS systems use a combination of complimentary sensors including cameras, stereo vision, and automotive RADAR to detect obstacles in the vehicles environment [21]. In particular, many vision systems use convolutional neural networks to detect and classify obstacles and other features of the environment [22]. Nevertheless, because ODOA requires accurate estimation of the obstacle position, some studies have concluded that LIDAR is of primary importance in ODOA algorithms [21,23].
Because the rain model presented in previous sections is applicable to cameras, LIDAR, and RADAR, future studies examining the influence of rain on multi-sensor ADAS algorithms are possible. However, it is also highly desirable to perform single-sensor analyses like the one presented in this work in order to understand the relative error contributions of the different sensor modalities.
5. Conclusions
There are several important conclusions that may be drawn from this work. First, quantitative predictions of LIDAR performance in rain, and the impact of the sensor performance on ADAS, can be made using a simplified version of the LIDAR equation derived in this work. This model uses only the LIDAR maximum range and rain rate as parameters, allowing the user to determine the quantitative relationship between rain rate and ADAS algorithm performance for a given sensor and environment. Most importantly, using simulation allows the rain-rate to be easily controlled in order develop a quantitative relationship between rain-rate and ADAS performance.
Second, although the degradation in LIDAR performance caused by rain is well known, the actual impact to ADAS algorithm performance may not be clear cut, and integrated, closed-loop simulations like the one presented in this work are necessary to determine how rain may or may not limit the ADAS.
Finally, even for multi-sensor systems, analyzing the performance of each sensor in a rainy environment, as well as the performance of the combined sensor package, is necessary to fully understand the influence of rain on the ADAS performance.
Author Contributions
C.G. provided conceptualization, software, and writing; M.D., C.H. and D.C. provided conceptualization, reviewing, and editing.
Funding
Funding for this research was provided by the Center for Advanced Vehicular Systems, Mississippi State University. This research received no external funding.
Conflicts of Interest
The authors declare no conflict of interest.
References
- Stock, K. Self-Driving Cars Can Handle Neither Rain nor Sleet nor Snow. Bloomberg Businessweek, 17 September 2018. [Google Scholar]
- Rasshofer, R.; Gresser, K. Automotive radar and lidar systems for next generation driver assistance functions. Adv. Radio Sci. 2005, 3, 205–209. [Google Scholar] [CrossRef]
- Hasirlioglu, S.; Doric, I.; Lauerer, C.; Brandmeier, T. Modeling and simulation of rain for the test of automotive sensor systems. In Proceedings of the 2016 IEEE Intelligent Vehicles Symposium (IV), Gothenburg, Sweden, 19–22 June 2016; pp. 286–291. [Google Scholar]
- Filgueira, A.; González-Jorge, H.; Lagüela, S.; Díaz-Vilariño, L.; Arias, P. Quantifying the influence of rain in LiDAR performance. Measurement 2017, 95, 143–148. [Google Scholar] [CrossRef]
- Rasshofer, R.H.; Spies, M.; Spies, H. Influences of weather phenomena on automotive laser radar systems. Adv. Radio Sci. 2011, 9, 49–60. [Google Scholar] [CrossRef] [Green Version]
- Fofi, D.; Sliwa, T.; Voisin, Y. A comparative survey on invisible structured light. In Proceedings of the Machine Vision Applications in Industrial Inspection XII; International Society for Optics and Photonics: Bellingham, WA, USA, 2004; Volume 5303, pp. 90–99. [Google Scholar]
- Okubo, Y.; Ye, C.; Borenstein, J. Characterization of the Hokuyo URG-04LX laser rangefinder for mobile robot obstacle negotiation. In Proceedings of the Unmanned Systems Technology XI; International Society for Optics and Photonics: Bellingham, WA, USA, 2009; Volume 7332, p. 733212. [Google Scholar]
- SICK AG. LMS200/211/221/291 Laser Measurement Systems, Technical Description; SICK AG: Reute, Germany, 2006. [Google Scholar]
- Fersch, T.; Buhmann, A.; Koelpin, A.; Weigel, R. The influence of rain on small aperture LiDAR sensors. In Proceedings of the 2016 German Microwave Conference (GeMiC), Bochum, Germany, 14–16 March 2016; pp. 84–87. [Google Scholar]
- Wang, B.; Lin, J.X. Monte Carlo simulation of laser beam scattering by water droplets. In Proceedings of the International Symposium on Photoelectronic Detection and Imaging 2013: Laser Sensing and Imaging and Applications; International Society for Optics and Photonics: Bellingham, WA, USA, 2013; Volume 8905, p. 89052. [Google Scholar]
- Dannheim, C.; Icking, C.; Mäder, M.; Sallis, P. Weather Detection in Vehicles by Means of Camera and LIDAR Systems. In Proceedings of the 2014 Sixth International Conference on Computational Intelligence, Communication Systems and Networks (CICSyN), Tetova, Macedonia, 27–29 May 2014; pp. 186–191. [Google Scholar]
- Lewandowski, P.A.; Eichinger, W.E.; Kruger, A.; Krajewski, W.F. Lidar-based estimation of small-scale rainfall: Empirical evidence. J. Atmos. Ocean. Technol. 2009, 26, 656–664. [Google Scholar] [CrossRef]
- Goodin, C.; Doude, M.; Hudson, C.; Carruth, D. Enabling Off-Road Autonomous Navigation-Simulation of LIDAR in Dense Vegetation. Electronics 2018, 7, 154. [Google Scholar] [CrossRef]
- Velodyne Acoustics, Inc. VLP-16 User’s Manual and Programming Guide; Velodyne Acoustics, Inc.: Morgan Hill, CA, USA, 2016. [Google Scholar]
- Schafer, H.; Hach, A.; Proetzsch, M.; Berns, K. 3D obstacle detection and avoidance in vegetated off-road terrain. In Proceedings of the 2008 IEEE International Conference on Robotics and Automation (ICRA 2008), Pasadena, CA, USA, 19–23 May 2008; pp. 923–928. [Google Scholar]
- Starik, S.; Werman, M. Simulation of rain in videos. In Proceedings of the 2003 Texture Workshop, Nice, France, 17 October 2003; Volume 2, pp. 406–409. [Google Scholar]
- Velodyne Acoustics, Inc. HDL-64E User’s Manual, Rev. D; Velodyne Acoustics, Inc.: Morgan Hill, CA, USA, 2008. [Google Scholar]
- Rusu, R.B. Semantic 3D object maps for everyday manipulation in human living environments. Künstliche Intelligenz 2010, 24, 345–348. [Google Scholar] [CrossRef]
- Rusu, R.B.; Cousins, S. 3D is here: Point cloud library (PCL). In Proceedings of the 2011 IEEE International Conference on Robotics and automation (ICRA), Shanghai, China, 9–13 May 2011; pp. 1–4. [Google Scholar]
- Queensland Government. Stopping Distances on Wet and Dry Roads; Queensland Government: Queensland, Australia, 2016.
- Jiménez, F.; Naranjo, J.E. Improving the obstacle detection and identification algorithms of a laserscanner- based collision avoidance system. Transport. Res. Part C Emerg. Technol. 2011, 19, 658–672. [Google Scholar] [CrossRef]
- Aarthi, R.; Harini, S. A Survey of Deep Convolutional Neural Network Applications in Image Processing. Int. J. Pure Appl. Math. 2018, 118, 185–190. [Google Scholar]
- Ferguson, D.; Darms, M.; Urmson, C.; Kolski, S. Detection, prediction, and avoidance of dynamic obstacles in urban environments. In Proceedings of the 2008 IEEE Intelligent Vehicles Symposium, Eindhoven, The Netherlands, 4–6 June 2008; pp. 1149–1154. [Google Scholar]
Figure 1.
Procedure for modifying LIDAR distances and intensities based on rain rate.

Figure 2.
(a) The ODOA test scenario in clear weather, rendered by MAVS (b) When raining (R = 17 mm/h).
Figure 2.
(a) The ODOA test scenario in clear weather, rendered by MAVS (b) When raining (R = 17 mm/h).

Figure 3.
(a) Top down view of the LIDAR point cloud in the range test in clear conditions (b) When raining (R = 17 mm/h).
Figure 3.
(a) Top down view of the LIDAR point cloud in the range test in clear conditions (b) When raining (R = 17 mm/h).

Figure 4.
Decrease in max range for a simulated LIDAR as a function of rain rate.

Figure 5.
Number of points in a single scan of the LIDAR as a function of rain rate.

Figure 6.
Obstacle detection range as a function of rain rate.

Figure 7.
LIDAR range decrease with increasing rain rate from 0 mm/h on the far left, 9 mm/h in the middle, and 17 mm/h on the right.
Figure 7.
LIDAR range decrease with increasing rain rate from 0 mm/h on the far left, 9 mm/h in the middle, and 17 mm/h on the right.

© 2019 by the authors. Licensee MDPI, Basel, Switzerland. This article is an open access article distributed under the terms and conditions of the Creative Commons Attribution (CC BY) license (http://creativecommons.org/licenses/by/4.0/).
Share and Cite
MDPI and ACS Style
Goodin, C.; Carruth, D.; Doude, M.; Hudson, C. Predicting the Influence of Rain on LIDAR in ADAS. Electronics 2019, 8, 89. https://doi.org/10.3390/electronics8010089
AMA Style
Goodin C, Carruth D, Doude M, Hudson C. Predicting the Influence of Rain on LIDAR in ADAS. Electronics. 2019; 8(1):89. https://doi.org/10.3390/electronics8010089
Chicago/Turabian StyleGoodin, Christopher, Daniel Carruth, Matthew Doude, and Christopher Hudson. 2019. "Predicting the Influence of Rain on LIDAR in ADAS" Electronics 8, no. 1: 89. https://doi.org/10.3390/electronics8010089
Note that from the first issue of 2016, this journal uses article numbers instead of page numbers. See further details here.