Time–Scale Relationship between Securitized Real Estate and Local Stock Markets: Some Wavelet Evidence


1
Department of Real Estate, National University of Singapore, 4 Architecture Drive, Singapore 117566, Singapore
2
School of Finance, Shanghai University of Finance and Economics, 100 Wudong Road, Shanghai 200433, China
*
Author to whom correspondence should be addressed.
J. Risk Financial Manag. 2019, 12(1), 16; https://doi.org/10.3390/jrfm12010016
Submission received: 10 December 2018
/
Revised: 6 January 2019
/
Accepted: 15 January 2019
/
Published: 20 January 2019
(This article belongs to the Special Issue Risk Analysis and Portfolio Modelling)
Abstract
:This study revisits the relationship between securitized real estate and local stock markets by focusing on their time-scale co-movement and contagion dynamics across five developed countries. Since securitized real estate market is an important capital component of the domestic stock market in the respective economies, it is linked to the stock market. Earlier research does not have satisfactory results, because traditional methods average different relationships over various time and frequency domains between securitized real estate and local stock markets. According to our novel wavelet analysis, the relationship between the two asset markets is time–frequency varying. The average long run real estate–stock correlation fails to outweigh the average short run correlation, indicating the real estate markets examined may have become increasingly less sensitive to the domestic stock markets in the long-run in recent years. Moreover, securitized real estate markets appear to lead stock markets in the short run, whereas stock markets tend to lead securitized real estate markets in the long run, and to a lesser degree medium-term. Finally, we find incomplete real estate and local stock market integration among the five developed economies, given only weaker long-run integration beyond crisis periods.
1. Introduction
Securitized real estate (real estate stocks and real estate investment trusts) is a major capital asset component of the domestic stock market in many economies. Due to its dual nature, the value of securitized real estate is a function of the market value of its property holdings and stock market valuation (Morawski et al. 2008). According to Markowitz’s (1952) portfolio theory, if the two asset markets are closely linked, then the differential risk premium will eventually disappear to the extent to which there will not be any potential for cross-asset and cross-border diversification for global investors and country funds. Moreover, higher interdependences between securitized real estate and stock markets may imply more or faster transmission of a crisis, indicating that there is less opportunity for spreading risk, at least across the major developed securitized real estate and stock markets, than it was the case in the previous decades (Liow and Schindler 2011). Consequently, the question of how closely securitized real estate is linked to stock is thus of great concern to portfolio investors and financial institutions who invest in both asset markets.
Although traditional research has generally reported a reasonably close link between the two asset markets, one major shortcoming is that such knowledge ignores the possibility that the direction and strength of the real estate–stock link may vary over different frequencies. Recognizing financial markets have many time scales (Loh 2013), the relationships between real estate and stock markets are probably time-scale dependent to the extent that heterogeneity in investment horizon will affect the cross real estate and stock links differently in the short-run, medium-term, and long-run (Zhou 2010). This can happen due to the presence of different types of behaviorally motivated market players such as short-term speculative traders and long-term strategic portfolio investors operating in various real estate and stock markets. Moreover, the existing literature employs one or more of traditional time series methods (such as correlation coefficient, co-integration analysis, and GARCH-related models) to measure the level of dynamic real estate-stock return correlations. Thus, there is room for an alternative approach to provide novel and informative evidence or give fresh insights on the complex interactions between securitized real estate and local stock markets.
Despite much academic effort regarding the time–frequency relationships across stock markets using continuous wavelet transform (CWT) (e.g., Aguiar-Conraria et al. 2008; Loh 2013; Dima et al. 2015; and Tiwari et al. 2016) and maximal overlap discrete wavelet transform (MODWT) (e.g., Ranta 2013; Deora and Nguyen 2013; and Dewandaru et al. 2016) since the last decade, previous time-scale studies on real estate markets, as well as between real estate and stock markets, are lacking, with the exceptions of Zhou (2010, 2012), Li et al. (2015), and Liow et al. (2018a, 2018b). This knowledge gap will be filled by the present study. Our study can be clearly distinguished from the previous studies in focusing on the twin aspects of market “interdependence”, and “contagion”, and offering a comprehensive exploration of the time-scale real estate-stock connection in an international environment.
Assembling a sample of five major developed securitized real estate markets and their corresponding domestic stock markets, this paper revisits the relationship between the two asset markets by focusing on the time–scale co-movement and contagion dynamics across the five countries. The study provides novel and informative contribution by appealing to wavelet analysis to decompose time series into various time–frequency domains. Wavelets are mathematical functions that divide data into different frequency components and then study each component with a resolution appropriate for its overall scale (Ramsey 2002). Wavelet methodology is a refinement of Fourier analysis (spectral analysis). Subsequently, it was followed by the development of multiresolution analysis by Mallat (1989) and the introduction of orthogonal wavelet bases by Daubechies (1992). In addition to revisiting the average relationship between the two asset markets, we examine the nature and pattern of co-movement of five Western developed countries’ real estate-local stock markets at different time scales/investment horizons. We also compare the differences in the time-scale co-movement between the US and European markets during the global financial crisis (GFC) and European debt crisis (EDC). In so doing, this paper adds itself to an understanding of the varying time–frequency relationship between securitized real estate and stock markets, an issue which has been insufficiently addressed in previous empirical studies.
On the first issue examining real estate-stock co-movement, one key message delivered to investors from the previous studies is that increased co-movement between real estate and stock markets may diminish the advantage of internationally diversified asset portfolios. Some of these time-series real estate studies include C. H. Liu et al. (1990); Ambrose et al. (1992); Eichholtz (1996); Okunev and Wilson (1997); Ling and Naranjo (1999); Quan and Titman (1999); Okunev et al. (2000); Ling and Naranjo (2002); Bond et al. (2003); Michayluk et al. (2006); Schindler (2011); Liow (2012); Yunus et al. (2012); and Hoesli and Oikarinen (2012).
On the second issue relating to financial contagion, since any increase in the real estate and stock co-movement from the pre-crisis period to the crisis period may take the form of interdependence or contagion, there is the suspicion that the observed co-movement between securitized real estate and local stock markets is caused by contagion in the context of globalization. Whilst some researchers such as Rua and Nunes (2009) and Ranta (2013) presume that contagion is a temporary increase of short time-scale co-movement (or “pure” contagion, Dornbusch et al. (2000)), we also consider whether the detected real estate-stock co-movement is also affected by “fundamentals-based” contagion (Kaminsky and Reinhart 2000). “Pure” contagion describes a situation where an excessive transmission of shocks due to a crisis is beyond any idiosyncratic disturbances and fundamental linkages, and is relatively fast and disappears in a short period. Using wavelets, if short time-scale co-movement increases while long time-scale co-movement remains relatively stable, then such real estate-stock link is a function of “pure” contagion. In contrast, “fundamentals-based” contagion refers to a situation which involves a transmission of shocks, due to financial market and real linkages in crisis and non-crisis periods, and reflects market interdependence across countries. Given this basic contagion framework, we examine if the real estate-stock co-movement increases after the GFC and EDC crisis episodes over the three investment horizons specified. Prior time-series real estate studies include Hui and Chan (2013); Hoesli and Reka (2015) and Hui and Chan (2016).
2. Research Methods
We adopt a holistic perspective by taking on a three-step empirical strategies. To save space, we only provided below an intuitive sketch of the wavelet approach and the three methods applied.1
2.1. The Essence of Wavelet Analysis
Wavelet analysis transforms time series into different frequency components with a resolution matched to its scale. There are two ways of wavelet decomposition, one is known as the CWT which is designed to work with time series over the entire axis (Grinsted et al. 2004); another one is the DWT which deals with time series with finite range. Additionally, the MODWT is a subsampling of the CWT at dyadic scales, but the number of coefficients can be the same length with the original time series. Both the DWT and MODWT draw on multiresolution analysis (MRA) to decompose a time series into lower and lower levels of resolution. This level of multiresolution decomposition is referred as scales in wavelet studies. Following literature, the interpretation of lower/higher resolution in this study using daily frequency returns is: scale d1 (2–4 days), scale d2 (4–8 days), scale d3 (8–16 days), scale d4 (16–32 days), scale d5 (32–64 days), scale sd6 (64–128 days) and scale d7 (128–256 days), using the Daubechies’ (1992) least asymmetric wavelet filter, LA (8).
2.2. Wavelet-Based Modelling
One major contribution of this study lies in combining wavelet analysis and the coherence/phase difference analysis, static and rolling percentage of total volume analysis (PTV), rolling wavelet correlation contagion analysis, and multi-resolution asymmetric dynamic conditional correlation analysis (ADCC-GARCH). They are briefly presented below:
(a) Wavelet Coherence and Phase Difference Analysis
Wavelet coherency allows for a three-dimensional analysis, which simultaneously considers the time and frequency elements, as well as the strength of correlation between the time series (Loh 2013). The coherence captures the correlation coefficients around each moment in time and for each frequency. Using the wavelet coherence plot, the x-axis and y-axis represent time and frequency respectively. From there, we observe how the real estate-stock correlations vary over frequencies and time intervals. Additionally, phases are indicated by arrows, which indicate the nature of lead–lag linkages. All computations will be done using MATLAB.
The wavelet coherence is defined by Torrence and Webster (1999) as the squared absolute value of the smoothed cross-wavelet spectra divided by the product of the smoothed individual wavelet power spectra of the two selected time series. This wavelet coherence coefficient is in the range between 0 and 1. As a measure of studying market co-movement, values that are close to zero indicate low correlations; in contrast, values that are close to one indicate the presence of strong correlations. This concept is very useful for determining the regions in the time–frequency domain where the time series share significant co-movements. Finally, we employ the static and rolling percentage of total volume (PTV) of the wavelet coherence to complement the graphic observations derived from the coherence plots.
(b) Rolling Wavelet Correlations
Inspecting the rolling correlations between real estate-stock market returns can observe whether there is a rising trend of correlation across the scales. In this study, we will implement a wavelet based real estate-stock rolling correlation analysis on a scale-by-scale basis, using windows of 125 days (half a year of trading), rolled forward one day at a time, resulting in a time series of wavelet correlation, and are decomposed by the MODWT with a Haar filter.2
Moreover, a t-test was performed to compare the level of rolling correlation before and after the GFC and EDC. Following Ranta (2013), we conclude there is evidence of ‘pure” contagion if short time-scale co-movements increase, while the long time-scale co-movements remain about the same. In addition, we address whether the real estate-stock co-movement is affected by the “fundamentals-based” contagion after the crisis episodes following the theoretical contagion framework outlined above.
By applying the transformation, the adjusted correlation coefficient (z) is:
The t-test statistic is:
Thus, with the time windows used before and after the two crises that have 250, 125, and 500 days respectively, we can compare the equality of coefficients, and test whether the contagion is statistically significant across the real estate and stock markets. Since any “pure” contagion is usually confined to shorter time scales and investment horizons, we use the first four scales (d1, d2, d3, and d4). We also assess the “fundamentals-based contagion” using another three longer time scales (d5, d6, and d7).
(c) Further Analysis: Multi-Resolution Analysis (MRA)-Conditional Correlation Analysis
We combine MRA with a bivariate AR (1)-ADCC-GARCH model of Engle (2002) and Cappiello et al. (2006). Evidence from this analysis will provide support on the varying time scale real estate-stock correlation behavior, and whether the average conditional real estate-stock correlation will increase or decrease when the level of decomposition increases. We expect that since different groups of investors can operate on their time horizons, the real estate-local stock market correlation in an international setting may differ across time scales.
The conditional ADCC-GARCH model is adopted because it keeps the simple interpretation of the univariate GARCH models, as well as providing a consistent estimate of the dynamic correlation matrix. Moreover, the model considers the leverage effects of return volatility. Its estimation comprises three steps, as detailed in the literature.3 Using the model, we will evaluate and validate the strength of the real estate-stock market co-movement in the short-run (scales d1 + d2: 2–eight days, one week approx.), medium-term (scales d3 + d4: 8–32 days, one-month approx.) and long-run (scales d5 + d6 + d7, 32–256 days, one year approx.).
Related empirical studies are very limited. Deora and Nguyen (2013) finds from their wavelet-based DCC-GARCH model that the conditional correlations between the Indian and world equity markets vary considerably across time scales. Some other studies such as Lee (2004); Huang (2011) and Khalfaoui et al. (2015) focus on the time-scale mean and volatility spillovers rather than conditional correlations.
3. Sample and Data
A sample of five major developed securitized real estate markets, and their corresponding domestic stock markets are included in this study. Of them, the four major European markets are the UK, France, Germany, and Netherlands, as well as the US (from North America). These five securitized real estate markets represent over 70% of global real estate market capitalization, and they have a combination of listed REITs and real estate stocks in their respective stock markets, with the percentage of REITs in the index being 100% (France), 100% (Netherlands), 99% (US), 84% (UK), and 5% (Germany). Among them, the US has the world’s largest real estate market, which is also the most transparent securitized real estate market, and it is largely dominated by REITs. The listed real estate companies have a long history in Europe, with the UK being the largest European securitized real estate market. While Germany has a long history of indirect real estate vehicles such as open-ended funds, closed-ended funds, and listed real estate companies, Netherlands has an established and relatively large securitized real estate market that accounts for above 10% of the European developed securitized real estate market.4
The daily FTSE/EPRA public real estate price indexes and the FTSE stock market price indexes of the five countries, both in local dollars, are sourced from the Datastream, and the sample period runs from 3 January 2000 until 29 April 2016. Daily returns are calculated as the difference in the natural logarithm of the price indexes. After excluding public holidays and adjusting for trading hour synchronization, we had 4204 daily compounded returns. Table 1 provides the usual descriptive statistics for the daily returns of the five countries (10 series) over the full study period. One main observation is that all return series are rejected for normality, as indicated by the respective significant Jarque–Bara tests at least at the five percent level.
4. Empirical Results
4.1. Time-Scale Decomposed Returns
Although the maximum wavelet decomposition level is , (T is number of data), we choose seven scales, only because the feasible wavelet coefficients become smaller with higher levels of decomposition. Table 2 provides the mean and standard deviation of the time scale decomposed returns using the MODWT method with the LA (8) filter. One key observation is that the estimated wavelet standard deviation for all return series decreases when the scale increases.
A wavelet variance decomposition analysis (Table 3) illustrates that most of the volatility in the return series is captured by lower levels of MODWT wavelet coefficients. The MODWT coefficients at scale 1 (the highest frequency) represent the highest level of energy. The level 1 MODWT wavelet coefficients, indicating short-term fluctuations occurring due to shock occurring up to four days, capture between 20.74% and 50.74% (stock), as well as between 18.31% and 47.49% (real estate) of the total energy of the market returns. Additionally, the first four scales (up to the monthly horizon) represent between 90.02% and 93.99% (real estate), as well as between 91.89% and 95.68% (stock) of the variances of the decomposed returns.
4.2. CWT: Wavelet Power Spectrum, Cross Wavelet Power Spectrum, and Wavelet Coherency
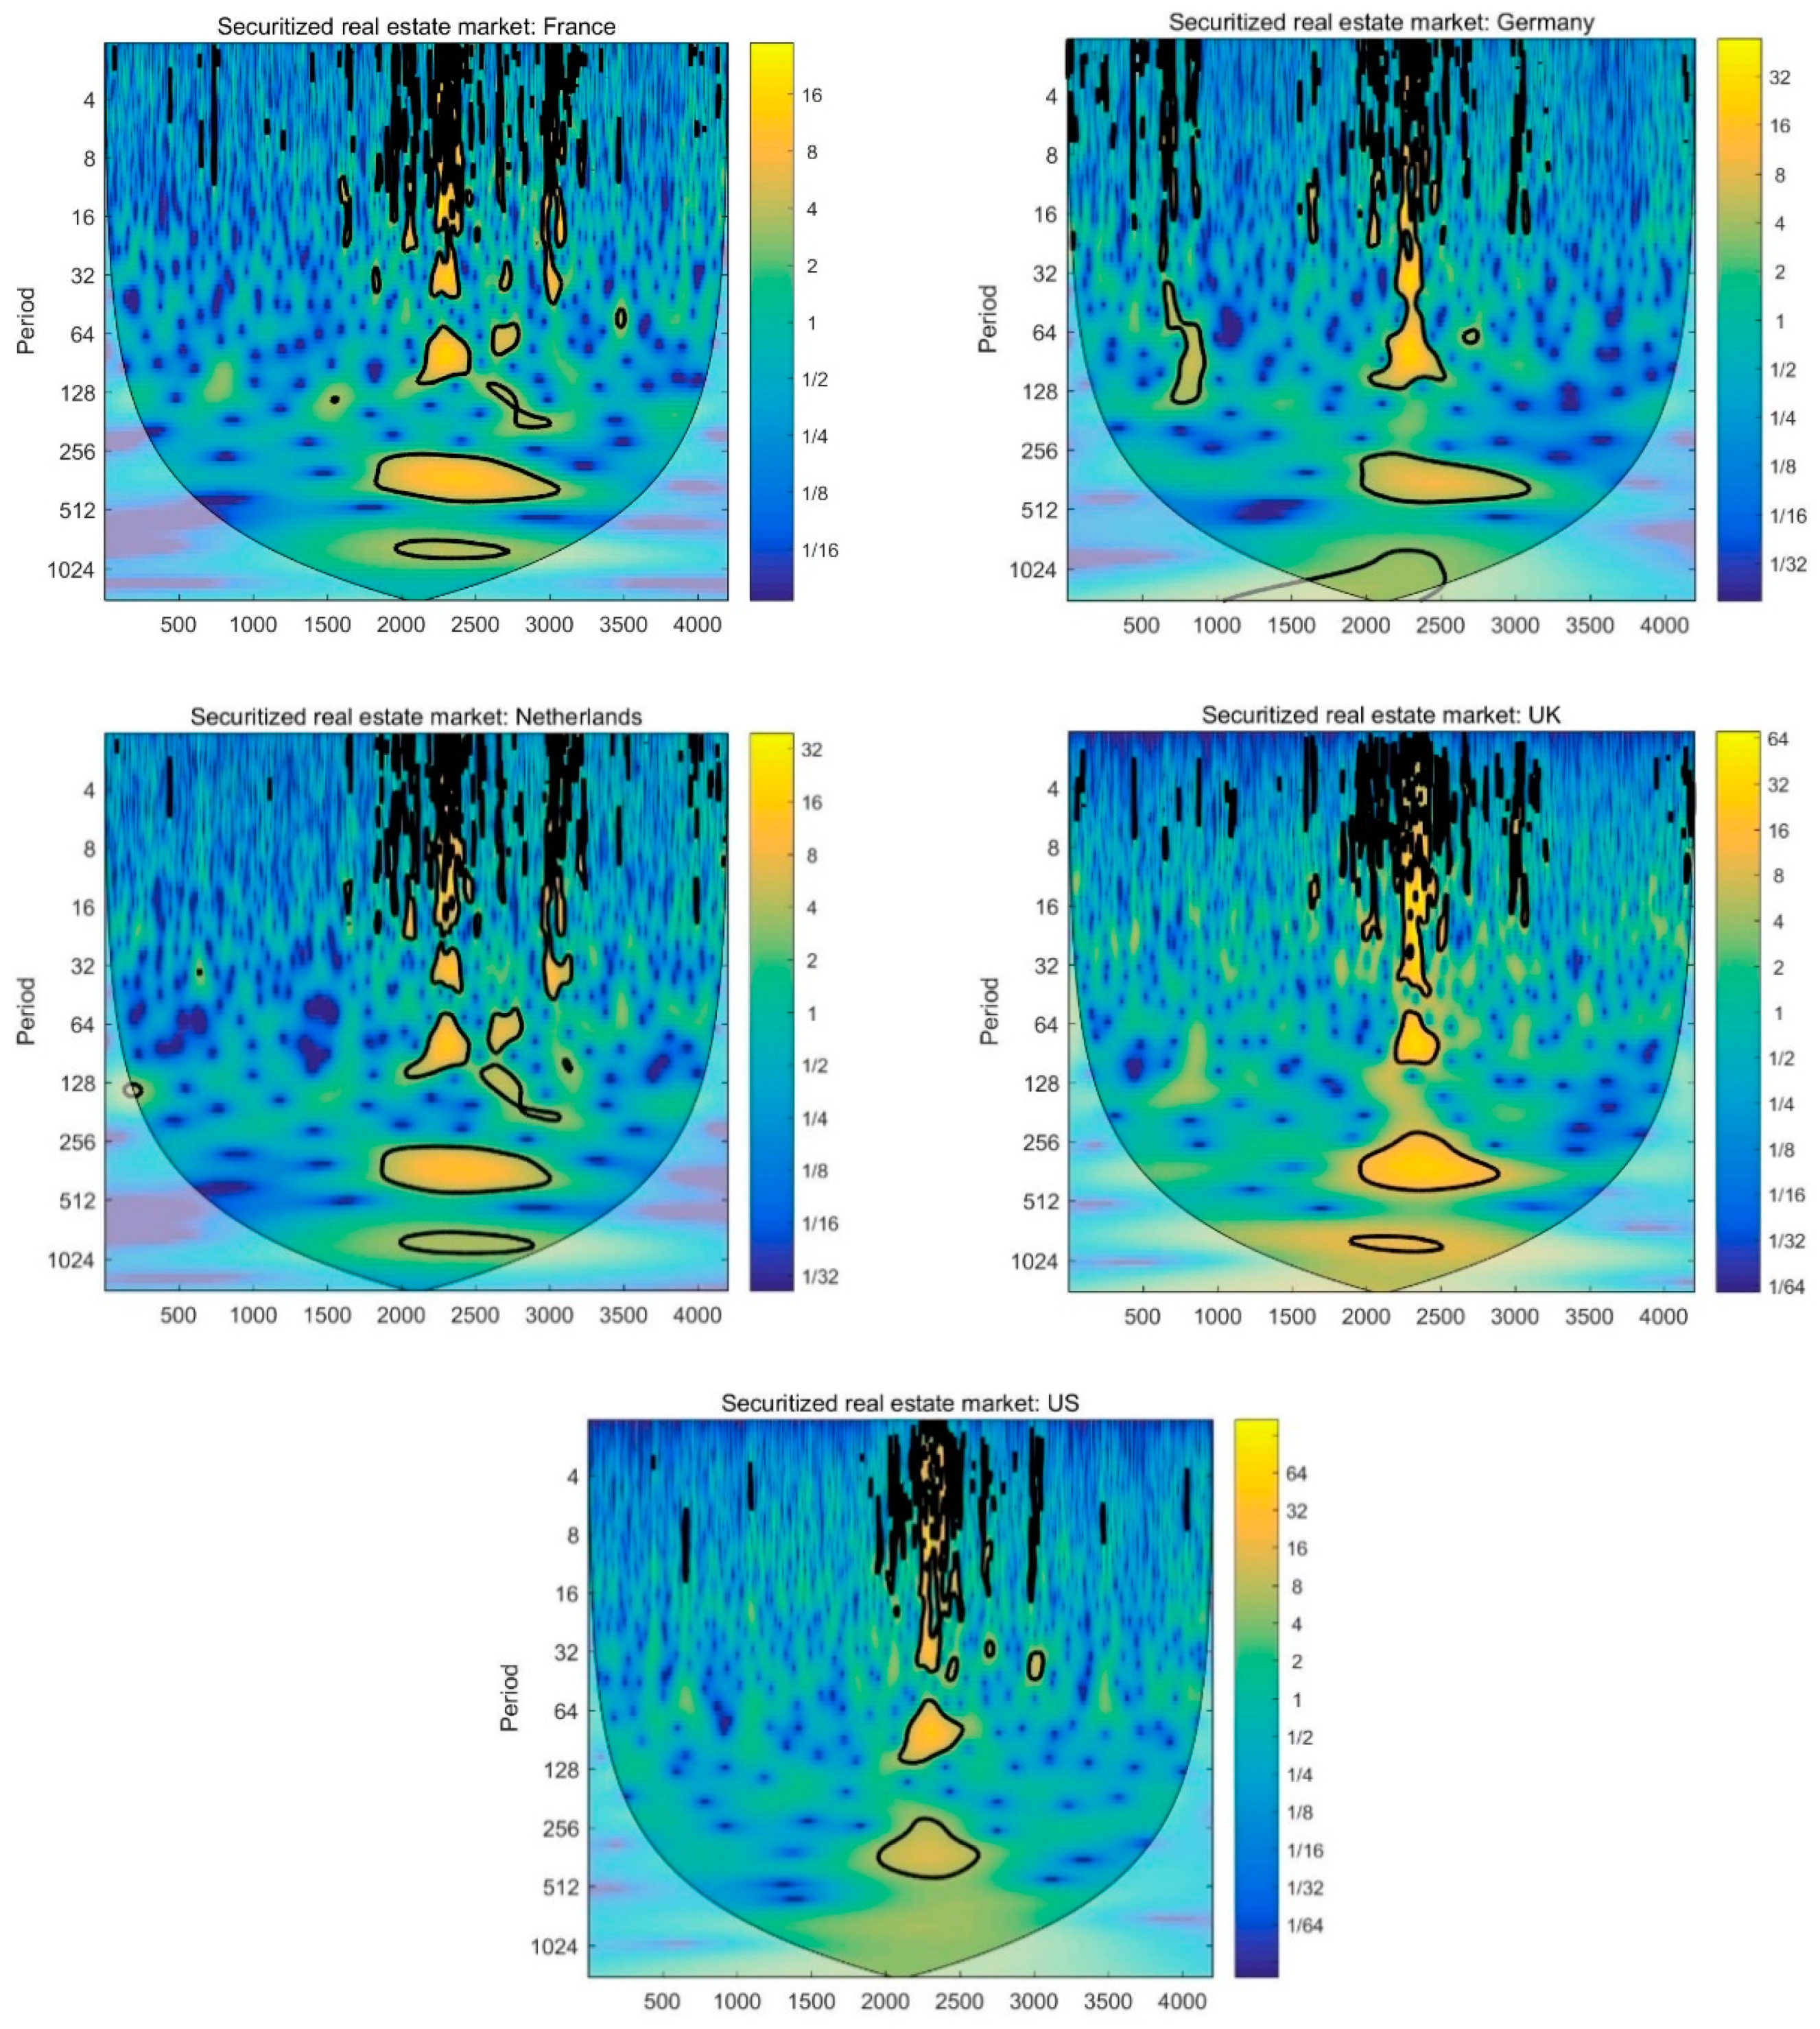
Figure 1 displays the continuous wavelet power spectrum for the five real estate market indexes.5 In these plots, the dark black contour line in regions with energy indicates the 5% significant level estimated from Monte Carlo simulations. The areas outside the cone of influence (the thin black line) are heavily affected by the edge effects. One key observation is that the volatilities of the real estate markets decline as the wavelet scale rises. Moreover, all of the real estate market volatilities are relatively high and are statistically significant regardless of the time scales. During 2006–2010, much stronger volatility effects are evident at the medium-term and long-run investment horizons, implying that capital markets todays face higher longer run shocks.
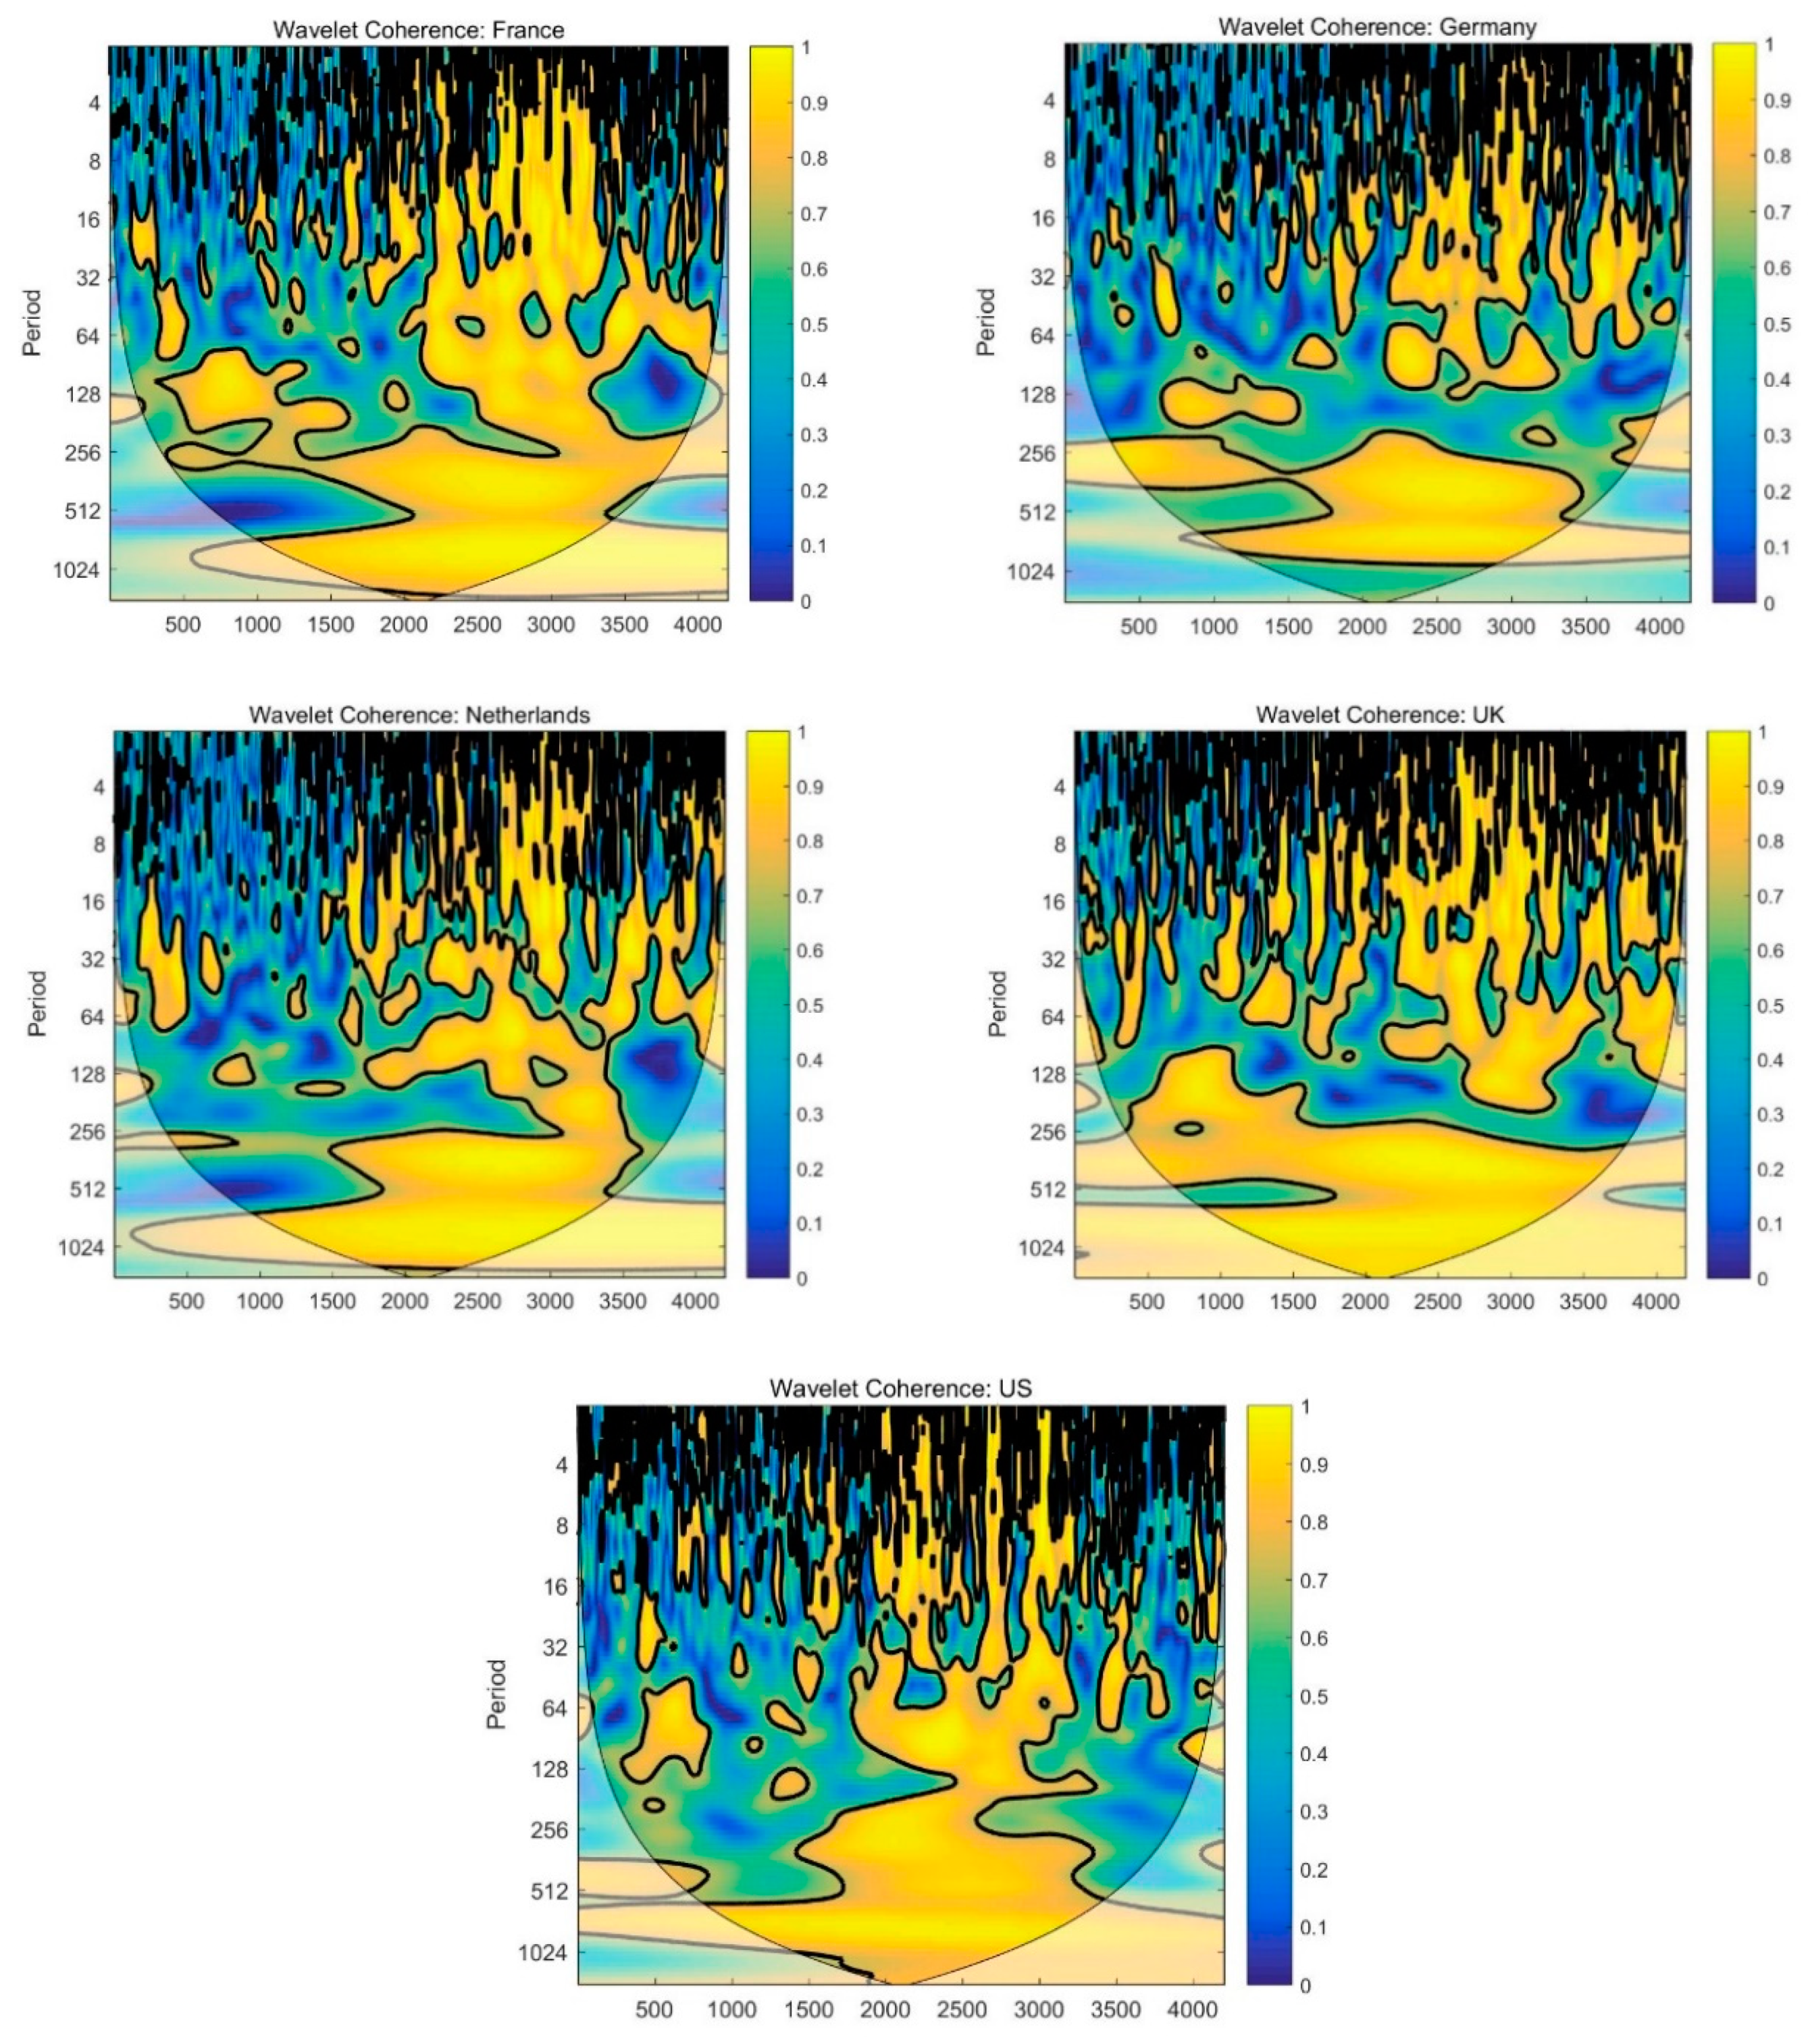
The wavelet coherency is displayed through five contour graphs (Figure 2). In the context of wavelets, the coherence captures the correlation coefficients around each moment in time, and for each frequency. Through this graph we can detect the regions in a time–frequency space where the real estate and stock markets co-vary and capture both time and frequency-varying features. In each plot shown in Figure 2, the horizontal axis represents the time-period during the sample years 2000–2016, whereas the vertical axis refers to the time scales. The thick dark curved line indicates the 5% significance level, such that the region outside the boundary is considered statistically insignificant at the 95% confidence level. The color code for power ranges from blue (low coherency, near zero) to yellow (high coherency, near one). Finally, the arrows pointing to the right mean that the returns are in phase (positively correlated). Moreover, the first series is “lagging” when the arrow are pointing up; whereas the first series is leading when the arrows are pointing down. On the other hand, the two series are out of phase if the arrows are moving to the left. Also to the left and up means that the two series are negatively correlated and the first series is lagging; the first series is leading when the arrow is pointing down.
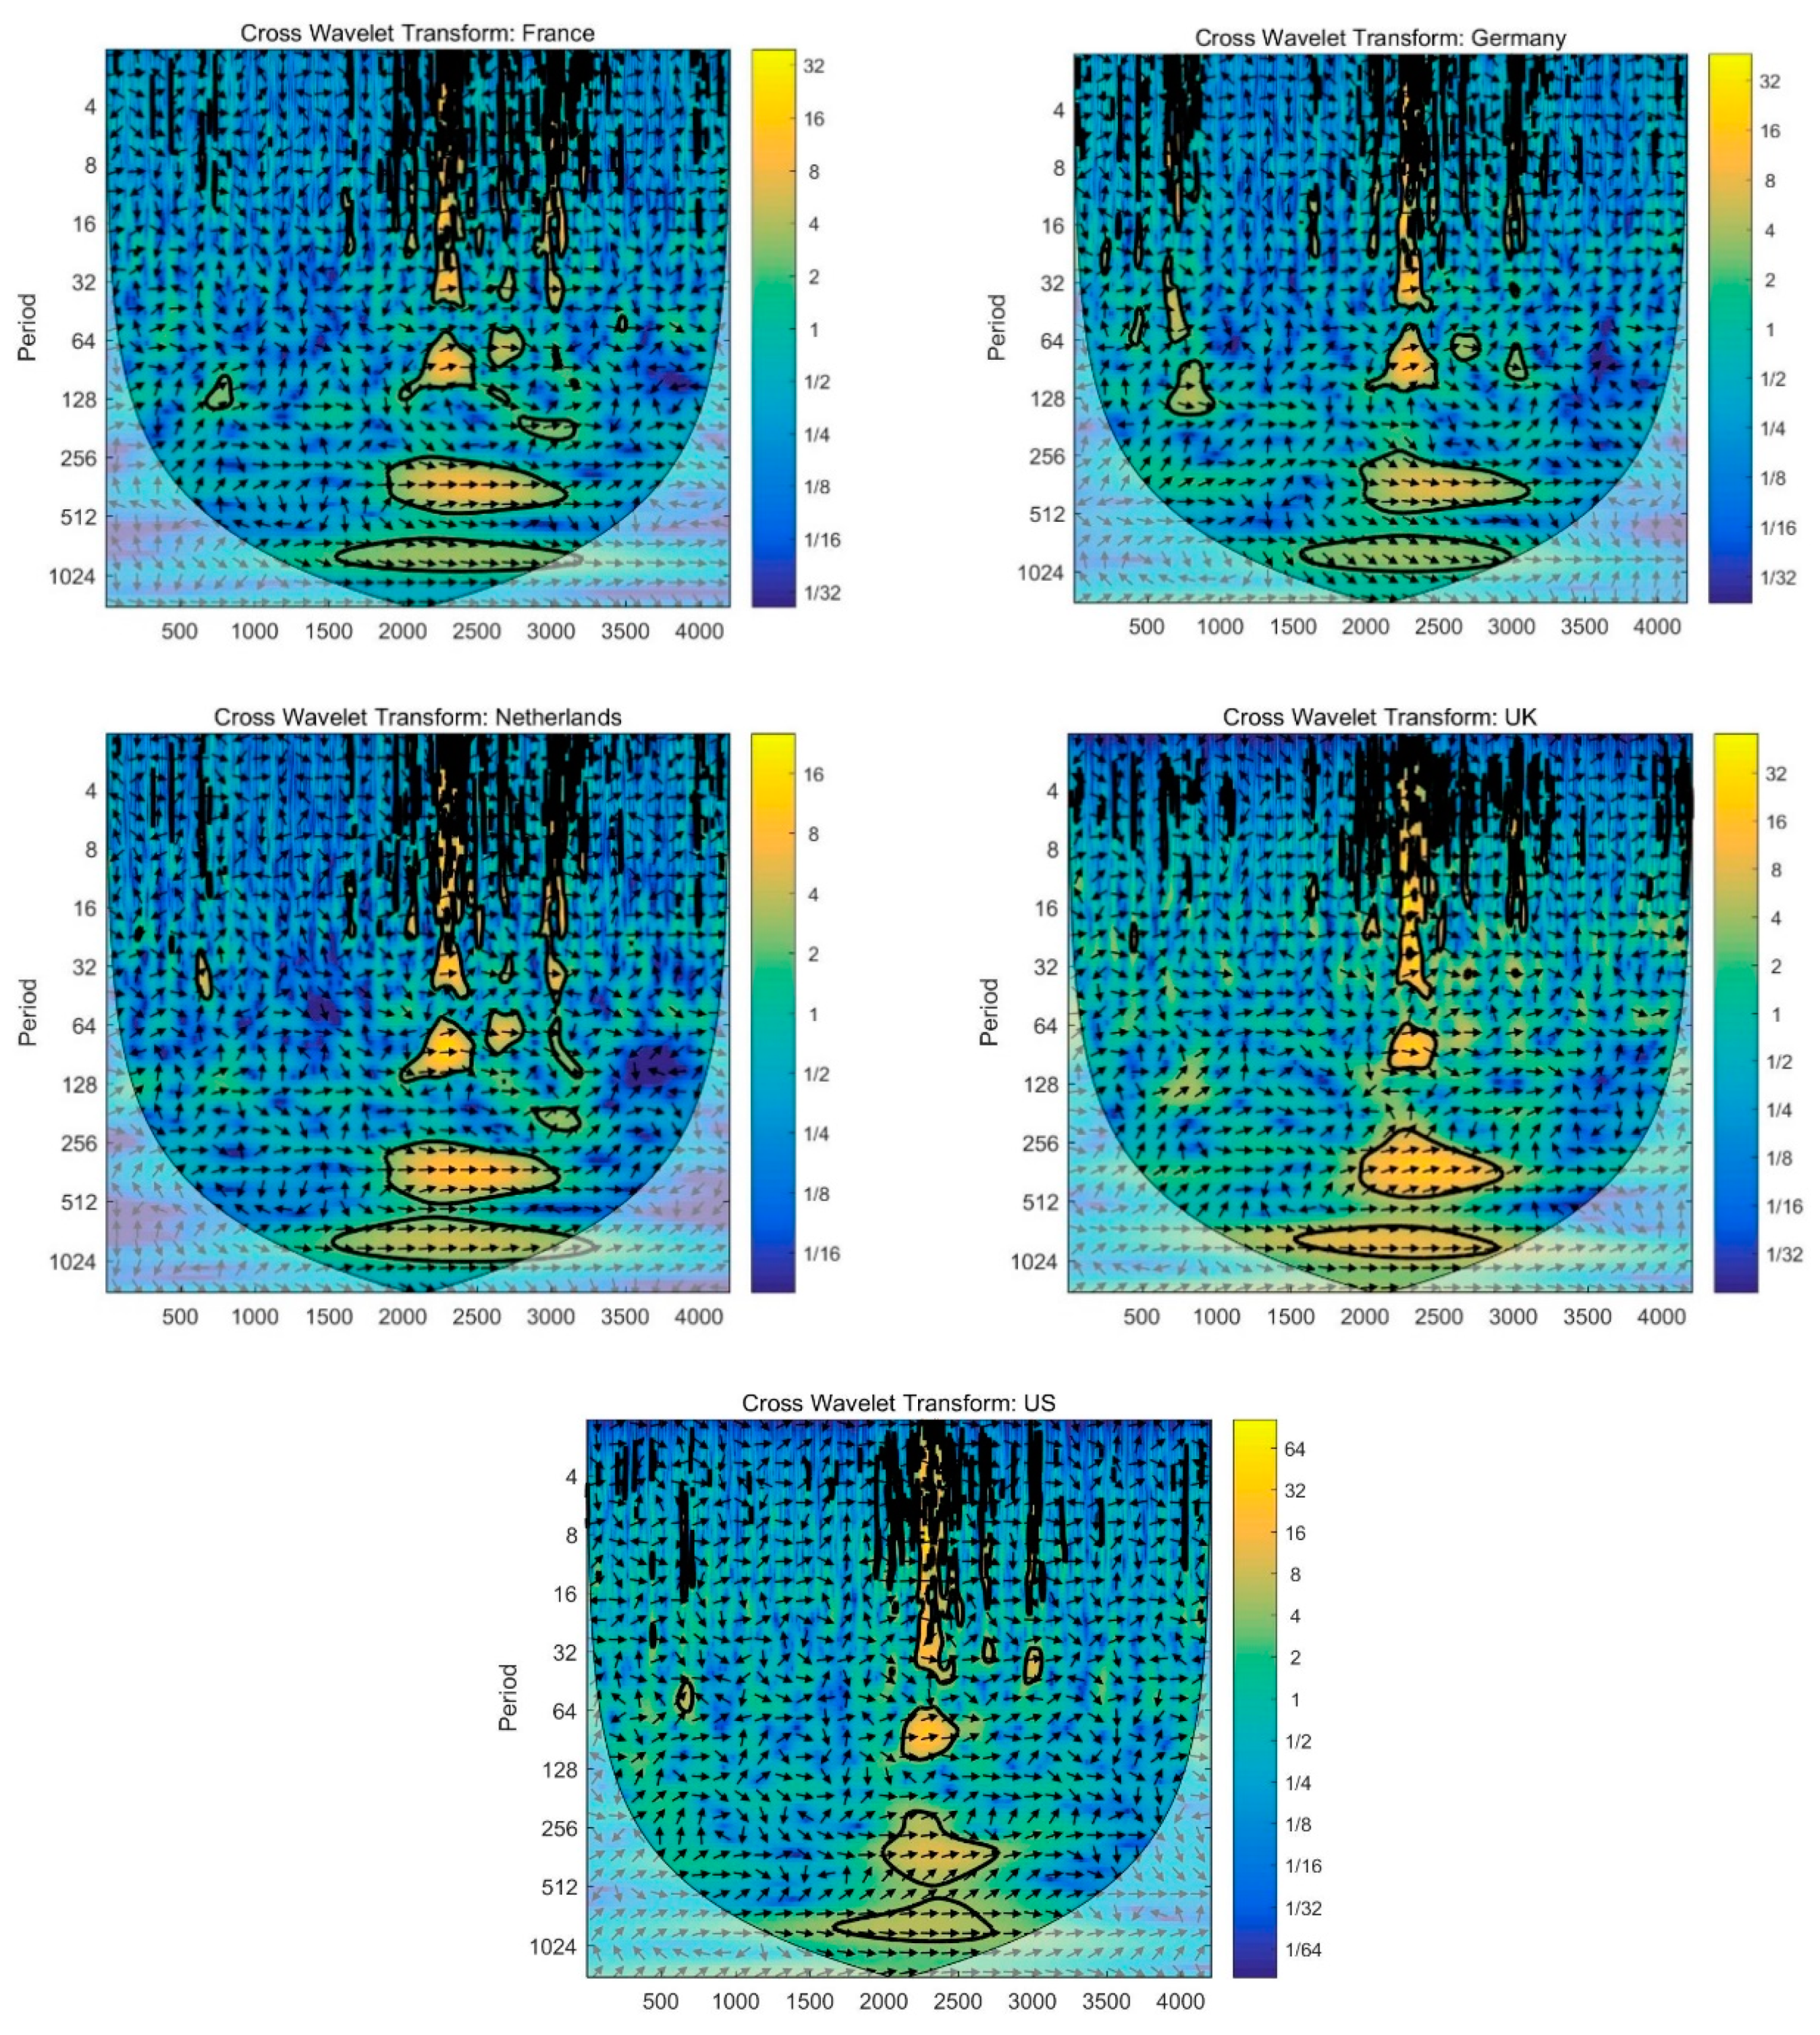
Together with the cross-wavelet power plots (Figure 3) that show the movement of real estate-stock covariance and capture regions in time–frequency space where the two series display high common power, we make some important observations. Overall, the results show that the cross real estate-stock movement is varying, and that the patterns of the relationship are not consistent across time scales/investment horizons.
A relatively high degree of real estate-stock market co-movement appears to present in the short-run for all five countries. Moreover, the co-movement becomes more frequent at the shortest time scales (two to eight days) in the crisis years 2007–2010, which can be linked to the US subprime crisis and followed by the EDC. This observation is similar with previous stock market findings that there was an increase in co-movement at shorter-time scales during the financial crisis.
For the medium-term investment horizon between eight and 32 trading days, there is a significant increase in the coherence area for the four European countries. Most of their cross-asset market movement concentrates at these time scales, implying that the gain from domestic real estate-stock portfolio diversification for the European countries is relatively lower and less significant in the medium term. Moreover, some small areas of high coherence are observed at the end of 2000 for the four European countries, due to the bursting of dotcom bubble in 2000, and the terrorist attack in the US in September 2001. The cross-wavelet power plots also indicate shocks to volatilities between the real estate-stock market co-movement during these periods. Additionally, some periods of strong real estate-stock co-movement are observed around mid-2006 for the four European countries, with a very large area of high coherence detected in the four plots during the GFC and EDC periods, indicating much stronger real estate-stock return correlations due to these two crises. This is supported by the cross-wavelet power plots, which highlight that these crisis periods were associated with high volatility regimes in their financial markets, and caused structural break in the real estate-stock market relationship after 2007. In contrast, the US economy shows milder levels of real estate-stock correlations at these intermediate frequencies until the GFC, where they are more visible and stronger, and they are associated with common high volatility regimes in the two asset markets during this crisis period. Overall, these observations are consistent with stock market literature, which finds an increase in the correlations between markets during financial crisis.
Turning our attention to the cross-asset market movement in the long run, although the cross-wavelet plots indicates the absence of a common high-volatility regime at these higher scales, we observe some relatively high real estate-stock correlations at 32–64 days for the four European countries between 2000 and the beginning 2007, as well as for the UK at 128–256 days from end of 2001 to beginning of 2002, possibly in response to the US 911 terrorist attack. Between mid-2007 and end-2012, strong real estate-stock correlations are clearly visible for all four European countries, with the cross-wavelet power plots displaying common high volatility regimes for these four European countries in two specific periods: October 2007–September 2009 (GFC) and November 2009–December 2011 (EDC). Similarly, the US real estate-stock market co-movement becomes more frequent and stronger, and concentrates at these longer-run scales (32–256 days) during the subprime GFC/EDC, over 2007–2012. Overall, the crises (especially the GFC) have generated relatively more high-power volatility areas at these low-frequency bands. Consequently, in recent years, markets will present a higher volatility, regardless of whether they are stable or volatile.
The phase arrows all points to right, indicating that the identified real estate-stock linkages are in the phase or positively correlated. During crises, the directions of the phase arrows are both up and downs, indicating bi-directional cross-asset causality relationship. Additionally, the lead–lag relationships vary as scale changes. In general, securitized real estate markets lead stock markets in the short run. In contrast, stock markets tend to lead public real estate markets in the long run and to a lesser degree during the medium-term. This lead–lag relationship between stock and public real estate market is consistent with findings by Zhou (2010), in which the US REIT market leads its stock market in the short run, while stock market is the leader in the medium- and long-run.
4.3. CWT: PTV and Rolling PTV Analysis
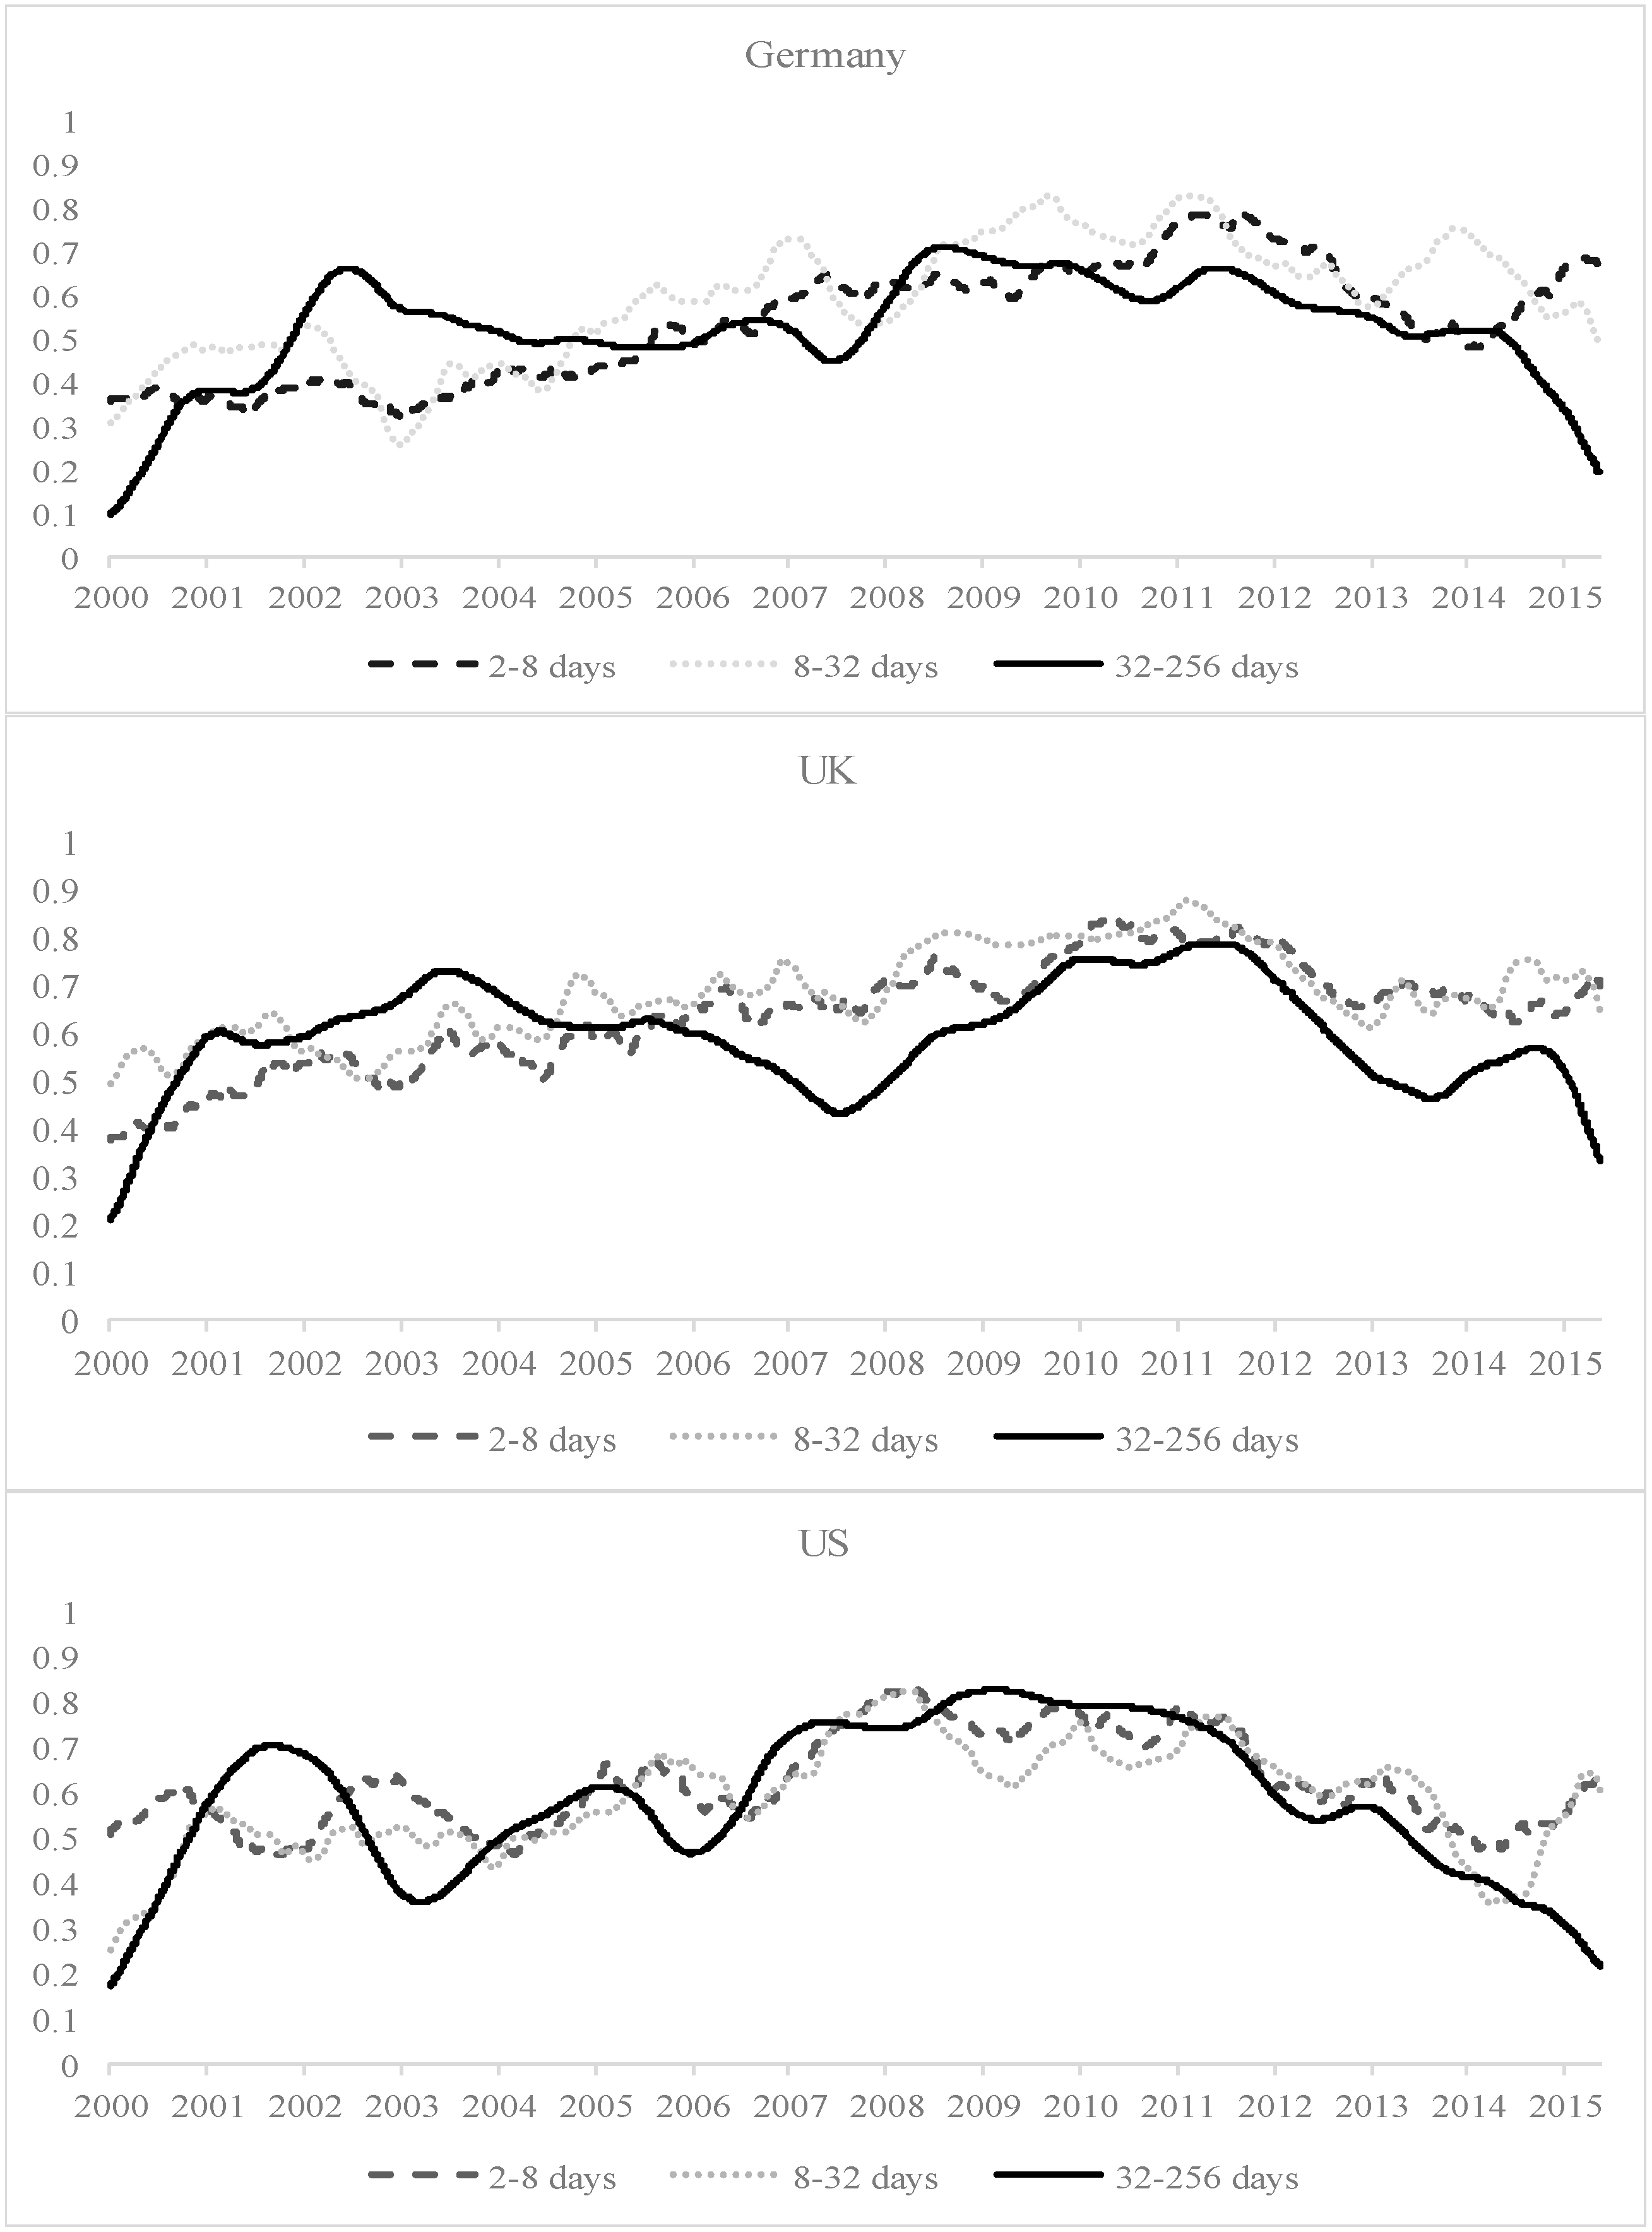
The PTV of the wavelet coherence summarizes in a single number the degree of coherence between the real estate-stock co-movement examined, and is the average of the estimated wavelet correlations (rescaled from 0 to 100). This wavelet tool complements the graphic observations derived from the coherence plots. Table 4 reports the results. For the four European nations, there is an increase in the cross-asset correlation from the GFC to EDC at the three investment horizons, with the cross-asset movement being more pronounced at the medium-term investment horizon (8–32 days) during the EDC. In contrast, the cross-asset relationship in the US is relatively stronger during the GFC, and manifests itself in all three investment horizons. The difference in these co-movement dynamics could be due to the result of the different nature of the two crises, or a change in volatility regime in the respective real estate or stock markets. Another important observation is with the exception for France, the average lowest correlation level between both asset markets is detected at the long investment horizon of 32–256 days in the other four countries. Moreover, the correlations between the two asset markets in the long run are mostly weaker than in the medium-term during the pre-crisis, GFC and EDC and post-crisis periods.
Figure 4 displays five rolling window estimations of PTV plots of the wavelet coherence, with a window of fixed size one-year being used. Overall, the plots indicate that all five countries experience both time variation and scale variation in their cross-asset co-movement. The cross-asset movements are relatively less stable across all three investment horizons during the GFC and EDC high volatility periods. Moreover, all five economies appear to show a declining trend of the real estate–stock correlation, especially in the long run in recent years. One possible explanation is that the long-term impact factors (both fundamental and idiosyncratic) for the real estate and local stock markets are more distinctive than the short-run impact factors or shocks of the two asset markets. Our additional knowledge also indicates that these developed securitized real estate markets appear to be more correlated with the world stock market, in their efforts to promote greater real estate asset securitization by attracting more international capital to their respective REIT markets. The declining long run real estate–local stock correlation evidence is broadly in agreement with Ling and Naranjo’s (2002) observation that securitized real estate has become increasingly less sensitive to local stock market’s long-run influence in some developed countries in recent years. In the long-run, securitized real estate is thus less similar with stock in these developed countries. It follows that international investors should be less dependent on the long-run stock market performance to predict the corresponding securitized real estate performance.
4.4. Contagion Across Real Estates and Local Stock Markets
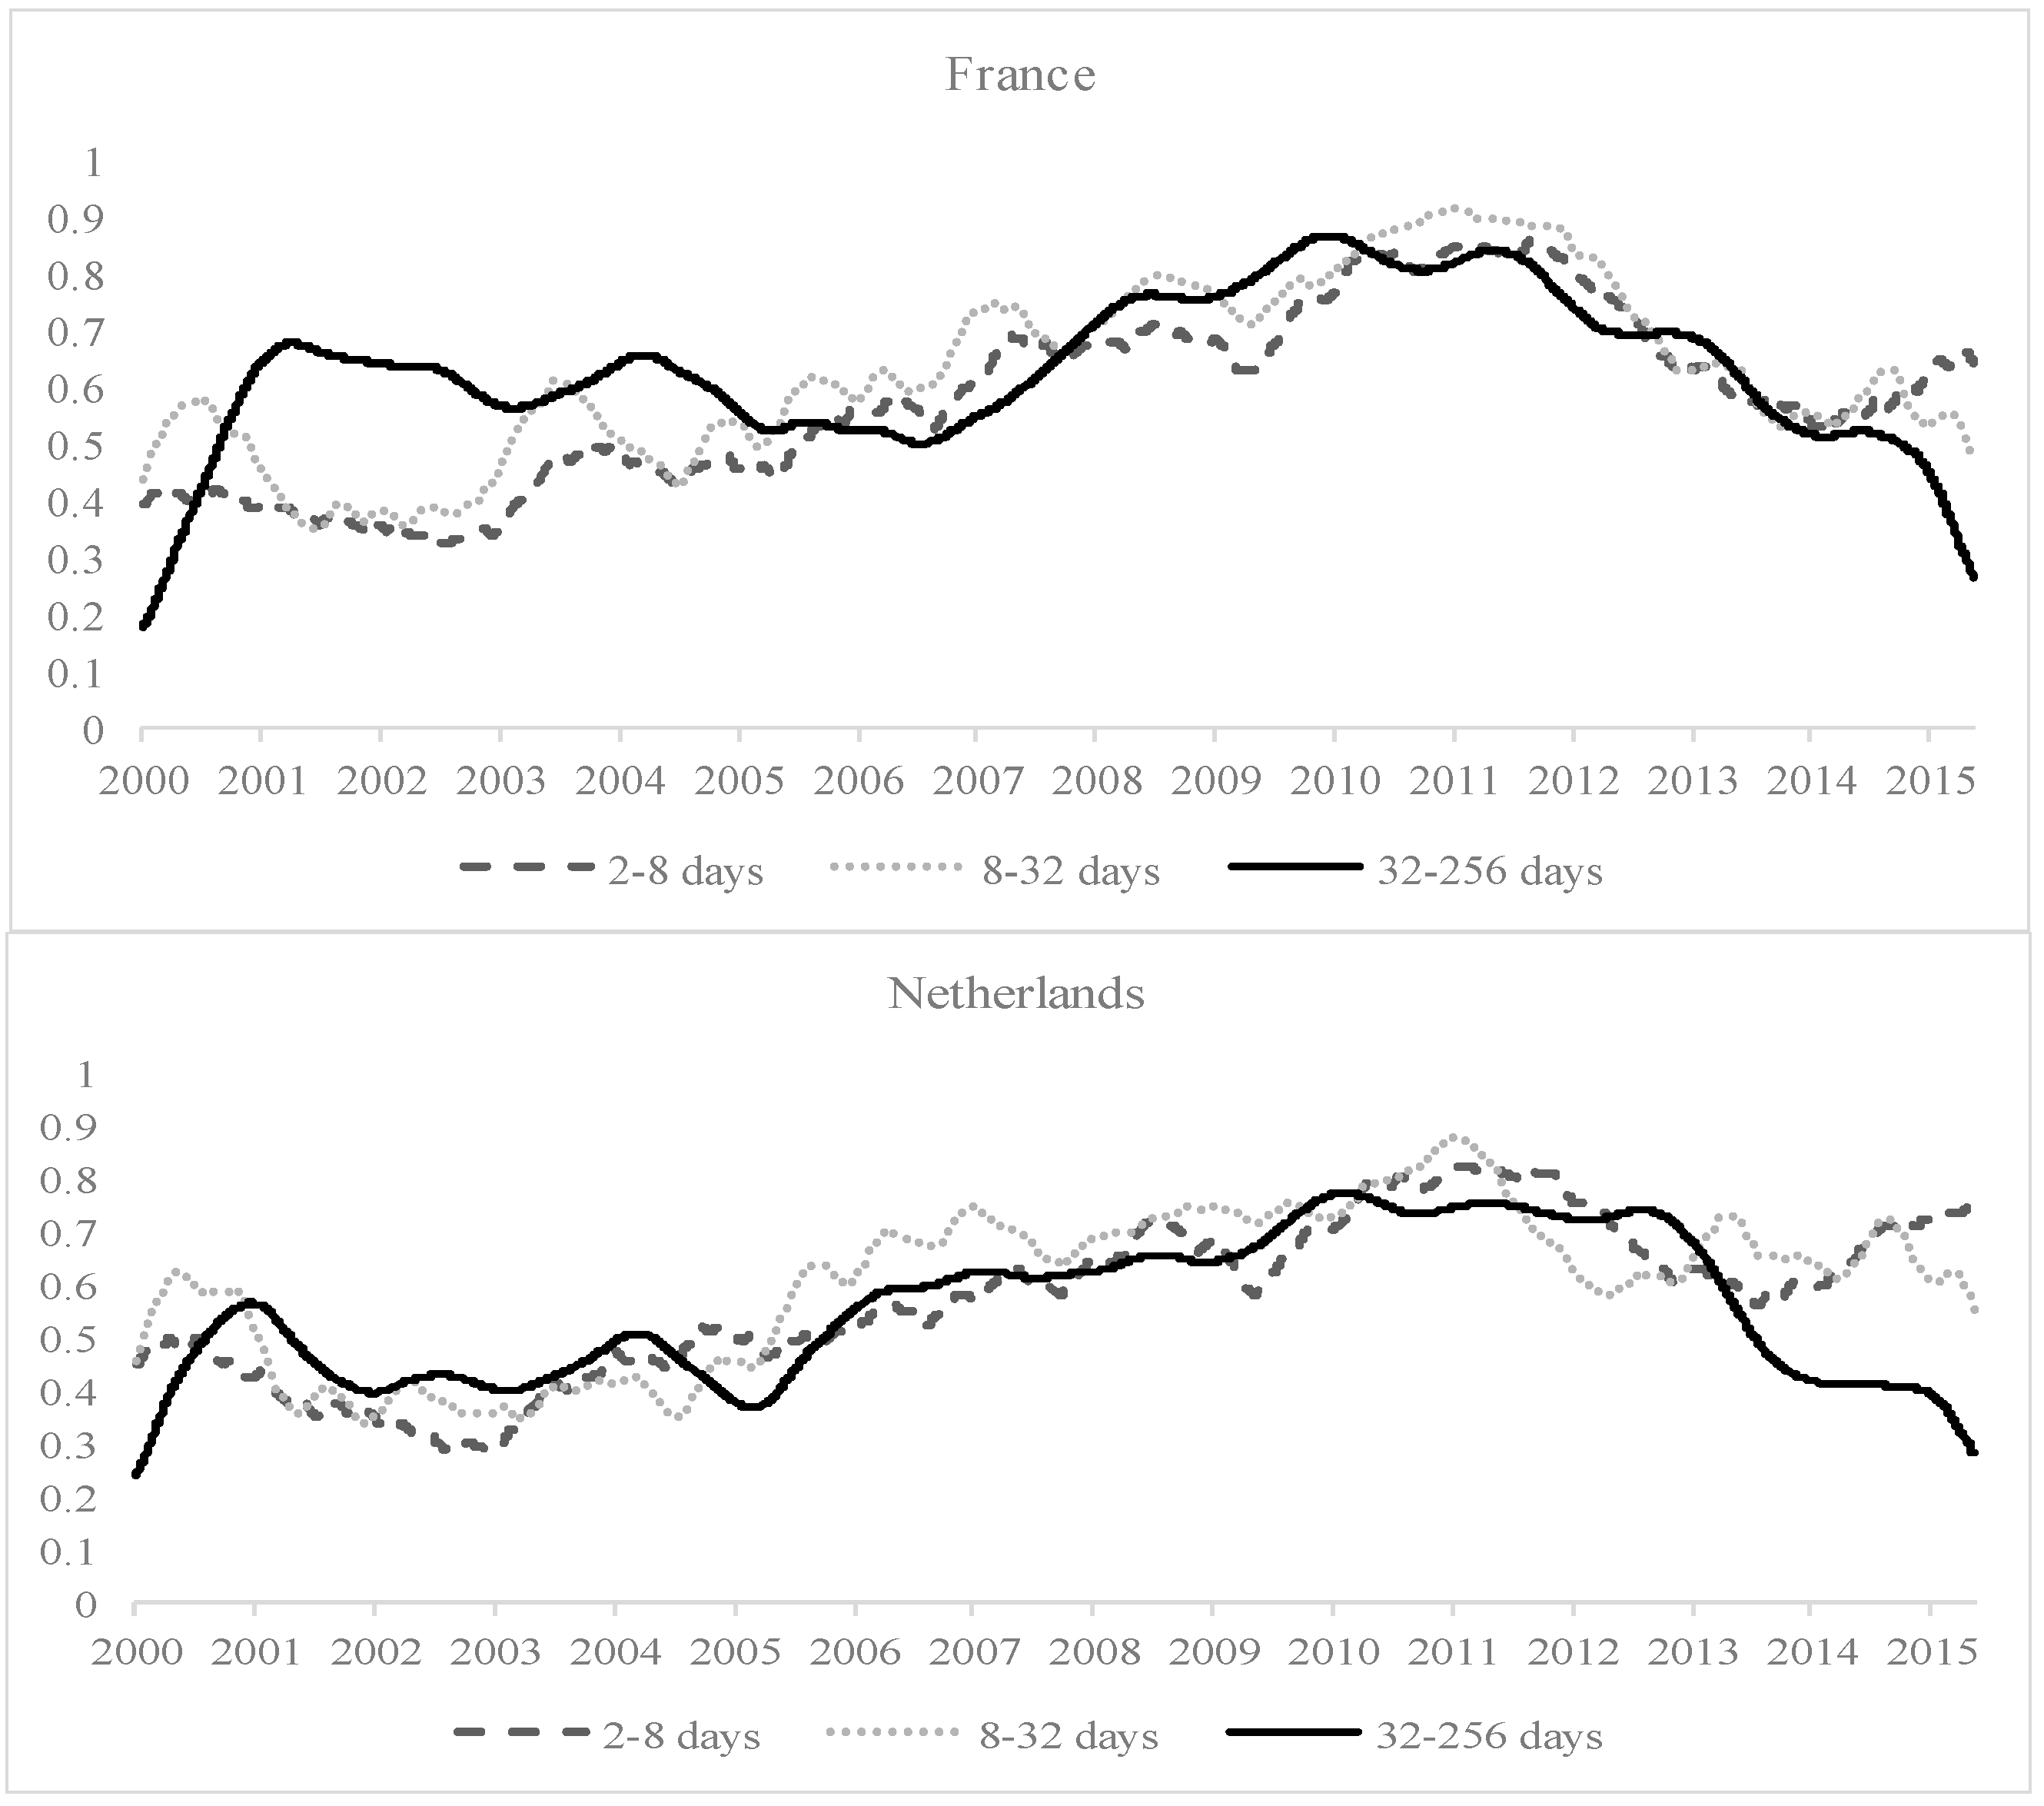
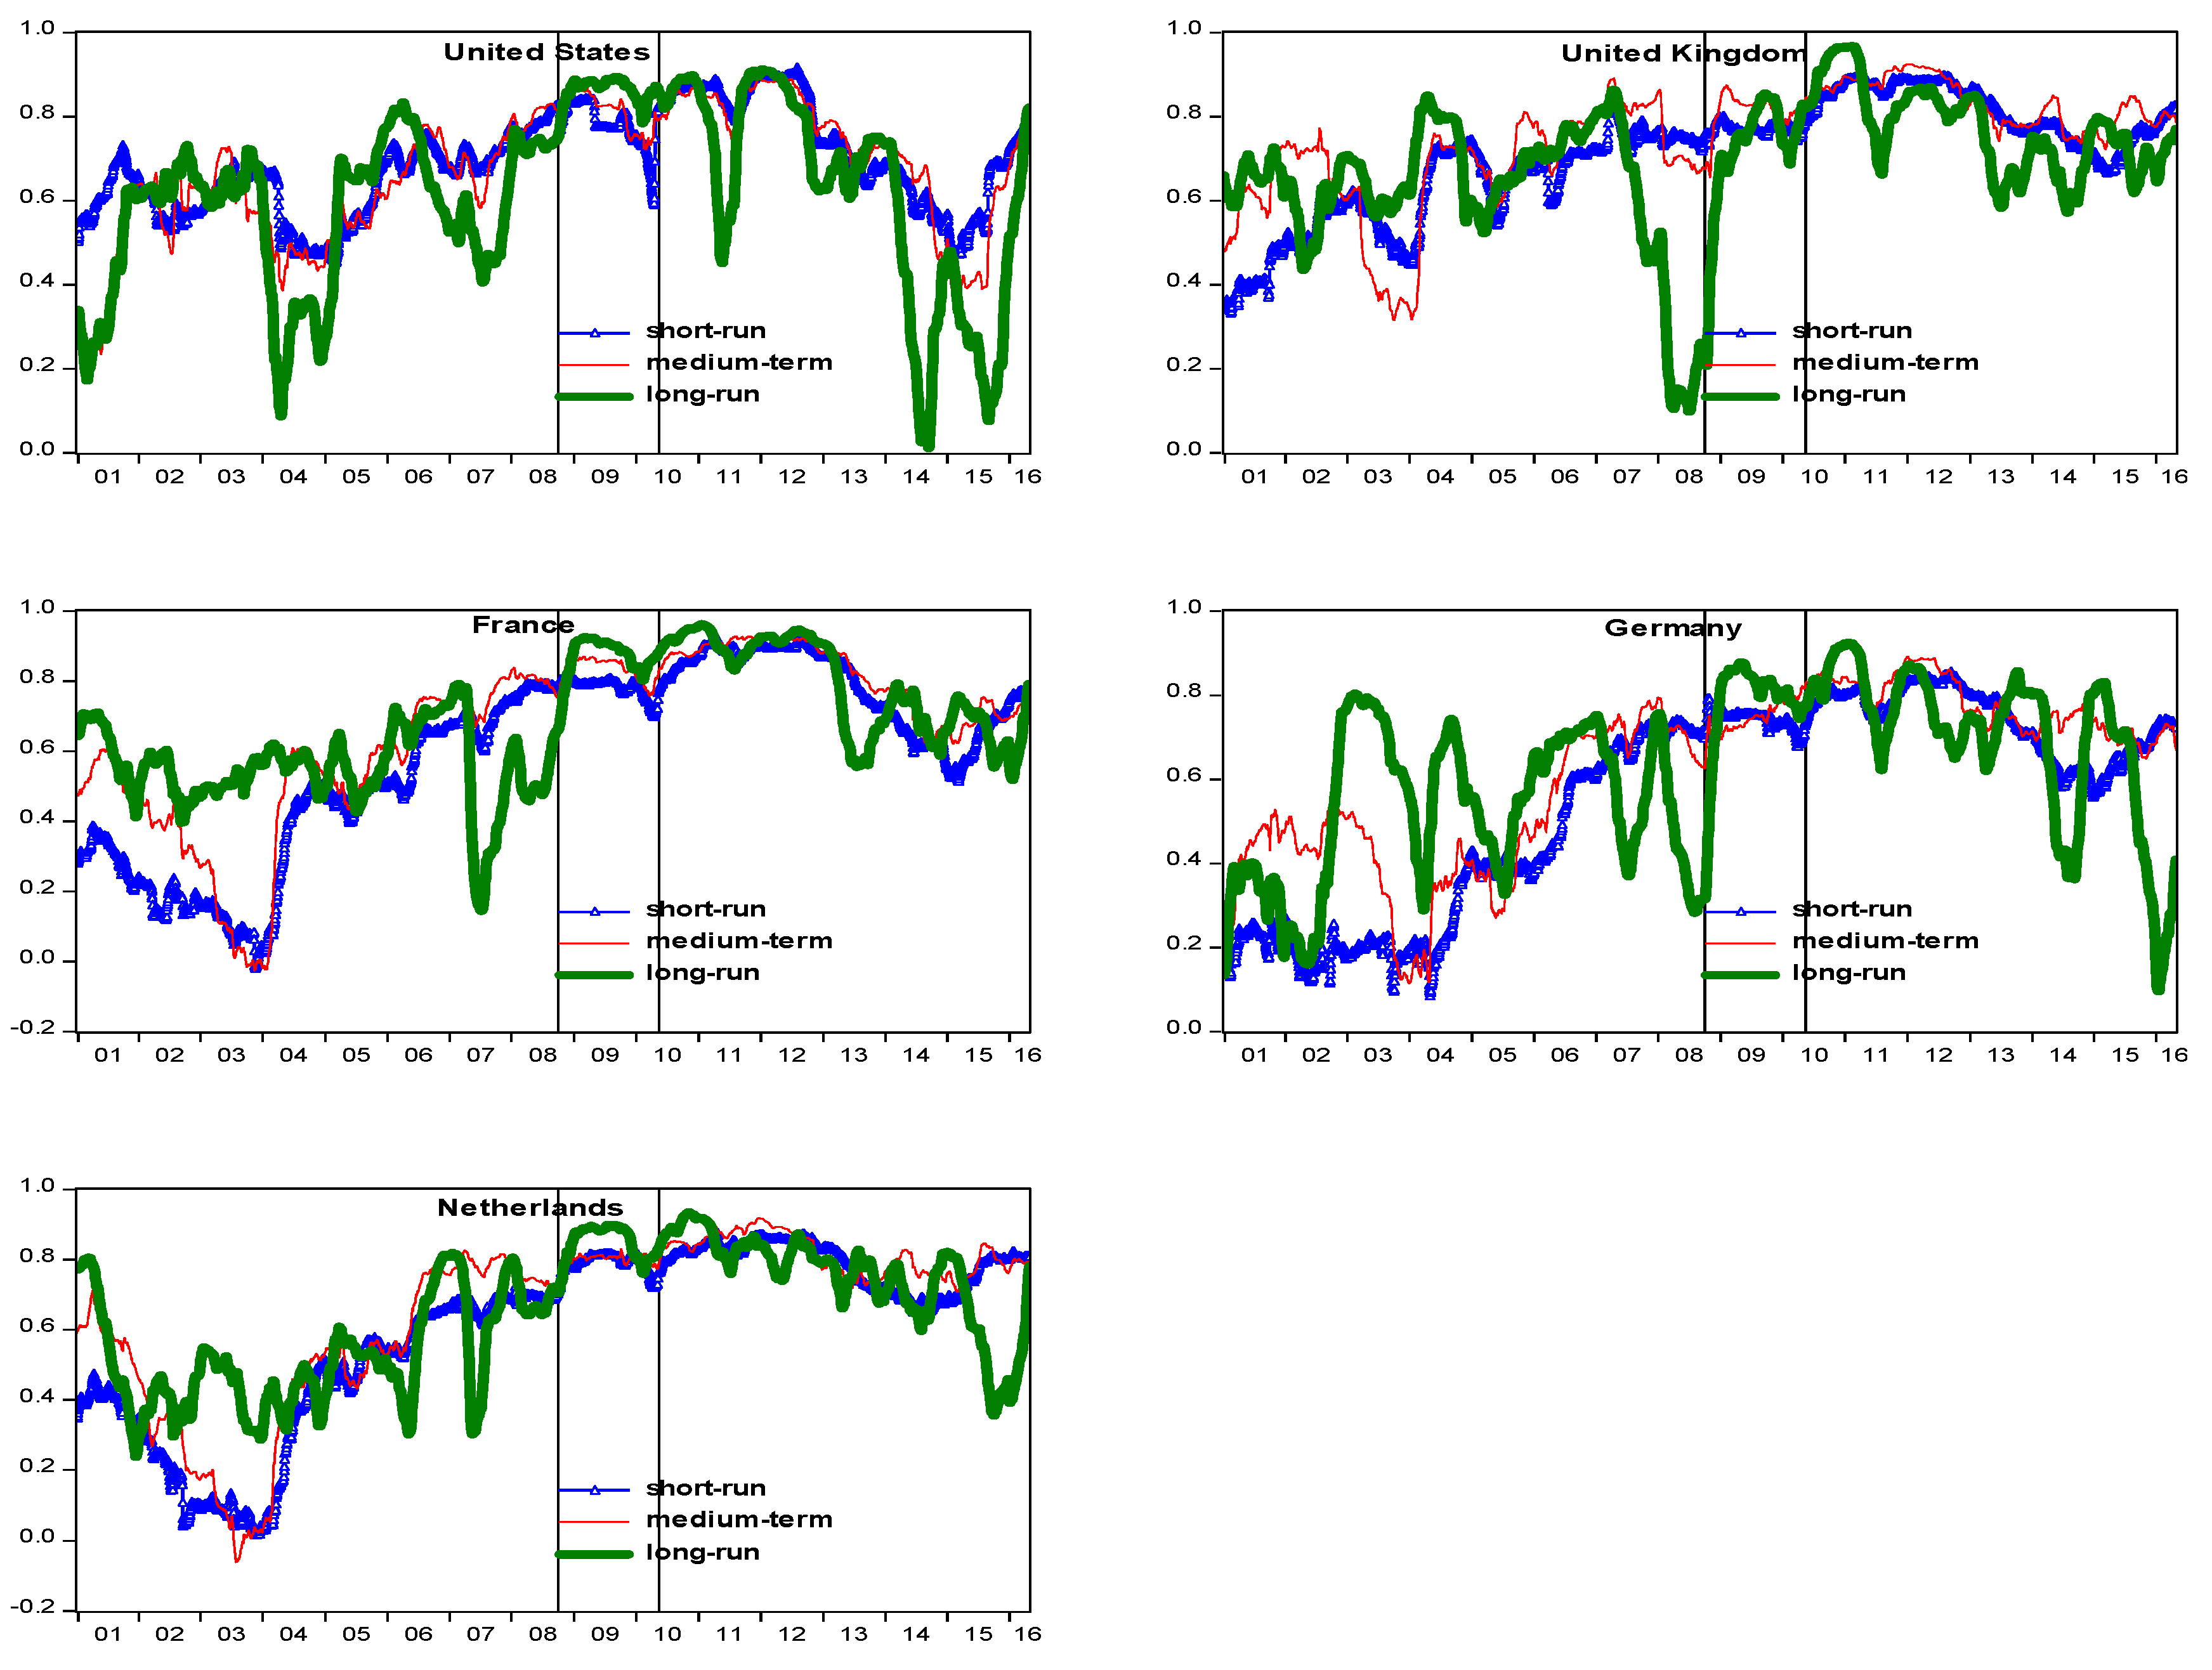
Turning now our attention to contagion, Figure 5 presents the rolling wavelet correlation series for the three investment horizons for the five economies. We observe that the wavelet correlation level fluctuates from one time-scale to another, and oscillate considerably in the long-run. More importantly, the plots show some strong signs of “pure” contagion around the GFC and EDC for some European countries. Strong “fundamentals-based” contagion also extends to the long run in the plots. Although there are some periods of stronger long-run real estate-stock co-movement after the GFC, the long run real estate-stock co-movement becomes weaker relative to the shorter investment horizons after the EDC, implying that the two asset markets are subject to less common market influences in more recent years. In almost all cases, we observe a decrease in the correlation level after the EDC.6
To confirm the presence of contagion (or otherwise), a paired-sample t-test evaluates if there is a significant increase in the wavelet correlation coefficient after the two crises.7 Overall, the results (Table 5) agree with those of wavelet coherence analysis, i.e., real estate–stock co-movement is visible at all levels of decomposition. After the crises, the contagion level increases, which indicates higher correlation and stronger co-movement from d1 to d4 (short-run and medium-term), while the real estate-stock interdependence level also increases, implying higher correlation from d5 to d7 (long-run).
The first crisis event is represented by the collapse of Lehman Brothers on 15 September 2008 (Panel A of Table 5). Real estate-stock co-movement in the US increases after the crisis at the d1, d2, and d3 levels of decomposition. Then from d4 through d7 levels, the increase in correlation is much higher as the scale increases. With a minor exception for Germany that the correlation is lower after the crisis at the d3 decomposition level, we also notice a similarly rising trend for France, UK, and Netherlands. Thus, we may conclude the correlations increase after the crisis in the short-run and medium-term (“pure” contagion), while in the long-run, the correlations are stronger after the crisis (“fundamentals-based” contagion) for the five countries.
Moving on to the second crisis event (EDC—2 May 2010, Panel B of Table 5), we encounter a different situation. We note that the correlations after the crisis from the d1 to d4 levels of decomposition are all significantly higher than the before-crisis correlation, indicating that the respective real estate-stock co-movements are affected by “pure” contagion. In the long run, whilst the US real estate-stock correlation is higher after the crisis for d5; its correlation at the d6 and d7 levels of decomposition are lower, indicating no evidence of long-run contagion across its real estate and stock markets. In contrast, for the four European countries, their real estate-stock co-movements are significantly higher after the crisis in the long-run (from d5 to d7), an outcome which is reasonably expected, as they are affected by a common and regional financial crisis.
Finally, we repeat another two sets of contagion analyzes with 125-day and 500-day windows. We find the results are largely similar with the 250-day window estimations.8 Thus, we may conclude that contagion is an important factor in affecting the short-run and medium-term real estate-stock link during and after the GFC and EDC periods for the developed countries studied. The structure of real estate–stock relationship along scales changes during periods of turmoil, indicating the presence of both “pure” and “fundamentals-based” contagion channels across the two asset markets. Previous studies found that the correlations between public real estate and the stock market increased significantly during the global financial crisis period, whether using local, regional or global stock market as references (Liow 2012), especially for US market. Their results can be seen as average results of our multi-resolution analysis. As such, investors and policymakers can learn something fresh and informative along the time–scale contagion relationship reported here.
4.5. Wavelet-Based Multi-Resolution Asymmetric Dynamic Conditional Correlation (ADCC)-GARCH Model
Table 6 indicates that all of the estimated ARCH and GARCH parameters (a, b), as well as the asymmetric coefficient (g) for the five countries’ raw ADCC models are highly significant. The estimated average dynamic conditional correlation between the real estate and stock markets is 0.5594 (Germany), 0.6011 (France), 0.6029 (Netherlands), 0.6717 (US) and 0.6879 (UK). However, these average results are not helpful for heterogeneous groups of investors, as the results suggest that not much diversification benefits are expected from investing in the two asset markets. This motivates the investigation of the time-scale cross-asset conditional correlations at the three investment horizons.
The decomposed investment horizon results (Table 6) indicates that the asymmetric correlation coefficient (g) is statistically significant in the two short run investment horizons, as well as being the largest in almost every case of medium-term investment horizon. In contrast, g is only statistically significant in the long-run for the UK-securitized real estate market. We may thus conclude that the asymmetric real estate–stock correlation concentrates at shorter to medium time-scales for our sample of the developed real estate markets.
As the level of the investment horizon increases, the average correlation decreases, thus suggesting a decline in the cross-asset relationship, and an improvement of the potential diversification benefits for longer horizon investors and financial institutions that hold these two investment asset types. As an example, the average US real estate–stock correlation in the short-run is 0.6634. This value then becomes weaker in the medium-term (the correlation is 0.5842) and continues to decline to a lower level of 0.3662 in the long run (Table 6), suggesting that these two asset markets are moving away from each other in the long-run. One significant implication from this finding is that the cross real estate-stock diversification over longer investment horizons may be still attractive because of the weakest real estate–stock correlation detected. These findings complement Liow et al.’s (2018a) study on three Greater China (China, Hong Kong, and Taiwan) securitized real estate markets. Accordingly, securitized real estate is an essential asset class providing institutional and private investors with the corresponding diversification benefits for both time- and scale-motivation in mixed real estate–stock portfolios in the long run. Our finding may also imply that securitized real estate behaves more like stock over the shorter investment horizons. This appears to support Lizieri and Satchell’s (1997) view that property stocks are stocks in the short-run, as well as Ling and Naranjo’s (2002) evidence that the securitized real estate may have become increasingly less sensitive to common stocks in some developed countries in recent years, especially in the long run.
5. Conclusions
The relationship between the real estate and local stock market is very important, and there is a lot of research about it. Because financial markets have many time scales (Loh 2013), the main thrust of this paper is an empirical revisit of the time-scale real estate and stock relationship on a select group of five developed countries from the US and Europe. A novel feature of our empirical work is the use of the wavelet-based modelling approaches in the form of wavelet coherency and the phase difference graphical analysis, the static and rolling percentage of the total volume analysis, rolling wavelet correlation contagion analysis, and multi-resolution ADCC-GARCH analysis, making the study more comprehensive and useful for investors, because traditional methods cannot decompose the variables into different time-scale components.
Specifically, understanding the dynamic behavior of the real estate and the local stock market relationship from the interdependence and contagion perspective is important, because it has practical implications in implementing investment and risk analysis, risk modelling, and risk management. Wavelet approaches enhance the understanding of this dynamic behavior at different time scales or investment horizons. Because participants in the real estate and stock markets have different time horizons in their investment strategies, the wavelet approaches are just the appropriate tool for this purpose. From the wavelet analysis, they can extract the time-scale that most interests them, and make decisions according to this time-scale.
According to our novel wavelet analysis, the relationship between the securitized real estate and local stock markets is time-scale-dependent. Moreover, the average long-run real estate–stock correlation fails to outweigh the average short-run correlation, indicating that the real estate markets may have become increasingly less sensitive to the domestic stock markets in the long-run in recent years. Securitized real estate markets appear to lead stock markets in the short run. In contrast, stock markets tend to lead securitized real estate markets in the long run, and to a lesser degree, the medium-term. Additionally, we find incomplete real estate and local stock market integration among the five developed economies, given only weaker long-run integration beyond the crisis periods.
Although the asset markets are different, our results expands previous works with similar stock market results of Lee (2004); Huang (2011) and Deora and Nguyen (2013). Additionally, there are some papers that have explored this wavelet style GARCH approach with commodity markets (Jammazi 2012; Khalfaoui et al. 2015; and X. Liu et al. 2017). There are at least three important implications arising from our financial markets (securitized real estate and local stock markets) study. First, our results are intuitive enough to remind investors that the failure to consider the existence of time-scale dimension of the cross real estate–stock connection will probably result in inaccurate assessment of portfolio performance and diversification benefits. Our finding that “as the investment horizon increases, the correlation between securitized real estate and stock is lower” can be very valuable for investors, policymakers, and financial institutions holding investment portfolios in the two asset markets. It implies that securitized real estate can be a competitive investment tool for long-term investors in developed countries. Since investors may be better off by holding risky assets over a long-run investment horizon (time diversification), our results of weaker long-run real estate-stock co-movement may indicate that an international investor would be able to simultaneously achieve the benefits of portfolio diversification and time diversification.
The second implication of distinguishing between excessive and normal co-movement (or between interdependence and contagion) is an important issue from the perspective of portfolio diversification, especially during periods of high volatility. Since contagion is an influential time-scale factor in affecting the short-run, medium-term and long-run real estate-stock market co-movement dynamics differently, policymakers may refer to our results to intervene in the crisis periods where the contagion level between the two asset markets grows stronger, and the markets are dominated by speculators. Additionally, the regional differences regarding the crisis influence on the real estate–stock co-movement at different investment horizons may be valuable for portfolio investors, financial institutions, and policymakers in managing their real estate–stock portfolios in different regions.
The final and general implication is that although our paper reads like an applied econometric paper, it contributes to a real estate audience by increasing an awareness of the wavelet approach to understand the time-scale risk analysis and modelling, in relation to the co-movement and financial contagion in international stock and securitized real estate markets.
Author Contributions
Conceptualization: K.H.L.; methodology: K.H.L. and X.Z.; software, data collection and gathering: Y.H.; formal analysis and investigation: K.H.L. and X.Z.; original draft preparation: Q.L.; wring, review and editing: K.H.L.; funding acquisition: K.H.L.
Funding
This research was supported by Humanity and Social Science Fund, National University of Singapore, grant number R-297-000-132-646.
Acknowledgments
Kim Hiang LIOW wishes to acknowledge the financial support provided by NUS on the research project R-297-000-132-646 which this paper is derived from.
Conflicts of Interest
The authors declare no conflict of interest.
References
- Aguiar-Conraria, Luís, Nuno Azevedo, and Maria Joana Soares. 2008. Using wavelets to decompose the time–frequency effects of monetary policy. Physica A: Statistical mechanics and its Applications 387: 2863–78. [Google Scholar] [CrossRef]
- Ambrose, Brent W., Esther Ancel, and Mark D. Griffiths. 1992. The fractal structure of real estate investment trust returns: The search for evidence of market segmentation and nonlinear dependency. Real Estate Economics 20: 25–54. [Google Scholar] [CrossRef]
- Bond, Shaun A., G. Andrew Karolyi, and Anthony B. Sanders. 2003. International real estate returns: A multifactor, multi-country approach. Real Estate Economics 31: 481–500. [Google Scholar] [CrossRef]
- Cappiello, Lorenzo, Robert F. Engle, and Kevin Sheppard. 2006. Asymmetric dynamics in the correlations of global equity and bond returns. Journal of Financial Econometrics 4: 537–72. [Google Scholar] [CrossRef]
- Daubechies, Ingrid. 1992. Ten Lectures on Wavelets. Philadelphia: Society for Industrial and Applied Mathematics, pp. 198–202. [Google Scholar]
- Deora, Rahul, and Duc Khuong Nguyen. 2013. Time-scale co-movement between the Indian and world stock markets. Journal of Applied Business Research 29: 765–76. [Google Scholar] [CrossRef]
- Dewandaru, Ginanjar, Rumi Masih, and A. Mansur M. Masih. 2016. Contagion and interdependence across Asia-Pacific equity markets: An analysis based on multi-horizon discrete and continuous wavelet transformations. International Review of Economics & Finance 43: 363–77. [Google Scholar]
- Dima, B., Ş. M. Dima, and Flavia Barna. 2015. A wavelet analysis of capital markets’ integration in Latin America. Applied Economics 47: 1019–36. [Google Scholar] [CrossRef]
- Dornbusch, Rudiger, Yung Chul Park, and Stijn Claessens. 2000. Contagion: Understanding how it spreads. The World Bank Research Observer 15: 177–97. [Google Scholar] [CrossRef]
- Eichholtz, Piet M. A. 1996. Does international diversification work better for real estate than for stocks and bonds. Financial Analysts Journal 52: 56–62. [Google Scholar] [CrossRef]
- Engle, Robert. 2002. Dynamic conditional correlation: A simple class of multivariate generalized autoregressive conditional heteroskedasticity models. Journal of Business & Economic Statistics 20: 339–50. [Google Scholar]
- Grinsted, Aslak, John C. Moore, and Svetlana Jevrejeva. 2004. Application of the cross-wavelet transform and wavelet coherence to geophysical time series. Nonlinear Processes in Geophysics 11: 561–66. [Google Scholar] [CrossRef]
- Hoesli, Martin, and Elias Oikarinen. 2012. Are REITs real estate? Evidence from international sector level data. Journal of International Money and Finance 31: 1823–50. [Google Scholar] [CrossRef]
- Hoesli, Martin, and Kustrim Reka. 2015. Contagion channels between real estate and financial markets. Real Estate Economics 43: 101–38. [Google Scholar] [CrossRef]
- Huang, Shian-Chang. 2011. Wavelet-based multi-resolution GARCH model for financial spillover effects. Mathematics and Computers in Simulation 81: 2529–39. [Google Scholar] [CrossRef]
- Hui, Eddie C. M., and Ka Kwan Kevin Chan. 2013. The European sovereign debt crisis: Contagion across European real estate markets. Journal of Property Research 30: 87–102. [Google Scholar] [CrossRef]
- Hui, Eddie C. M., and Ka Kwan Kevin Chan. 2016. Is there any contagion among major equity and securitized real estate markets? Analysis from a new perspective. Journal of Real Estate Finance and Economics 56: 1–20. [Google Scholar] [CrossRef]
- Jammazi, Rania. 2012. Oil shock transmission to stock market returns: Wavelet-multivariate Markov switching GARCH approach. Energy 37: 430–54. [Google Scholar] [CrossRef]
- Kaminsky, Graciela L., and Carmen M. Reinhart. 2000. On crises, contagion, and confusion. Journal of international Economics 51: 145–68. [Google Scholar] [CrossRef]
- Khalfaoui, Rabeh, M. Boutahar, and H. Boubaker. 2015. Analyzing volatility spillovers and hedging between oil and stock markets: Evidence from wavelet analysis. Energy Economics 49: 540–49. [Google Scholar] [CrossRef]
- Lee, Hahn Shik. 2004. Price and volatility spillovers in stock markets: A wavelet analysis. Applied Economics Letters 11: 197–201. [Google Scholar]
- Li, Xiao-Lin, Tsangyao Chang, Stephen M. Miller, Mehmet Balcilar, and Rangan Gupta. 2015. The co-movement and causality between the US housing and stock markets in the time and frequency domains. International Review of Economics & Finance 38: 220–33. [Google Scholar]
- Ling, David C., and Andy Naranjo. 1999. The integration of commercial real estate markets and stock markets. Real Estate Economics 27: 483–515. [Google Scholar] [CrossRef]
- Ling, David C., and Andy Naranjo. 2002. Commercial real estate return performance: A cross-country analysis. Journal of Real Estate Finance and Economics 24: 119–42. [Google Scholar] [CrossRef]
- Liow, Hiang Kim. 2012. Co-movements and correlations across Asian securitized real estate and stock markets. Real Estate Economics 40: 97–129. [Google Scholar] [CrossRef]
- Liow, Kim Hiang, and Felix Schindler. 2011. An Assessment of the Relationship between Public Real Estate Markets and Stock Markets at the Local, Regional, and Global Levels. ZEW-Centre for European Economic Research Discussion Paper, No. 11-056. Berlin: ZEW-Centre for European Economic Research. [Google Scholar]
- Liow, KimHiang, Xiaoxia Zhou, Qiang Li, and Yuting Huang. 2018a. Co-movement of Greater China real estate markets: Some time-scale evidence. Journal of Real Estate Research. forthcoming. [Google Scholar]
- Liow, KimHiang, Xiaoxia Zhou, Qiang Li, and Yuting Huang. 2018b. Dynamic interdependence between the US and the securitized real estate markets of the Asian-Pacific economies. Journal of Property Investment and Finance. forthcoming. [Google Scholar] [CrossRef]
- Liu, Crocker H., David J. Hartzell, Wylie Greig, and Terry V. Grissom. 1990. The integration of the real estate market and the stock market: Some preliminary evidence. Journal of Real Estate Finance and Economics 3: 26. [Google Scholar] [CrossRef]
- Liu, Xueyong, Haizhong An, Shupei Huang, and Shaobo Wen. 2017. The evolution of spillover effects between oil and stock markets across multi-scales using a wavelet based GARCH-BEKK model. Physica A 465: 374–83. [Google Scholar] [CrossRef]
- Lizieri, Colin, and Stephen Satchell. 1997. Interactions between property and equity markets: An investigation of linkages in the United Kingdom 1972–1992. Journal of Real Estate Finance and Economics 15: 11–26. [Google Scholar] [CrossRef]
- Loh, Lixia. 2013. Co-movement of Asia-Pacific with European and US stock market returns: A cross-time-frequency analysis. Research in International Business and Finance 29: 1–13. [Google Scholar] [CrossRef]
- Mallat, Stephane G. 1989. A theory for multiresolution signal decomposition: The wavelet representation. IEEE Transactions on Pattern Analysis and Machine Intelligence 11: 674–93. [Google Scholar] [CrossRef]
- Markowitz, Harry. 1952. Portfolio selection. The Journal of Finance 7: 77–91. [Google Scholar]
- Michayluk, David, Patrick J. Wilson, and Ralf Zurbruegg. 2006. Asymmetric volatility, correlation and returns dynamics between the US and UK securitized real estate markets. Real Estate Economics 34: 109–31. [Google Scholar] [CrossRef]
- Morawski, Jaroslaw, Heinz Rehkugler, and Roland Füss. 2008. The nature of listed real estate companies: Property or equity market? Financial Markets and Portfolio Management 22: 101–26. [Google Scholar] [CrossRef]
- Okunev, John, and Patrick J. Wilson. 1997. Using nonlinear tests to examine integration between real estate and stock markets. Real Estate Economics 25: 487–503. [Google Scholar] [CrossRef]
- Okunev, John, Patrick Wilson, and Ralf Zurbruegg. 2000. The causal relationship between real estate and stock markets. Journal of Real Estate Finance and Economics 21: 251–61. [Google Scholar] [CrossRef]
- Quan, Daniel C., and Sheridan Titman. 1999. Do real estate prices and stock prices move together? An international analysis. Real Estate Economics 27: 183–207. [Google Scholar] [CrossRef]
- Ramsey, James B. 2002. Wavelets in economics and finance: Past and future. Studies in Nonlinear Dynamics & Econometrics 6: 1–27. [Google Scholar]
- Ranta, Mikko. 2013. Contagion among major world markets: A wavelet approach. International Journal of Managerial Finance 9: 133–49. [Google Scholar] [CrossRef]
- Rua, António, and Luís C. Nunes. 2009. International co-movement of stock market returns: A wavelet analysis. Journal of Empirical Finance 16: 632–39. [Google Scholar] [CrossRef]
- Schindler, Felix. 2011. Long-term benefits from investing in international securitized real estate. International Real Estate Review 14: 27–60. [Google Scholar]
- Tiwari, Aviral Kumar, Mihai Ioan Mutascu, and Claudiu Tiberiu Albulescu. 2016. Continuous wavelet transform and rolling correlation of European stock markets. International Review of Economics & Finance 42: 237–56. [Google Scholar]
- Torrence, Christopher, and Peter J. Webster. 1999. Interdecadal changes in the ENSO-monsoon system. Journal of Climate 12: 2679–90. [Google Scholar] [CrossRef]
- Yunus, Nafeesa, J. Andrew Hansz, and Paul J. Kennedy. 2012. Dynamic interactions between private and public real estate markets: Some international evidence. Journal of Real Estate Finance and Economics 45: 1021–40. [Google Scholar] [CrossRef]
- Zhou, Jian. 2010. Co-movement of international real estate securities returns: A wavelet analysis. Journal of Property Research 27: 357–73. [Google Scholar] [CrossRef]
- Zhou, Jian. 2012. Multiscale analysis of international linkages of REIT returns and volatilities. Journal of Real Estate Finance and Economics 45: 1062–87. [Google Scholar] [CrossRef]
| 1 | Interested readers, please consult various source references for the mathematical functions. |
| 2 | After experimenting with Daubechies LA (8) and Haar filters, the latter was chosen in the MODWT. It is the simplest of all wavelet filters and avoids the boundary problem of filtering. Moreover, the choice of the length of the window is not straightforward, since a longer window implies the loss of time information, and a shorter window implies the loss of frequency information. Ranta (2013) find that calculations using different DWT filters produce very similar results. In this study, we use the 250-day window (one year trading) as the base case, with the 125 days and 500 days used to test the robustness of the results. |
| 3 | Interested readers, please consult Cappiello et al. (2006) for the relevant mathematical details. Empirically, the model can be estimated using RATS or Ox metrics software packages. |
| 4 | The analysis of real estate and stock market returns may need to control for the fact that the real estate securities are embedded in the country specific stock indexes. Whilst this may be probably needed for some Asian markets, such as Japan, Hong Kong, and Singapore, where real estate firms represent a sizeable portion of the overall market valuation, this is probably not that much of a concern for the US and four other European markets in our sample where securitized real estate is a relatively small part of the overall market index. Thus, examining the connection between public real estate and the overall stock market has the flavor of regressing a dependent variable on itself. |
| 5 | The stock market plots are not shown to conserve space. |
| 6 | We inspect another two rolling wavelet correlation series using windows of 125 days and 500 days respectively (the plots are not displayed to conserve space). Although the rising correlation trends of 125-days are quite similar with those using the 250-day windows, the co-movement patterns are more volatile for the 500-day windows. However, the chosen filter (the Haar filter) and the window sizes do not appear to have any significant effect on the results. |
| 7 | |
| 8 | The corresponding correlation and t-test results are not presented to conserve space. |
Figure 1.
Wavelet power spectrum for securitized real estate market indexes. Notes: Contours are for the wavelet spectrum. The color bar on the right-hand-side of each graph ranges from low power spectrum (dark blue color) to high coherency (yellow color). The thick dark lines indicate the 5% significant level for wavelet coherencies.

Figure 2.
Wavelet coherence between securitized real estate and local stock markets. Notes: Contours are for wavelet coherence. The color bar on the right-hand side of each graph range from low coherency (dark blue color) to high coherency (yellow color). The thick dark lines indicate the 5% significant level for wavelet coherence. The arrows indicate the phase difference, which can determine the lead–lag relationship between the series.

Figure 3.
Cross wavelet (covariance) between securitized real estate and local stock markets. Notes: Contours are for cross wavelet spectrum (covariance) between stock and real estate markets. The color bar on the right-hand-side of each graph ranges from low co-spectrum (dark blue color) to high co-spectrum (yellow color). The thick dark lines indicate the 5% significant level for cross wavelet spectrum.

Figure 4.
Rolling estimation of the PTV of wavelet coherence between the securitized real estate and stock markets over the three investment horizons. Notes: This figure displays the rolling estimates of the PTV of wavelet coherence between pubic real estate and the stock markets for the five economies inside the cone of influence with a rolling window of 250 trading days (around one year). Dotted lines represent the rolling estimates corresponding to the frequency band from two to eight trading days (short run). Dashed lines show the rolling estimates from eight to 32 trading days (medium-term) and the solid lines refer to the frequency band from 32–256 days (long-run).


Figure 5.
Rolling wavelet correlations between securitized real estate and local stock markets in the short-run, medium-term and long-run. Notes: The investment horizons are defined as: short-run (2–8 days), medium-term (8–32 days) a long-run (32–256 days). The window size is 250 days with a Haar filter. The two vertical lines in each plot indicates two crisis events: Lehman Brothers collapse (left line, 15 September 2008) and European sovereign debt crisis (right line, 2 May 2010).


Table 1.
Descriptive statistics of daily public real estate and stock returns (local dollars).
| Real Estate Returns (RE) | |||||
| REFR | REGE | RENE | REUK | REUS | |
| Mean | 0.00036 | 0.00001 | 0.00011 | 0.00018 | 0.00045 |
| Median | 0.00084 | 0.00026 | 0.00060 | 0.00099 | 0.00165 |
| Maximum | 0.09329 | 0.14111 | 0.09014 | 0.15391 | 0.32583 |
| Minimum | −0.10357 | −0.14563 | −0.08610 | −0.16445 | −0.32277 |
| Std. Dev. | 0.01555 | 0.01805 | 0.01506 | 0.02286 | 0.02511 |
| Skewness | −0.12634 | −0.03566 | −0.22948 | −0.44756 | −0.31375 |
| Kurtosis | 7.04311 | 10.25292 | 7.21583 | 9.34468 | 30.22439 |
| Jarque-Bera | 2874.59 | 9215.50 | 3150.17 | 7191.67 | 129,896.80 |
| Probability | 0 | 0 | 0 | 0 | 0 |
| Stock Retruns (ST) | |||||
| STFR | STGE | STNE | STUK | STUS | |
| Mean | 0.00002 | 0.00005 | −0.00003 | −0.00010 | 0.00014 |
| Median | 0.00045 | 0.00058 | 0.00031 | 0.00057 | 0.00086 |
| Maximum | 0.11890 | 0.11654 | 0.10577 | 0.14800 | 0.12332 |
| Minimum | −0.11684 | −0.09723 | −0.11362 | −0.14699 | −0.13310 |
| Std. Dev. | 0.01605 | 0.01649 | 0.01591 | 0.01950 | 0.01689 |
| Skewness | −0.01915 | −0.06913 | −0.10200 | −0.28101 | −0.39447 |
| Kurtosis | 8.87680 | 7.38654 | 8.61356 | 9.42605 | 8.69940 |
| Jarque-Bera | 6049.95 | 3373.86 | 5527.15 | 7288.69 | 5799.00 |
| Probability | 0 | 0 | 0 | 0 | 0 |
Notes: The sample period is from 3 January 2000 to 29 April 2016. FR, GE, NE, UK, US stand for France, Germany, Netherlands, United Kingdom, and United States, respectively. The returns are continuously compounded returns. (Source: FTSE/EPRA and Datastream).
Table 2.
Mean and standard deviation (SD) of decomposed returns at different scales.
| Panel A: Public Real Estate Markets | |||||||||
| Real Estate | Time Scales | I | II | III | IV | V | VI | VII | VIII |
| FR | Mean | −1.53 × 10⁻¹⁹ | −6.02 × 10⁻²⁰ | −4.55 × 10⁻²⁰ | 1.47 × 10⁻¹⁹ | −1.65 × 10⁻²⁰ | 1.02 × 10⁻²⁰ | −1.37 × 10⁻²¹ | 5.23 × 10⁻²⁰ |
| SD | 0.0102 | 0.0068 | 0.0050 | 0.0031 | 0.0021 | 0.0017 | 0.0011 | 0.0012 | |
| GE | Mean | 5.05 × 10⁻¹⁹ | 3.70 × 10⁻²⁰ | 7.81 × 10⁻²⁰ | 1.32 × 10⁻¹⁹ | 4.79 × 10⁻²⁰ | 6.25 × 10⁻²⁰ | −3.16 × 10⁻²⁰ | −9.52 × 10⁻²⁰ |
| SD | 0.0117 | 0.0079 | 0.0058 | 0.0038 | 0.0026 | 0.0024 | 0.0012 | 0.0013 | |
| NE | Mean | 1.37 × 10⁻¹⁹ | −2.03 × 10⁻²⁰ | 7.49 × 10⁻²⁰ | 3.40 × 10⁻²⁰ | −2.34 × 10⁻²⁰ | 7.86 × 10⁻²⁰ | 1.19 × 10⁻²⁰ | 1.22 × 10⁻¹⁹ |
| SD | 0.0098 | 0.0065 | 0.0051 | 0.0032 | 0.0021 | 0.0017 | 0.0011 | 0.0011 | |
| UK | Mean | −1.52 × 10⁻¹⁹ | 1.31 × 10⁻¹⁹ | 2.40 × 10⁻¹⁹ | 2.90 × 10⁻¹⁹ | −1.73 × 10⁻¹⁹ | 2.07 × 10⁻¹⁹ | 2.62 × 10⁻²⁰ | 1.08 × 10⁻¹⁹ |
| SD | 0.0085 | 0.0110 | 0.0099 | 0.0071 | 0.0041 | 0.0036 | 0.0018 | 0.0026 | |
| US | Mean | 1.61 × 10⁻¹⁹ | −4.78 × 10⁻¹⁹ | −8.68 × 10⁻²⁰ | 1.16 × 10⁻¹⁹ | −1.49 × 10⁻¹⁹ | 1.58 × 10⁻¹⁹ | 1.16 × 10⁻¹⁹ | 3.73 × 10⁻²⁰ |
| SD | 0.0121 | 0.0122 | 0.0099 | 0.0056 | 0.0041 | 0.0037 | 0.0016 | 0.0018 | |
| Panel B: Stock Markets | |||||||||
| FR | Mean | 6.92 × 10⁻²⁰ | 3.40 × 10⁻¹⁹ | 2.80 × 10⁻²⁰ | −5.09 × 10⁻²⁰ | −1.03 × 10⁻¹⁹ | 3.04 × 10⁻²⁰ | 3.89 × 10⁻²⁰ | −9.28 × 10⁻²⁰ |
| SD | 0.0108 | 0.0071 | 0.0048 | 0.0031 | 0.0020 | 0.0017 | 0.0009 | 0.0009 | |
| GE | Mean | 2.34 × 10⁻¹⁹ | −1.65 × 10⁻¹⁹ | 3.60 × 10⁻²⁰ | −8.66 × 10⁻²¹ | 5.74 × 10⁻²⁰ | 1.44 × 10⁻¹⁹ | 3.72 × 10⁻²⁰ | 7.30 × 10⁻²¹ |
| SD | 0.0111 | 0.0071 | 0.0051 | 0.0034 | 0.0022 | 0.0018 | 0.0010 | 0.0010 | |
| NE | Mean | 8.82 × 10⁻²⁰ | 9.18 × 10⁻²⁰ | −4.56 × 10⁻²⁰ | −8.71 × 10⁻²¹ | −3.00 × 10⁻²⁰ | −4.12 × 10⁻²¹ | 8.68 × 10⁻²⁰ | 7.56 × 10⁻²⁰ |
| SD | 0.0106 | 0.0070 | 0.0048 | 0.0030 | 0.0021 | 0.0018 | 0.0009 | 0.0010 | |
| UK | Mean | −6.62 × 10⁻²⁰ | −6.97 × 10⁻²⁰ | 1.24 × 10⁻¹⁹ | 2.52 × 10⁻²⁰ | −1.90 × 10⁻¹⁹ | −6.55 × 10⁻²⁰ | 3.85 × 10⁻²⁰ | −7.10 × 10⁻²¹ |
| SD | 0.0076 | 0.0102 | 0.0079 | 0.0054 | 0.0034 | 0.0026 | 0.0013 | 0.0016 | |
| US | Mean | −6.39 × 10⁻²⁰ | −2.00 × 10⁻¹⁹ | 4.22 × 10⁻¹⁹ | 5.98 × 10⁻²¹ | −7.83 × 10⁻²⁰ | −1.07 × 10⁻²⁰ | 1.09 × 10⁻¹⁹ | 9.81 × 10⁻²⁰ |
| SD | 0.0071 | 0.0085 | 0.0070 | 0.0045 | 0.0031 | 0.0024 | 0.0012 | 0.0012 | |
Notes: The public real estate and stock returns at different time scales are generated using maximal overlap discrete wavelet transform (MODWT) with a Daubechies LA (8) filter. The countries are: France (FR), GE (Germany), Netherlands (UK), the UK, and the US.
Table 3.
Wavelet variance decomposition by time scales.
| Panel A: Public Real Estate Markets | |||||
| VAR | FR | GE | NE | UK | US |
| d1 | 47.49% | 46.54% | 46.74% | 18.31% | 29.00% |
| d2 | 26.48% | 26.34% | 25.44% | 31.73% | 33.83% |
| d3 | 14.31% | 14.23% | 15.36% | 26.06% | 21.70% |
| d4 | 6.00% | 6.35% | 6.45% | 14.17% | 7.48% |
| d5 | 2.88% | 3.16% | 3.01% | 4.86% | 4.01% |
| d6 | 1.91% | 2.72% | 2.09% | 3.57% | 3.17% |
| d7 | 0.94% | 0.65% | 0.91% | 1.32% | 0.81% |
| Panel B: Stock Markets | |||||
| VAR | FR | GE | NE | UK | US |
| d1 | 50.74% | 50.19% | 49.99% | 20.74% | 23.58% |
| d2 | 27.10% | 26.07% | 26.87% | 37.73% | 34.94% |
| d3 | 12.64% | 12.91% | 12.80% | 22.95% | 23.59% |
| d4 | 5.20% | 5.79% | 5.21% | 10.84% | 9.79% |
| d5 | 2.32% | 2.70% | 2.71% | 4.55% | 4.92% |
| d6 | 1.48% | 1.70% | 1.88% | 2.38% | 2.46% |
| d7 | 0.52% | 0.64% | 0.54% | 0.81% | 0.73% |
Notes: this table presents the percentage of the wavelet variance at seven different scales for each stock market returns generated using MODWT with a Daubechies LA (8) filter; d1–d7 (scale 1 to scale 7).
Table 4.
Percentage of total volume (PTV) of wavelet coherence between real estate and stock markets for each country.
Table 4.
Percentage of total volume (PTV) of wavelet coherence between real estate and stock markets for each country.
| Country | Scale | Full Period (%) | Pre-Crisis (%) | GFC (%) | EDC (%) | Post-Crisis (%) |
|---|---|---|---|---|---|---|
| FR | All | 65.19 | 53.68 | 74.84 | 84.19 | 66.53 |
| 2–8 days | 57.54 | 43.79 | 68.61 | 80.17 | 64.66 | |
| 8–32 days | 61.38 | 49.84 | 74.33 | 85.16 | 63.07 | |
| 32–256 days | 60.43 | 53.64 | 71.01 | 84.14 | 55.16 | |
| GE | All | 59.14 | 50.89 | 66.28 | 72.19 | 61.85 |
| 2–8 days | 53.79 | 41.57 | 62.6 | 70.35 | 62.39 | |
| 8–32 days | 57.74 | 46.87 | 65.57 | 78.82 | 62.33 | |
| 32–256 days | 50.18 | 45.54 | 59.88 | 63.88 | 46.42 | |
| NE | All | 63.45 | 52.35 | 72.27 | 79.22 | 66.43 |
| 2–8 days | 57.33 | 43.84 | 65.33 | 75.52 | 67.79 | |
| 8–32 days | 59.14 | 47.89 | 70.66 | 80.04 | 62.49 | |
| 32–256 days | 53.14 | 44.81 | 63.25 | 75.47 | 51.57 | |
| UK | All | 68.91 | 63.96 | 68.82 | 81.46 | 68.18 |
| 2–8 days | 63.38 | 53.31 | 69.96 | 79.16 | 69.82 | |
| 8–32 days | 67.53 | 60.71 | 73.64 | 82.98 | 68.71 | |
| 32–256 days | 57.41 | 56.49 | 53.63 | 75.79 | 52.19 | |
| US | All | 64.3 | 57.93 | 79.51 | 77.72 | 55.9 |
| 2–8 days | 61.72 | 55.48 | 76.56 | 76.82 | 57.33 | |
| 8–32 days | 57.7 | 49.87 | 77.93 | 71.26 | 56.43 | |
| 32–256 days | 55.92 | 50.12 | 78.06 | 77.93 | 43.48 |
Notes: this table presents the values of the PTV of wavelet coherence between real estate-stock market returns inside the cone of influence for the full sample period as well as for the pre-crisis period (4 January 2000–1 August 2007), Global financial crisis (2 August 2007–31 March 2009), European debt crisis (5 November 2009–1 December 2011), and post-crisis period (2 December 2011–29 April 2016) for each country.
Table 5.
Average rolling wavelet real estate–stock correlations (250 days window) and t-tests before and after the crises.
Table 5.
Average rolling wavelet real estate–stock correlations (250 days window) and t-tests before and after the crises.
| Panel A: Lehman Brothers Collapse (15 September 2008) | ||||||||||||
| d1 (2–4 days) | d2 (4–8 days) | d3 (8–16 days) | ||||||||||
| Events | Corr. Before | Corr After | Diff. | t-stat | Corr. Before | Corr After | Diff. | t-stat | Corr. Before | Corr After | Diff. | t-stat |
| FR | 0.7489 | 0.7823 | 0.0334 | 15.93 * | 0.7835 | 0.8096 | 0.0261 | 20.07 * | 0.7998 | 0.8271 | 0.0273 | 13.38 * |
| GE | 0.7165 | 0.7552 | 0.0386 | 45.70 * | 0.7205 | 0.7468 | 0.0263 | 13.49 * | 0.7311 | 0.6989 | −0.0322 | −22.92 * |
| NE | 0.6722 | 0.7791 | 0.1069 | 38.86 * | 0.7142 | 0.8043 | 0.0902 | 50.71 * | 0.7384 | 0.7970 | 0.0586 | 15.40 * |
| UK | 0.7503 | 0.7619 | 0.0116 | 10.31 * | 0.7519 | 0.7764 | 0.0245 | 12.99 * | 0.7840 | 0.8114 | 0.0275 | 5.70 * |
| US | 0.7671 | 0.8054 | 0.0383 | 11.87 * | 0.7717 | 0.8168 | 0.0451 | 14.51 * | 0.8128 | 0.8489 | 0.0360 | 16.18 * |
| d4 (16–32 days) | d5 (32–64 days) | d6 (64–128 days) | ||||||||||
| Corr. Before | Corr After | Diff. | t-stat | Corr. Before | Corr After | Diff. | t-stat | Corr. Before | Corr After | Diff. | t-stat | |
| FR | 0.8122 | 0.8663 | 0.0541 | 25.93 * | 0.6754 | 0.8668 | 0.1914 | 34.93 * | 0.5354 | 0.8540 | 0.3186 | 14.0 * |
| GE | 0.7125 | 0.7360 | 0.0235 | 2.64 * | 0.6045 | 0.7628 | 0.1583 | 9.43 * | 0.5066 | 0.7549 | 0.2483 | 10.32 * |
| NE | 0.7808 | 0.7903 | 0.0096 | 2.51 * | 0.6871 | 0.8264 | 0.1393 | 18.66 * | 0.7069 | 0.8414 | 0.1345 | 20.4 * |
| UK | 0.6965 | 0.8053 | 0.1087 | 10.48 * | 0.4949 | 0.7325 | 0.2375 | 13.57 * | 0.3227 | 0.7062 | 0.3835 | 26.66 * |
| US | 0.7578 | 0.8359 | 0.0781 | 22.65 * | 0.7246 | 0.8057 | 0.0811 | 16.39 * | 0.7675 | 0.8817 | 0.1143 | 41.19 * |
| d7 (128–256 days) | ||||||||||||
| Corr. Before | Corr After | Diff. | t-stat | |||||||||
| FR | 0.3366 | 0.8842 | 0.5476 | 53.78 * | ||||||||
| GE | 0.4032 | 0.7641 | 0.3609 | 33.76 * | ||||||||
| NE | 0.7017 | 0.8974 | 0.1957 | −36.19 * | ||||||||
| UK | 0.0338 | 0.5236 | 0.4898 | −16.99 * | ||||||||
| US | 0.5618 | 0.8958 | 0.3340 | −22.77 * | ||||||||
| Panel B: European Debt Crisis (2 May 2010) | ||||||||||||
| d1 (2–4 days) | d2 (4–8 days) | d3 (8–16 days) | ||||||||||
| Events | Corr. Before | Corr After | Diff. | t-stat | Corr. Before | Corr After | Diff. | t-stat | Corr. Before | Corr After | Diff. | t-stat |
| FR | 0.7799 | 0.8466 | 0.0668 | 26.46 * | 0.7712 | 0.8527 | 0.0815 | 13.06 * | 0.8077 | 0.8907 | 0.0830 | 28.07 * |
| GE | 0.7440 | 0.7813 | 0.0374 | 14.40 | 0.7249 | 0.8044 | 0.0794 | 27.06 | 0.7224 | 0.8456 | 0.1232 | 64.42 |
| NE | 0.7967 | 0.8189 | 0.0223 | 9.70 * | 0.7927 | 0.8243 | 0.0316 | 6.76 * | 0.8043 | 0.8476 | 0.0433 | 15.85 * |
| UK | 0.7536 | 0.8500 | 0.0964 | 39.21 * | 0.7814 | 0.8591 | 0.0777 | 35.30 * | 0.8014 | 0.8598 | 0.0584 | 28.85 * |
| US | 0.7480 | 0.8612 | 0.1132 | 32.59 * | 0.7567 | 0.8637 | 0.1070 | 27.25 * | 0.8024 | 0.8528 | 0.0504 | 12.57 * |
| d4 (16–32 days) | d5 (32–64 days) | d6 (64–128 days) | ||||||||||
| Corr. Before | Corr After | Diff. | t-stat | Corr. Before | Corr After | Diff. | t-stat | Corr. Before | Corr After | Diff. | t-stat | |
| FR | 0.8438 | 0.8664 | 0.0226 | 6.00 * | 0.8447 | 0.9226 | 0.0778 | 15.08 * | 0.8783 | 0.9188 | 0.0405 | 8.54 * |
| GE | 0.8160 | 0.8286 | 0.0127 | 5.58 * | 0.8275 | 0.8675 | 0.0400 | 13.85 * | 0.8114 | 0.8462 | 0.0348 | 3.28 * |
| NE | 0.7999 | 0.8420 | 0.0421 | 29.72 * | 0.8376 | 0.8698 | 0.0322 | 8.81 * | 0.8367 | 0.9009 | 0.0642 | 9.32 * |
| UK | 0.8386 | 0.8795 | 0.0409 | 18.81 * | 0.7911 | 0.9115 | 0.1204 | 27.13 * | 0.7851 | 0.9179 | 0.1327 | 24.96 * |
| US | 0.7747 | 0.8322 | 0.0576 | 16.83 * | 0.7676 | 0.8418 | 0.0742 | 16.73 * | 0.9212 | 0.8692 | −0.0521 | −16.98 * |
| d7 (128–256 days) | ||||||||||||
| Corr. Before | Corr After | Diff. | t-stat | |||||||||
| FR | 0.8991 | 0.9506 | 0.0515 | 12.98 * | ||||||||
| GE | 0.7943 | 0.8821 | 0.0878 | 15.16 * | ||||||||
| NE | 0.8780 | 0.9100 | 0.0319 | 6.05 * | ||||||||
| UK | 0.7893 | 0.9295 | 0.1402 | 18.21 * | ||||||||
| US | 0.8991 | 0.8280 | −0.0710 | −11.3 * | ||||||||
Note: The null hypothesis for the t-test is the rolling wavelet correlations between real estate–stock markets before and after the two financial turbulences is equal. The shaded results refer to cases where the before-correlation is greater than the after-correlation. * indicates the rejection of the null hypothesis at 5% critical value.
Table 6.
Estimation results of the Asymmetric Dynamic Conditional Correlation (ADCC-GARCH) model for the full period and three levels of decomposition: securitized real estate and local stock market return.
Table 6.
Estimation results of the Asymmetric Dynamic Conditional Correlation (ADCC-GARCH) model for the full period and three levels of decomposition: securitized real estate and local stock market return.
| a | b | g | Mean | SD | Maximum | Minimum | ||
|---|---|---|---|---|---|---|---|---|
| France | Short | 0.0736 *** | 0.9147 *** | 0.0043 | 0.5751 | 0.2613 | 0.9415 | −0.2965 |
| Medium | 0.6193 *** | 0.3102 *** | 0.2158 *** | 0.5610 | 0.5230 | 0.9921 | −0.8290 | |
| Long | 0.795 *** | 0.1667 *** | 0.0713 *** | 0.5262 | 0.7447 | 0.9978 | −0.9275 | |
| Raw data | 0.0258 *** | 0.9696 *** | 0.0054 | 0.6011 | 0.2177 | 0.9144 | −0.0007 | |
| Germany | Short | 0.0677 *** | 0.9199 *** | 0.0011 | 0.5272 | 0.2522 | 0.8938 | −0.3286 |
| Medium | 0.6315 *** | 0.3025 *** | 0.0591 * | 0.5277 | 0.5408 | 0.9896 | −0.8912 | |
| Long | 0.7841 *** | 0.1731 *** | 0.0577 *** | 0.4541 | 0.7715 | 0.9963 | −0.9199 | |
| Raw data | 0.0158 *** | 0.9818 *** | 0.0034 | 0.5574 | 0.2074 | 0.8712 | 0.0565 | |
| Netherlands | Short | 0.0716 *** | 0.9080 *** | 0.0277 ** | 0.5945 | 0.2350 | 0.9277 | −0.2543 |
| Medium | 0.6157 *** | 0.3177 *** | 0.1073 *** | 0.5397 | 0.5286 | 0.9911 | −0.8616 | |
| Long | 0.7758 *** | 0.1870 *** | 0.0956 *** | 0.5315 | 0.7371 | 0.9974 | −0.9077 | |
| Raw data | 0.0185 *** | 0.9781 *** | 0.0033 | 0.6029 | 0.2069 | 0.8842 | 0.0073 | |
| UK | Short | 0.1583 *** | 0.7785 *** | 0.0172 | 0.6029 | 0.2082 | 0.9668 | −0.3337 |
| Medium | 0.6282 *** | 0.2836 *** | 0.2656 *** | 0.6029 | 0.4570 | 0.9931 | −0.7660 | |
| Long | 0.7861 *** | 0.1741 *** | 0.0907 *** | 0.6029 | 0.7548 | 0.9972 | −0.9085 | |
| Raw data | 0.0510 *** | 0.9319 *** | 0.0060 | 0.6029 | 0.1422 | 0.9084 | 0.1061 | |
| US | Short | 0.1693 *** | 0.7302 *** | 0.0581 ** | 0.6029 | 0.1863 | 0.9577 | −0.1926 |
| Medium | 0.6369 *** | 0.281 *** | 0.1536 *** | 0.6029 | 0.4915 | 0.9909 | −0.8335 | |
| Long | 0.7514 *** | 0.2156 *** | 0.0279 *** | 0.6029 | 0.8185 | 0.9952 | −0.9545 | |
| Raw data | 0.0611 *** | 0.8758 *** | 0.0734 *** | 0.6029 | 0.1304 | 0.9100 | 0.0672 |
Notes: a is the estimated ARCH coefficient, and b is the estimated GARCH coefficient, g is the estimates of asymmetric coefficient in the AR (1) ADCC-GARCH model, mean refers to the average values of conditional correlations estimated by the model. The decomposed returns are estimated by MODWT with a Daubechies LA (8) filter. * Significant at the 10% confidence level, ** significant at 5% confidence level, *** significant at 1% confidence level. Short-run corresponds to the frequency band from two to eight trading days; medium-term is from 16 to 32 trading days, and long-run refers to the frequency band from 64–256 days (long run).
© 2019 by the authors. Licensee MDPI, Basel, Switzerland. This article is an open access article distributed under the terms and conditions of the Creative Commons Attribution (CC BY) license (http://creativecommons.org/licenses/by/4.0/).
Share and Cite
MDPI and ACS Style
Liow, K.H.; Zhou, X.; Li, Q.; Huang, Y. Time–Scale Relationship between Securitized Real Estate and Local Stock Markets: Some Wavelet Evidence. J. Risk Financial Manag. 2019, 12, 16. https://doi.org/10.3390/jrfm12010016
AMA Style
Liow KH, Zhou X, Li Q, Huang Y. Time–Scale Relationship between Securitized Real Estate and Local Stock Markets: Some Wavelet Evidence. Journal of Risk and Financial Management. 2019; 12(1):16. https://doi.org/10.3390/jrfm12010016
Chicago/Turabian StyleLiow, Kim Hiang, Xiaoxia Zhou, Qiang Li, and Yuting Huang. 2019. "Time–Scale Relationship between Securitized Real Estate and Local Stock Markets: Some Wavelet Evidence" Journal of Risk and Financial Management 12, no. 1: 16. https://doi.org/10.3390/jrfm12010016