Rapid Prototyping of a Hybrid PV–Wind Generation System Implemented in a Real-Time Digital Simulation Platform and Arduino


1
Asea Brown Boveri, San Luis Potosí 78395, Mexico
2
Facultad de Ingeniería, Universidad Autónoma de San Luis Potosí, San Luis Potosí 78290, Mexico
3
Departamento de Energía, Universidad de la Costa, Barranquilla 080002, Colombia
*
Authors to whom correspondence should be addressed.
Electronics 2019, 8(1), 102; https://doi.org/10.3390/electronics8010102
Submission received: 15 December 2018
/
Revised: 12 January 2019
/
Accepted: 12 January 2019
/
Published: 17 January 2019
(This article belongs to the Special Issue Grid Connected Photovoltaic Systems)
Abstract
:The growing penetration of generation systems based on renewable energy in electric power systems is undeniable. These generation systems have many benefits, but also many challenges from the technical point of view. One of the biggest problems in the case of solar photovoltaic (PV) and wind energy is the intermittency of the raw material, thus hybrid generation systems that contain both sources are being used to complement electric power generation. To analyze the problems of this type of hybrid generation systems, it is necessary to develop models and test systems that allows to study their dynamic behavior. Reported in this paper is the implementation of a full hybrid PV–wind generation system model in a real-time digital simulation platform, and the development of the electronic converter controls. These controllers were implemented in digital devices (Arduino Due) and connected to the simulation platform to test their performance in real-time. In addition, the procedure followed for the development and implementation of the controllers is presented. The proposed test system can be used in renewable energy integration studies and the development of new control strategies.
1. Introduction
Nowadays, the penetration of renewable energy resources in the energy matrix of countries is increasing rapidly, especially in the case of solar photovoltaic (PV) and wind systems [1,2]. These energies offer cleaner, more reliable, and economically more competitive generation of electrical energy, as compared with conventional energy generation, in sites where high wind speeds or solar irradiation are available [3]. This situation creates scenarios with greater diversification of energy generation [4], which helps to mitigate the environmental impacts caused by the production, distribution, and final use of conventional energy forms [5,6].
Solar and wind energy generate technical energy management challenges due to their intermittent nature, making it necessary to implement control and supervision strategies, which must comply with the restrictions imposed by the demand, generation, and storage systems [7]. In this context, digital simulation platforms in real-time are being used to evaluate requirements of these generation systems connected to the network and the performance of their control systems [8,9,10,11,12].
A way to test the performance of control systems for renewable energy systems before their final system implementation is by programming the developed control laws into digital devices, such as microcontrollers and FPGAs (Field-Programmable Gate Array), among others, and connecting the digital device to a real-time simulator. This technique is known as rapid prototyping [13].
There are reports in the literature discussing the use of the rapid prototyping to test controllers for renewable energy systems. In Reference [14], a control for a permanent magnet synchronous generator (PMSG) used in a variable-speed wind turbine is presented; the objective of this controller was to obtain maximum power from the incident wind with maximum efficiency under different load conditions. In References [15,16], the authors developed controls for tracking the maximum power point (MPP) in wind energy generation systems, and with the obtained results calculated the pitch angle of the wind turbines. Meanwhile, in Reference [17], a methodology to enable wind farm participation in automatic generation control using energy storage devices is reported; in this case, a controller for the real and reactive power was realized through a dSPACE (Digital Signal Processing and Control Engineering). Additionally, this technique has been used in PV systems, for instance in Reference [18], where it is used for the implementation of power electronics converters using a Xilinx System Generator, and in References [19,20,21,22], where the implementation in digital devices of the three-phase inverter and its control systems is reported.
Regarding hybrid PV–wind generation systems, the modeling, testing, and implementation of prototypes, including the necessary converters and controls, has been reported. In Reference [23], a laboratory prototype was built using a doubly excited permanent-magnet brushless machine and a PV panel, while in Reference [24] a similar prototype was developed using a PV-fed inverter and an assisted wind-driven induction generator. In Reference [25], the development is presented of supervisory control strategies for a grid-connected hybrid generation system; the proposed control strategies were tested using the rapid prototyping technique. In References [26,27,28], the developed control strategies for the hybrid generation system were tested using a DSP (Digital Signal Processor), a PIC (Peripheral Interface Controller), and real-time simulator, respectively.
Although many works have reported the use of real-time simulators and the rapid prototyping technique, after a careful review of the literature it was found that in most of the cases only one generation system and its converter were analyzed. This is because of the difficulty in communicating between several digital devices at the same time, or due hardware limitations. In addition to this, the procedure used for the rapid prototyping and connection between digital devices is not reported, which makes it difficult to reproduce the reported results; this is crucial for the development of new research. For this reason, the contribution of this paper is a full model of a hybrid PV–wind generation system in an RTDS (which stands for real-time digital simulator). Additionally, the development of the converter control techniques and their implementation in digital devices (Arduino Due) is presented, as well as a description of the procedure used for their rapid prototyping and their real-time performance testing.
The rest of this paper is organized as follows: Section 2 presents a description of the structure and modeling of the test system. Section 3 presents the converters used and the development of their control techniques. Section 4 shows the considerations for control law implementation in the Arduino Due and its connection with the RTDS. Section 5 discusses and presents simulations of the grid-connected hybrid PV–wind model through a three-phase inverter during transient conditions. Finally, Section 6 draws the main conclusions of this work.
2. Modeling of the Test System
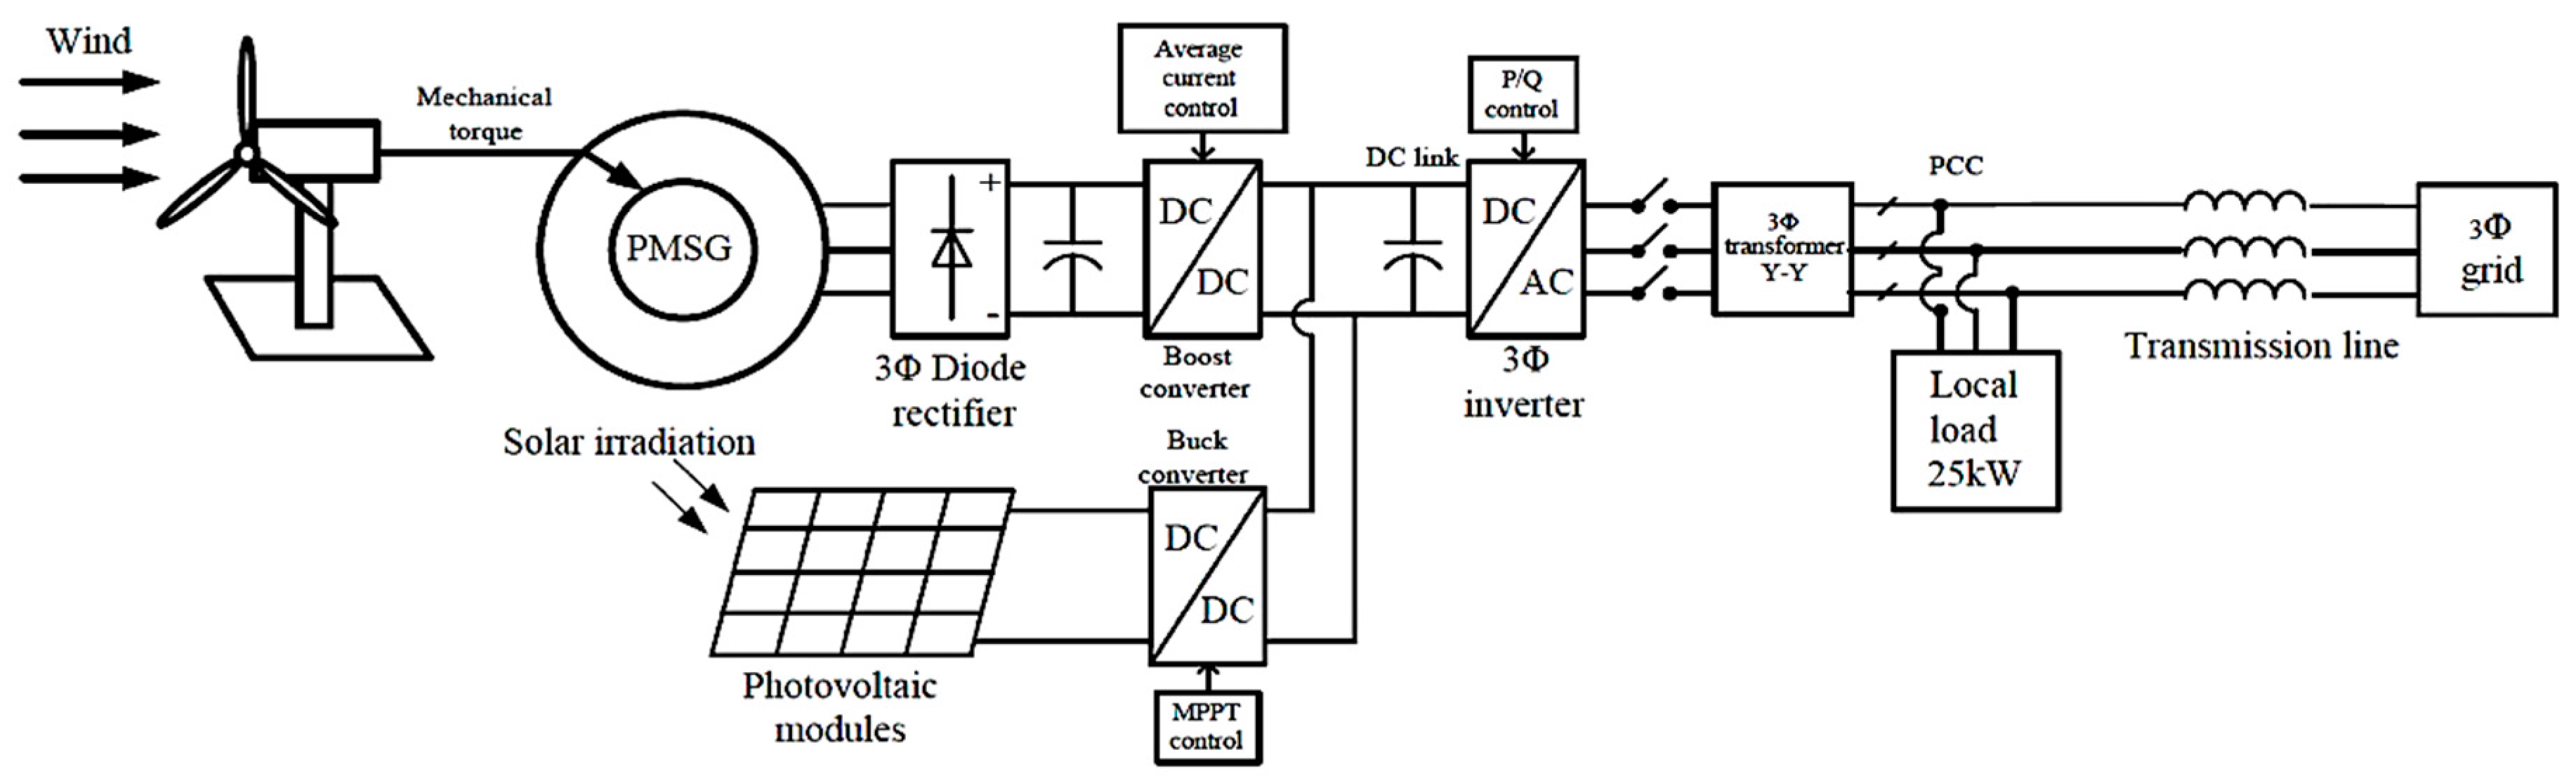
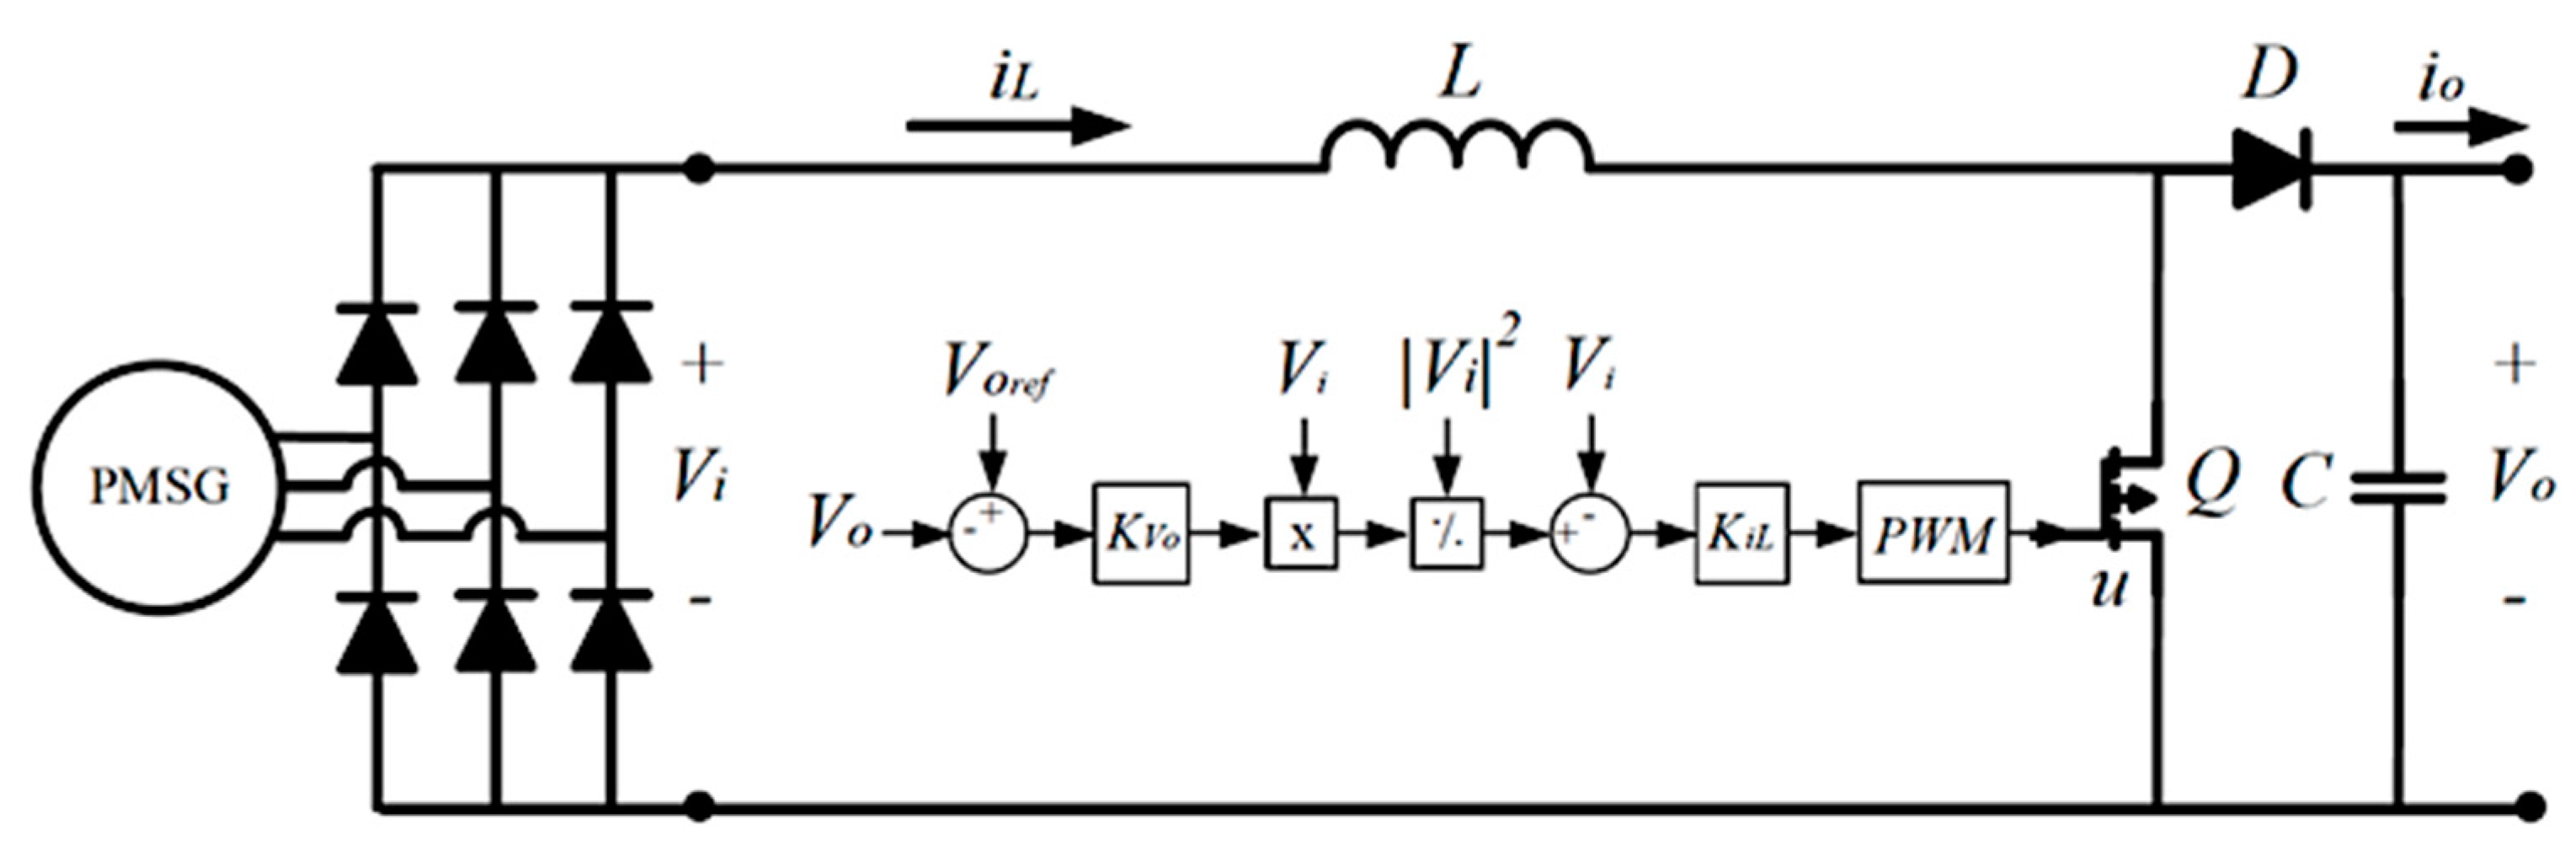
The proposed hybrid PV–wind test system implemented in this research is shown in Figure 1. The PV array is comprised of 400 Prostar Monocrystalline modules of 50 W each, with a total system capacity of 20 kW, and it is composed of 10 strings of modules in parallel, with each string having 40 modules connected in series. The PV system is connected to a DC-link voltage through a DC–DC buck converter; this converter uses a maximum power point tracking (MPPT) algorithm to ensure maximum extraction of power from the PV system. On the other side, the wind generation system is comprised of a three-phase PMSG of 30 kW and 220 V, coupled to a wind turbine. The generator terminals are connected to a three-phase diode rectifier to convert the generated electrical energy from AC to DC. A controlled DC–DC boost converter is used to connect the system with the DC-link voltage at 700 V. This converter is considered to operate the wind generation system close to the unity power factor. Finally, after the DC-link voltage, a three-phase pulse width modulation (PWM) inverter is used to convert the energy into a 220 V, three-phase AC voltage, and then a step-up transformer of 0.22/13.8 kV is used to elevate the voltage level to the grid level. At the terminals of the transformer, a load of 25 kW is connected. The generation system and load are connected with the grid through a transmission line, in order to send any surplus of energy or compensate the lack of generation by the hybrid PV–wind generation system, according to the requirements of the local load. The parameters of the test system can be consulted in Appendix A.
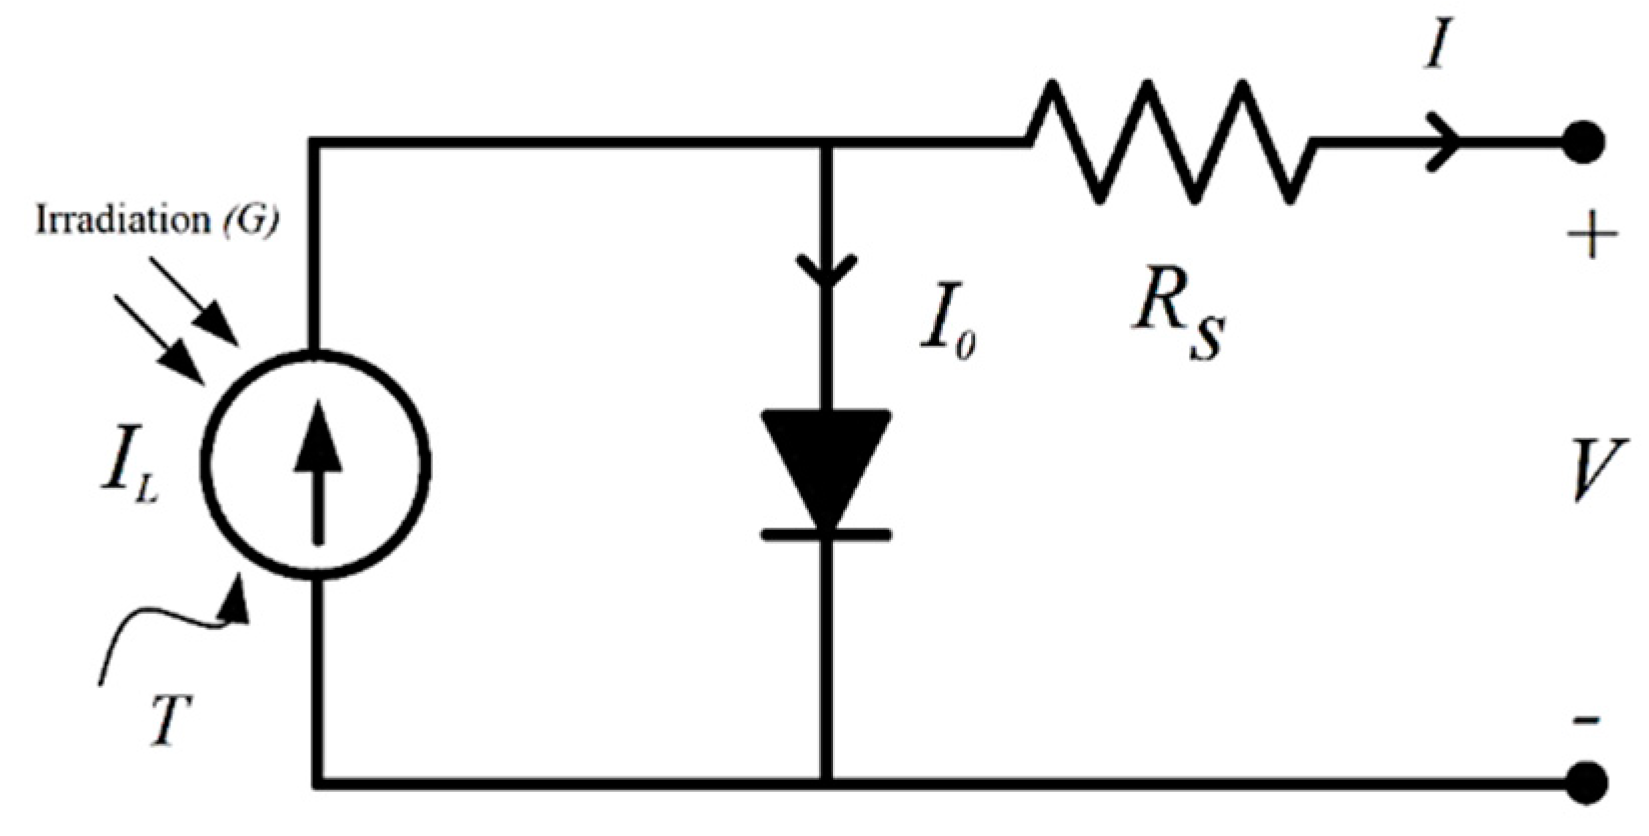
2.1. Modeling of a PV Cell
The model used to represent the behavior of each of the PV modules is composed of several PV cells [29]. Figure 2 shows the scheme of a PV cell [30]. This model considers the effects of the temperature (T) on the photo-generated current (IL) and the saturation current of the diode (I0). Additionally, a series resistance (Rs) is included to represent the losses in the module due to internal connections between cells.
The equations that describe the current–voltage (I–V) characteristic curve of the PV cell are [31,32]:
where q is the electron charge, K is the Boltzmann constant, G is the irradiation, Isc is the short-circuit current, Voc is the open-circuit voltage, n is an idealization factor of the diode, Vg is the band-gap voltage, and T1 and T2 are the standard test temperature and nominal operating temperature, respectively.
All parameters needed for Equations (1)–(8) are found in the datasheets provided by the photovoltaic panel manufacturers.
2.2. Modeling of the Wind Turbine
The wind turbine is a device used to extract the mechanical power available from the wind, after which this mechanical power is passed to the electric generator and converted into electrical power. To represent this process, it is necessary to have a model that describes the relationship between the wind speed and the mechanical power extracted, a model of the transfer of mechanical power to the generator through the rotor shaft, and a model of the electric generator.
Typically, the equation used to calculate the mechanical power extracted (Pw) from wind [33,34,35,36] uses the air density (ρ), the area covered by the wind turbine rotor (AR), the wind speed (vwind), and a power coefficient (cp), which is a function of the tip speed ratio (λ) and the blade pitch angle (β).
The values of the coefficients c1 to c6 are calculated based on the power curve of the wind turbine [37].
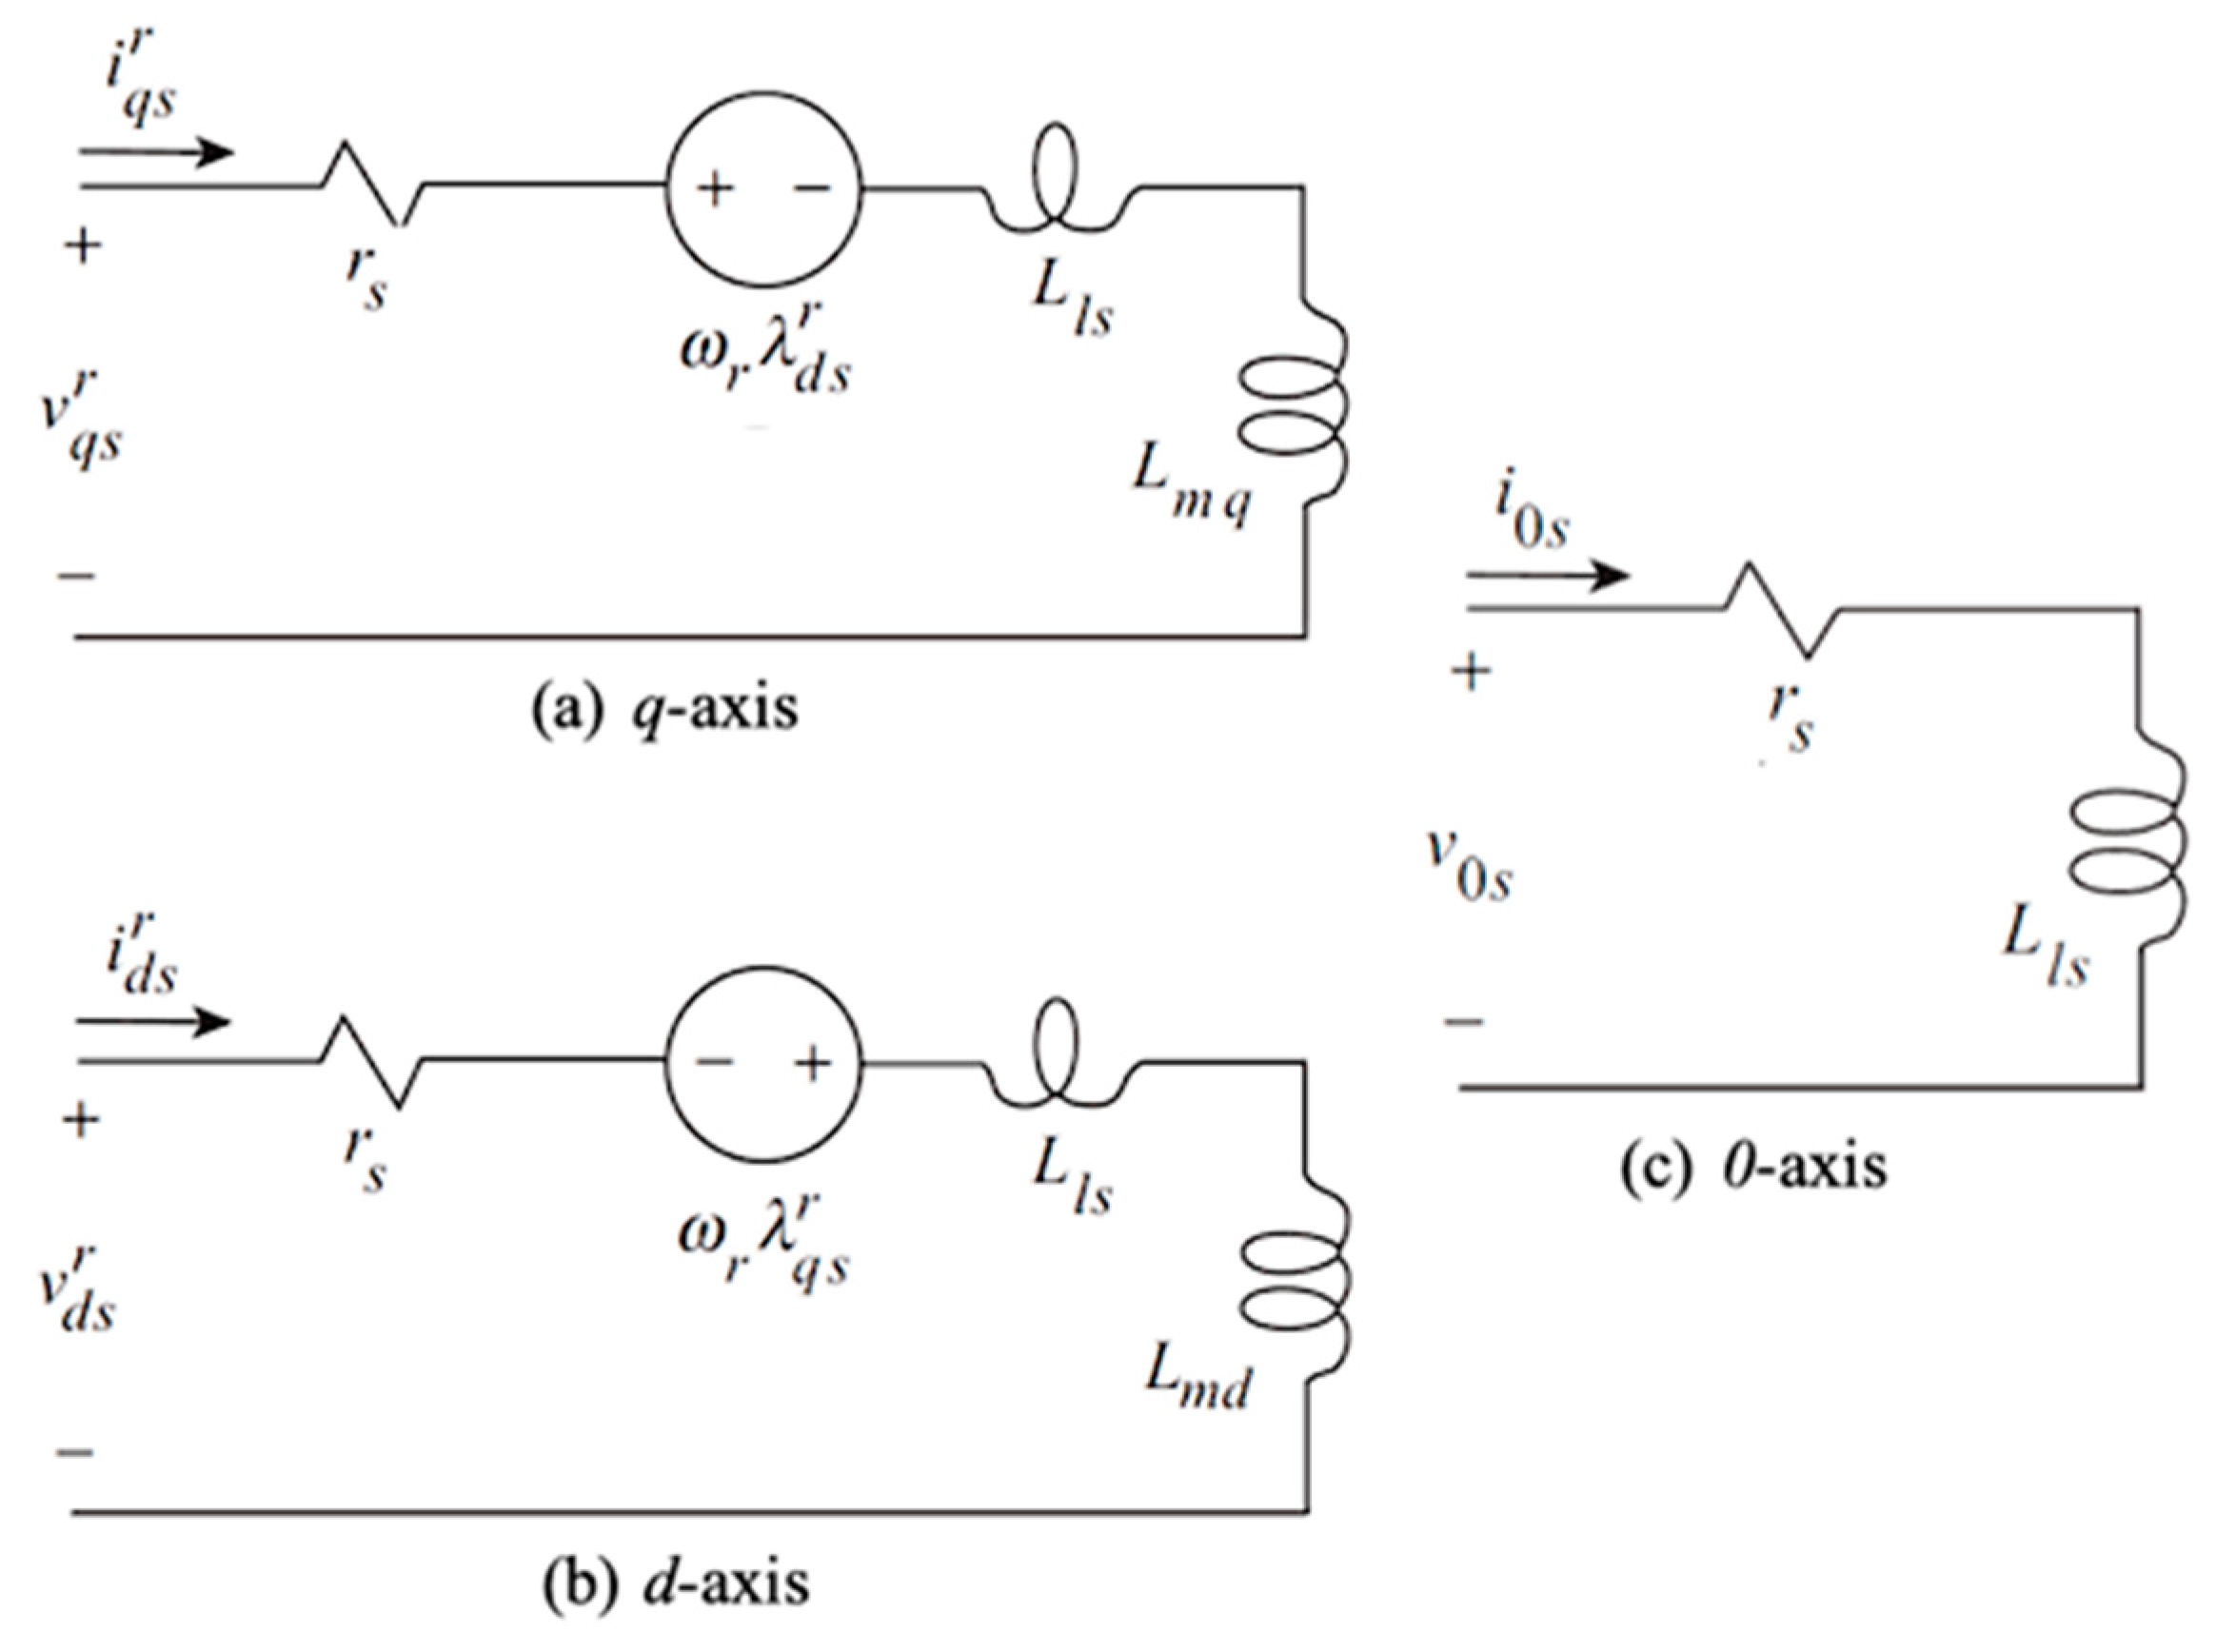
In the case of the generator model, Figure 3 shows the equivalent circuits of a PMSG [38]. From this figure, the voltage equations in the dq0 synchronous reference frame can be obtained as follows [38,39,40]:
where v is the voltage, i is the current, r is the resistance, L is the inductance, and w is the angular frequency. The subscripts d, q, 0, and s denote variables and parameters associated with the d axis, q axis, 0 axis, and stator, respectively, while the superscript r stands for variables in the synchronous reference frame.
3. Converters and Control Strategies
There are three power electronics converters considered in the test system, and each one has an individual control strategy. In the case of the DC–DC converters, the control strategies are focused on maintaining the operation of the photovoltaic and wind generation systems most efficiently under dynamic weather conditions, and trying to extract maximum power from the renewable resource (solar irradiation or wind). On the other hand, the DC–AC converter is used to maintain regulated electrical variables (voltages and frequency) within the limits established by the grid at the connection point.
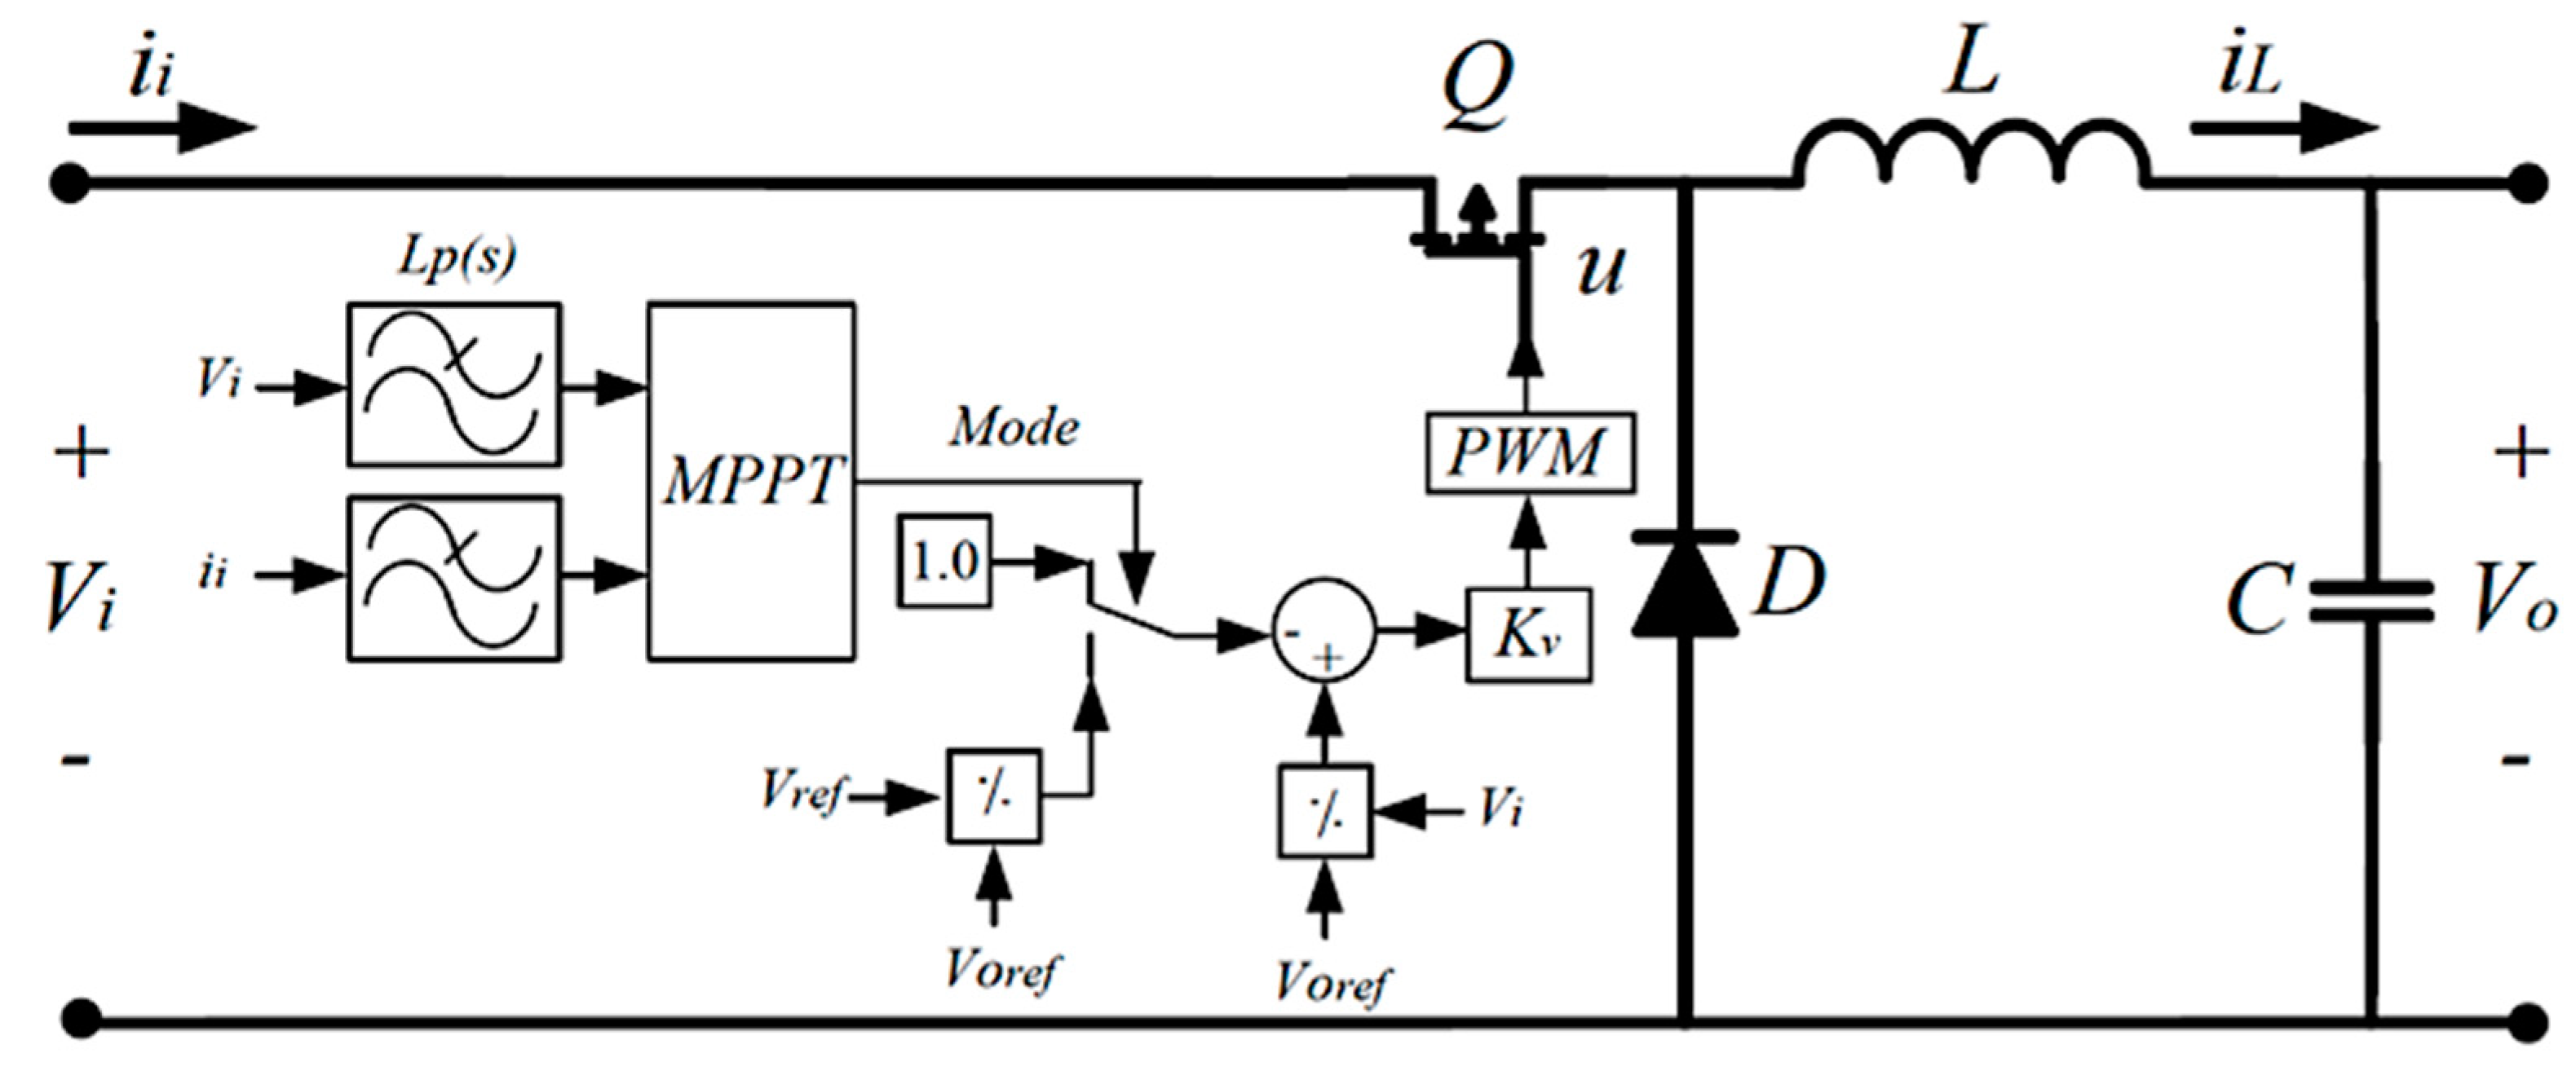
3.1. Buck Converter and Control Strategy for the PV Generation System
To connect the PV generation system with the DC-link voltage, a buck converter is selected [41]. This converter includes an MPPT algorithm [42,43,44], for which the objective is to maintain the voltage (or current) at the terminals of the PV array at a value which allows maximum power extraction from the PV system under changing solar irradiation and temperature conditions. In order to perform MPP tracking, the voltage at the terminals of the PV array is manipulated via the duty cycle of the converter. In Figure 4, the control scheme for the PV array coupled to the buck converter is shown [45].
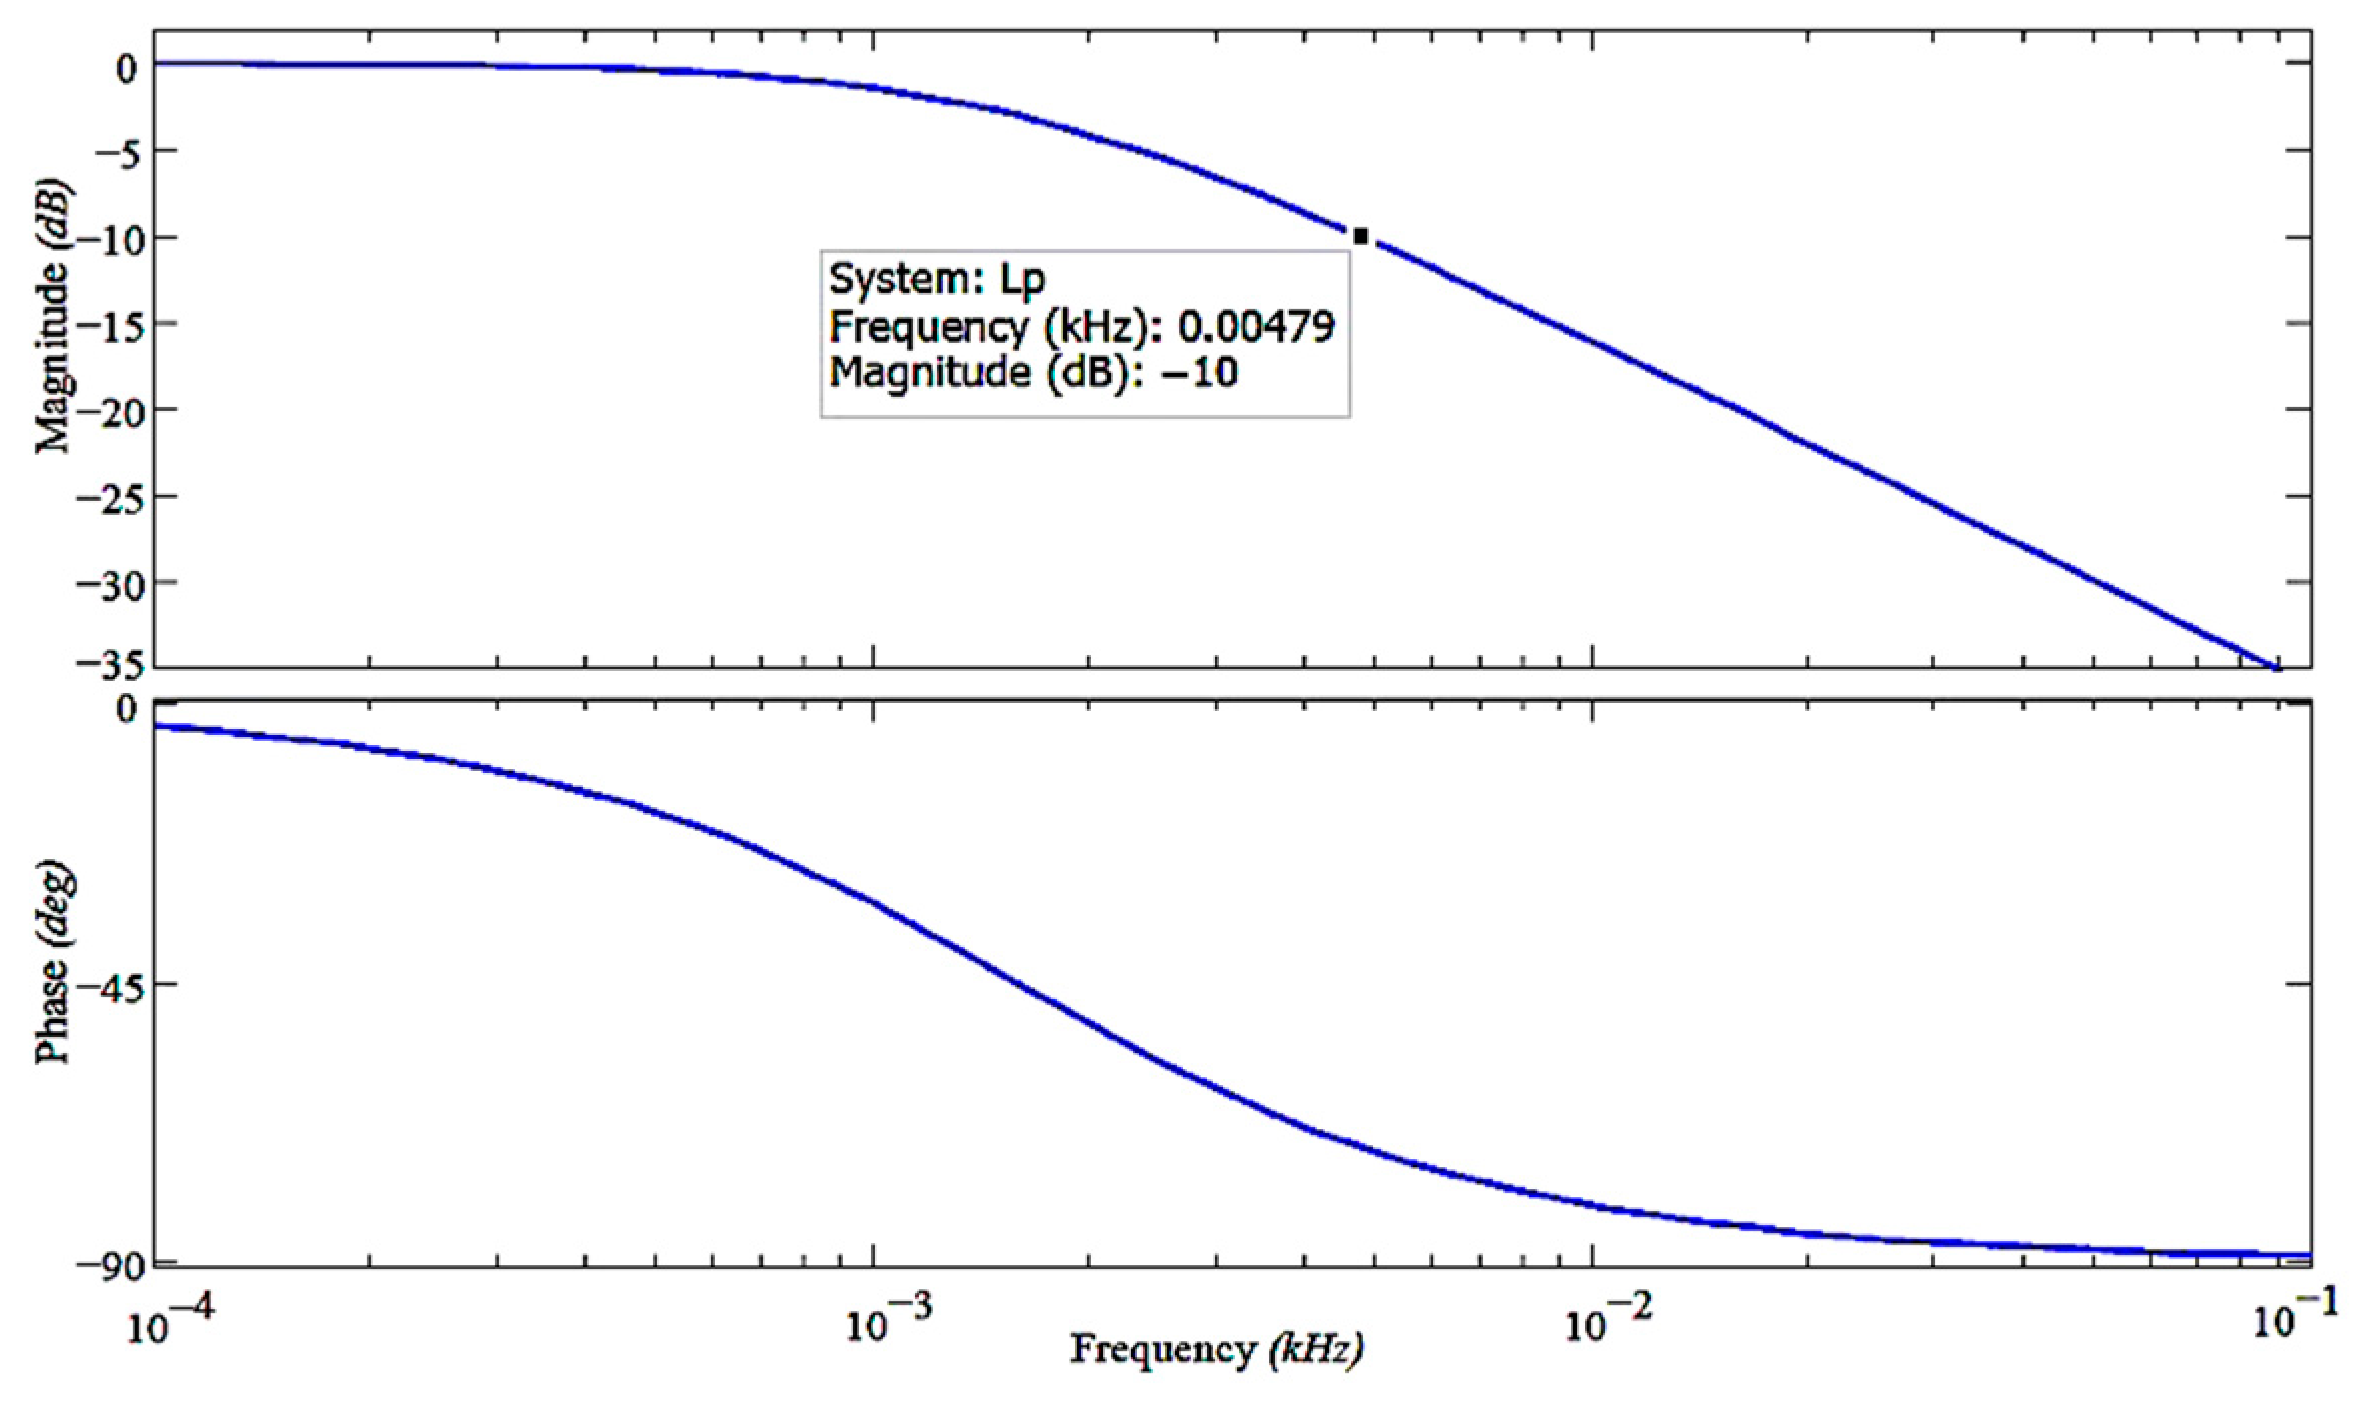
A linearized closed-loop control system was selected for the buck converter. An average state-space analysis was performed to select a PI control law, eliminating high frequency noise, acting as a low-pass filter, and eliminating the steady state error. The transfer function of the low-pass filter Lp(s) included in the converter, with a cut frequency of Fc = 4.79 Hz, is:
and its obtained Bode plot is shown in Figure 5.
Additionally, the controller Kv(s) has a transfer function defined as:
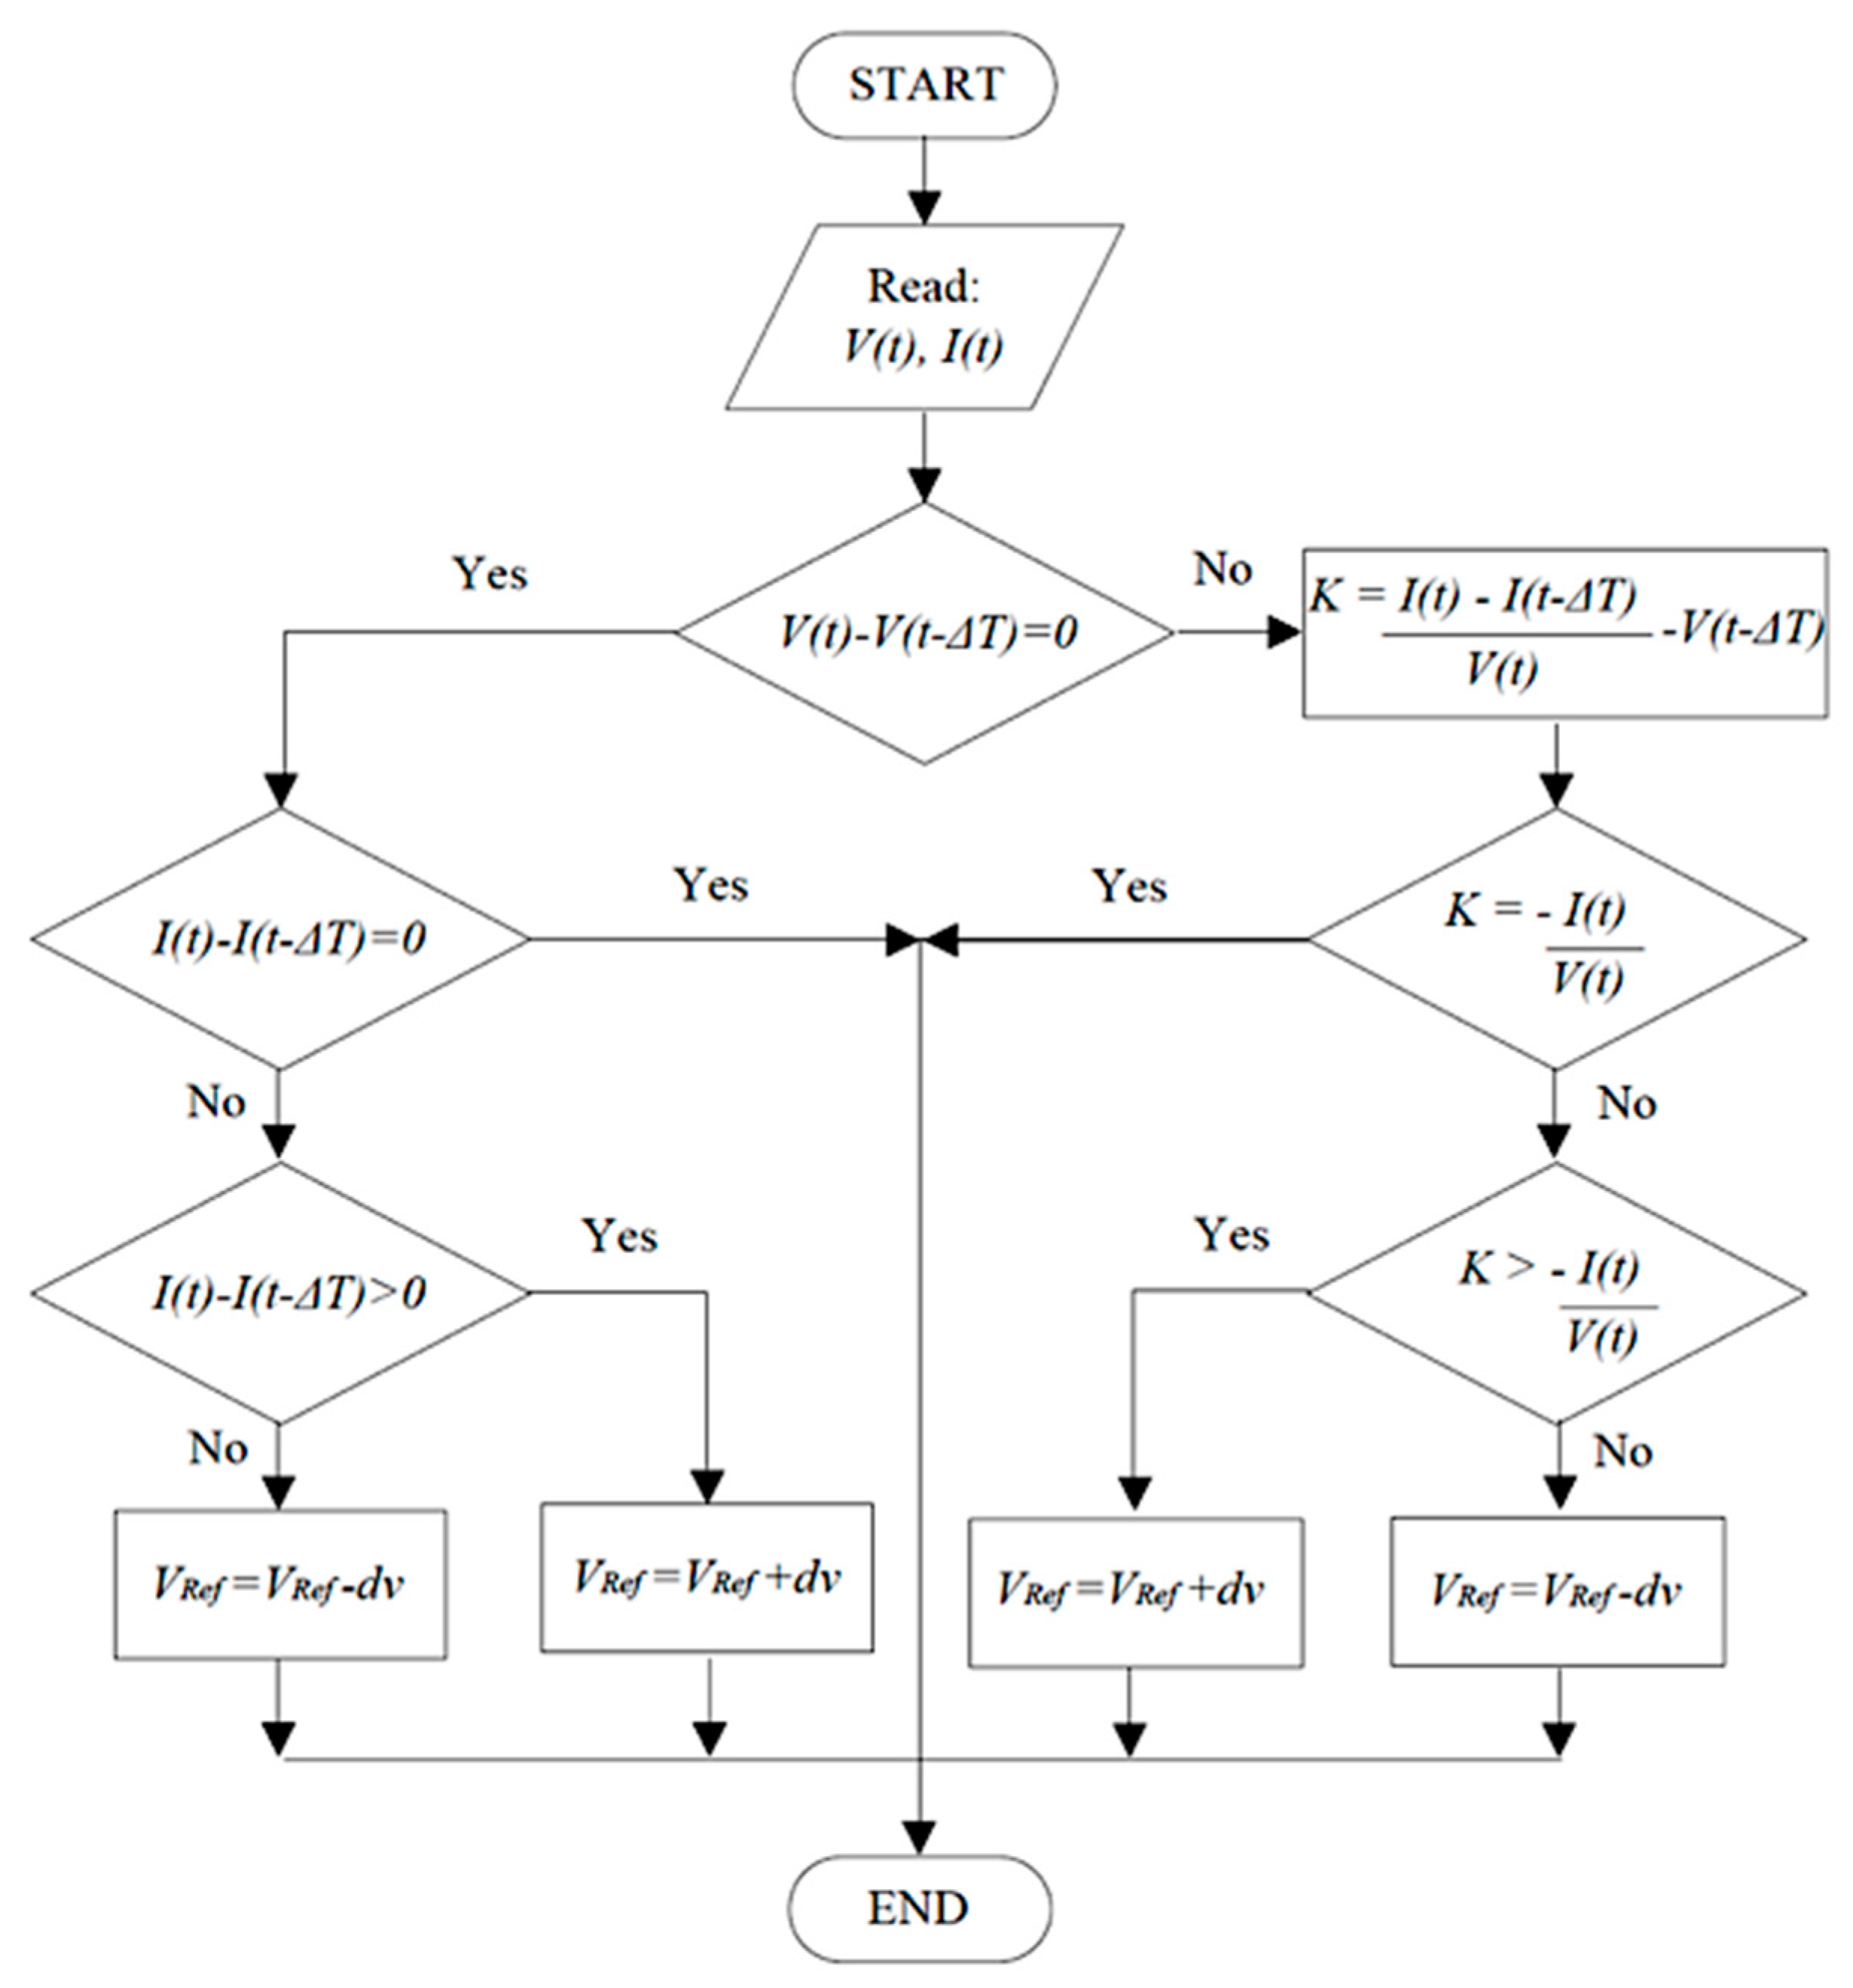
On the other hand, many algorithms have been proposed to achieve the MPP. In this work, the incremental conductance method (ICM), based on the Perturb & Observe algorithm, was applied [46,47], because it can be used in real-time simulations and offers good performance. Figure 6 shows the flowchart of the ICM, in which a fixed-step size is used to change the PV output voltage; this is in order to track the MPP according to the slope of the power relative to the voltage in the characteristic curves of the PV modules.
3.2. Boost Converter and Control Strategy for the Wind Generation System
Figure 7 shows that the three-phase AC voltage generated by the PMSG is converted to DC through a three-phase diode rectifier, and then a boost converter is used to step up the voltage to the DC-link level (VOref) [45,48]. The pulse train for the main switch u is obtained using a pulse width modulation (PWM) technique [49].
For the boost converter, an average current control scheme was used. Operation of the converter as a voltage regulator with power factor correction requires two control loops; one is responsible for regulating the input current iL, and the other the output voltage Vo, as shown in Figure 7. The control loops are designed according to the criterion that the bandwidth of the external voltage control loop is smaller than the internal loop of current; this makes design of the controllers easier.
The controller proposed for the current control loop KiL has the form:
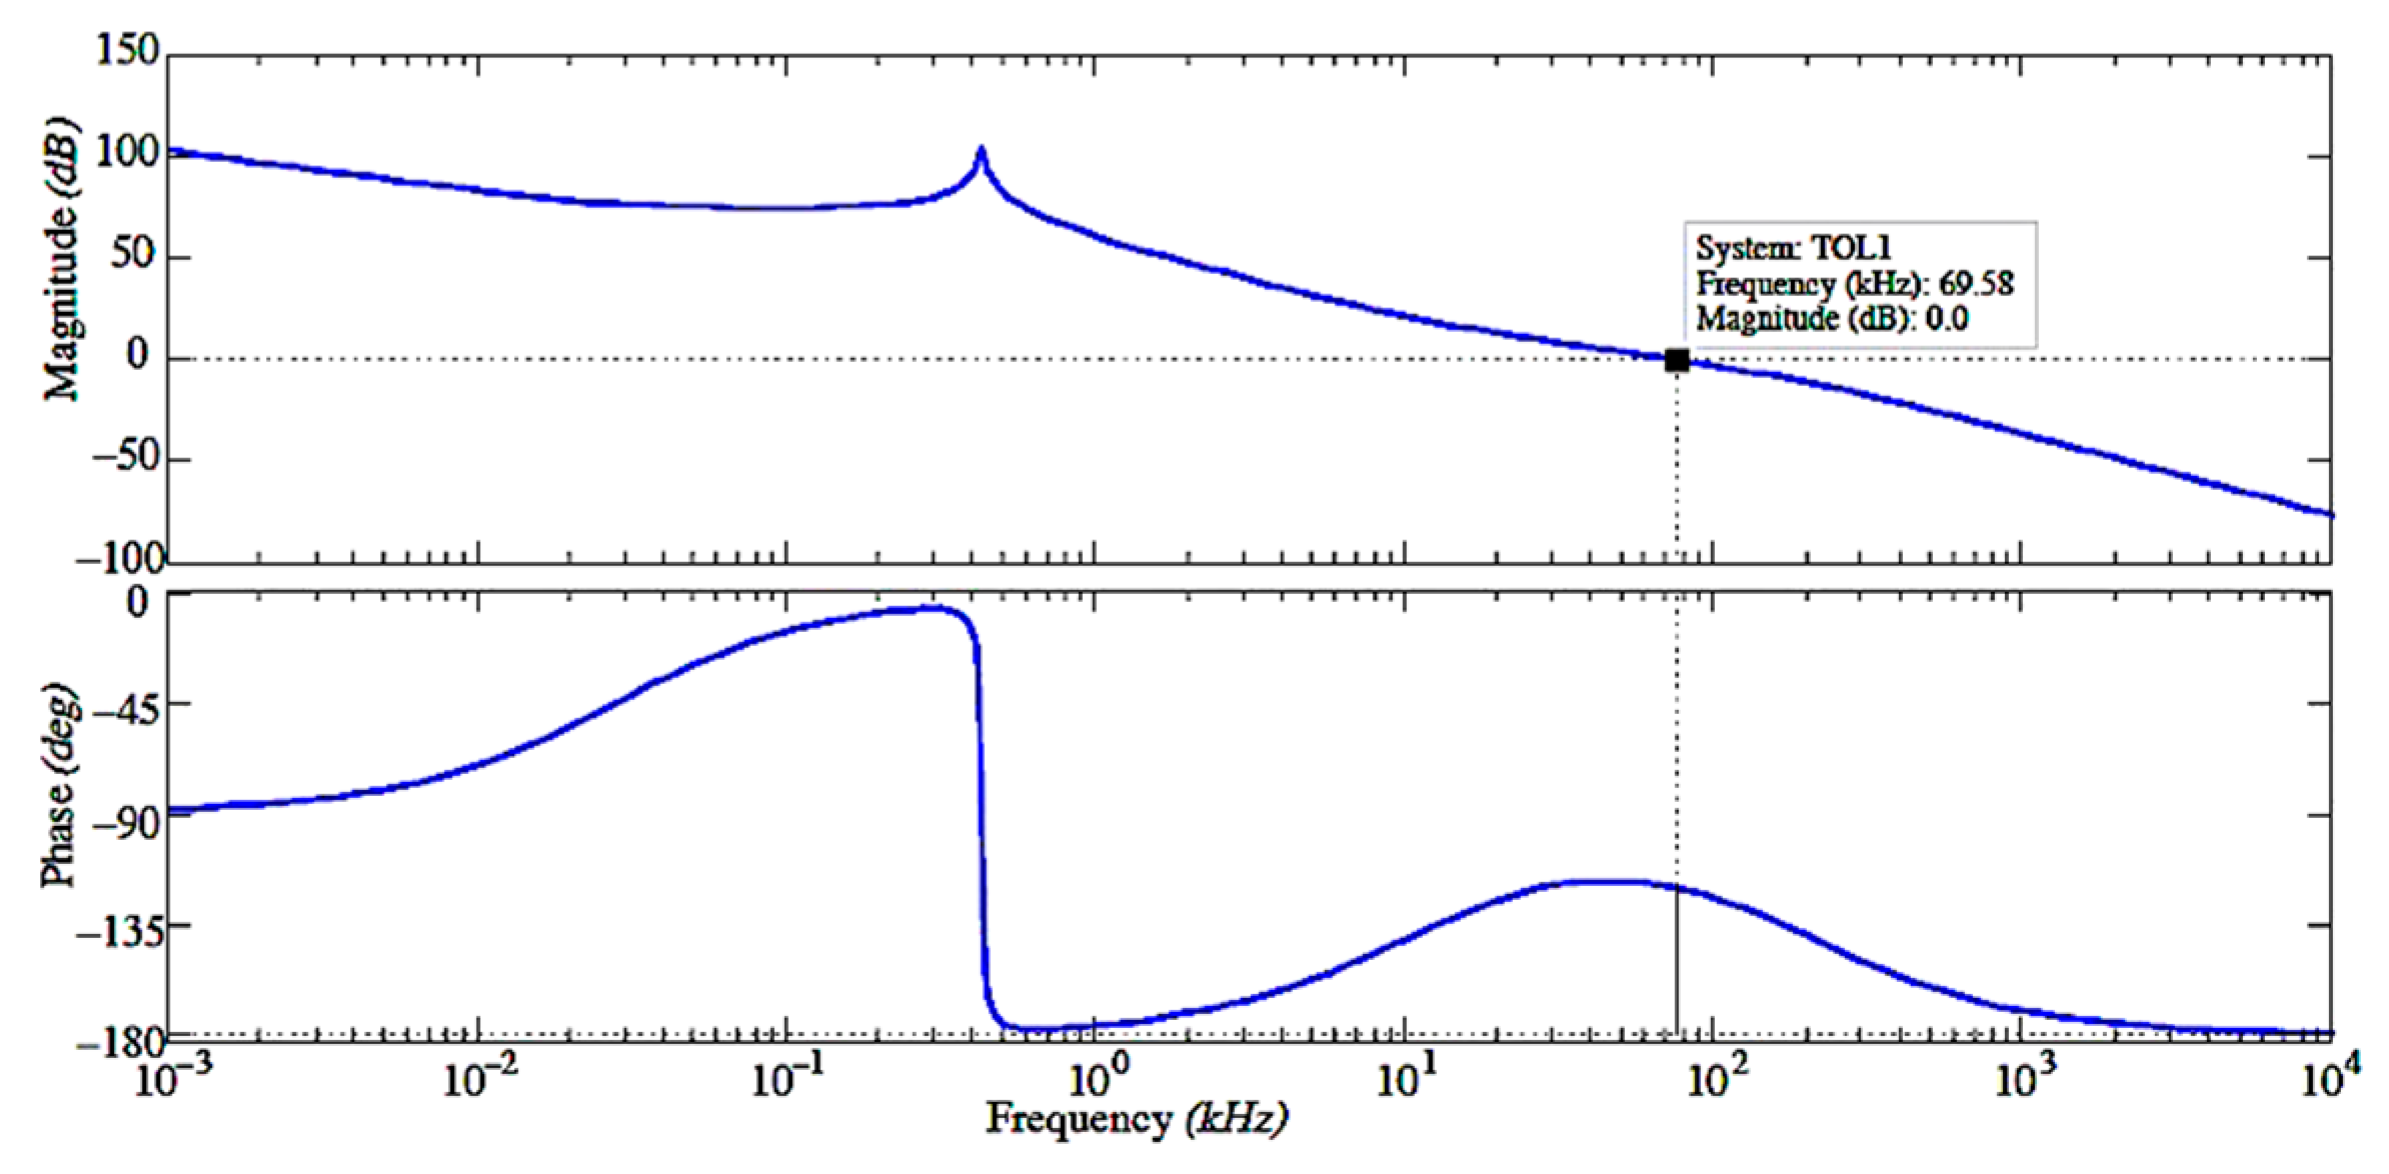
Figure 8 illustrates the controller Bode plot and the proposed phase margin, showing an increase of the low frequency loop gain.
The transfer function of the voltage control law KVo is defined as follows:
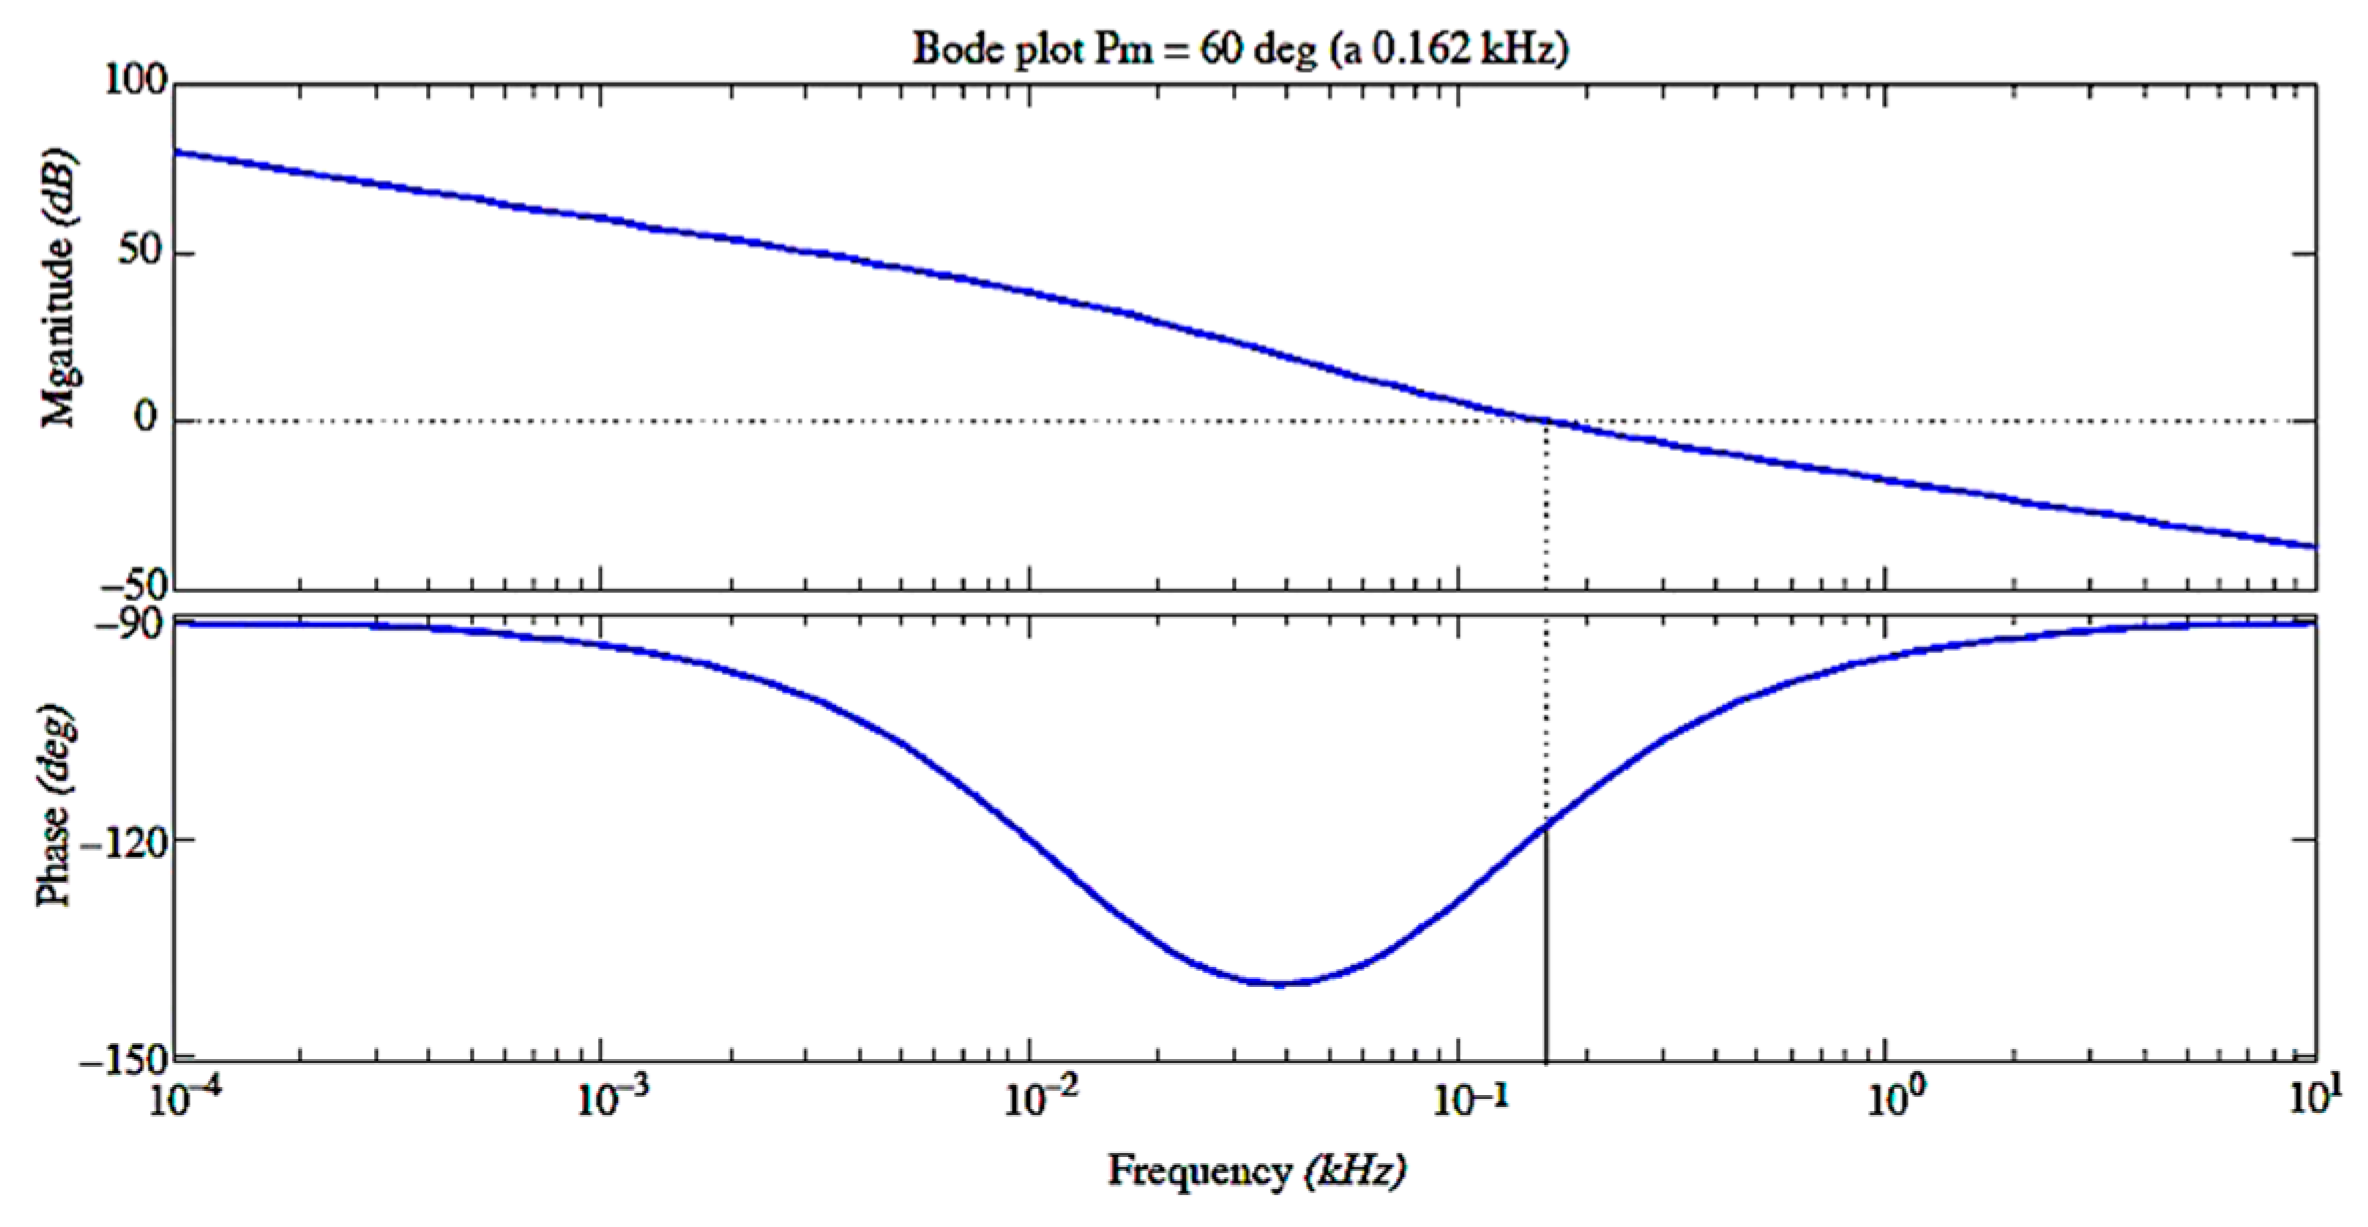
The Bode plot for this controller is shown in Figure 9. The controller is designed to increase the low frequency gain, while the phase margin is 60° at the cut-off frequency of 0.162 kHz.
3.3. Three-Phase Inverter and P–Q Controller
For the three-phase inverter, a P–Q control law is proposed, for which the objectives are to maintain the DC-link voltage at a constant value, and to set the amount of reactive power injected to the grid [50,51]. In normal operating conditions, all the power generation injected to the grid from the hybrid PV–wind system is active power, and the reactive power reference is set to zero. Nevertheless, under fault conditions in the grid, the reactive power reference can be set to another value for voltage support [52].
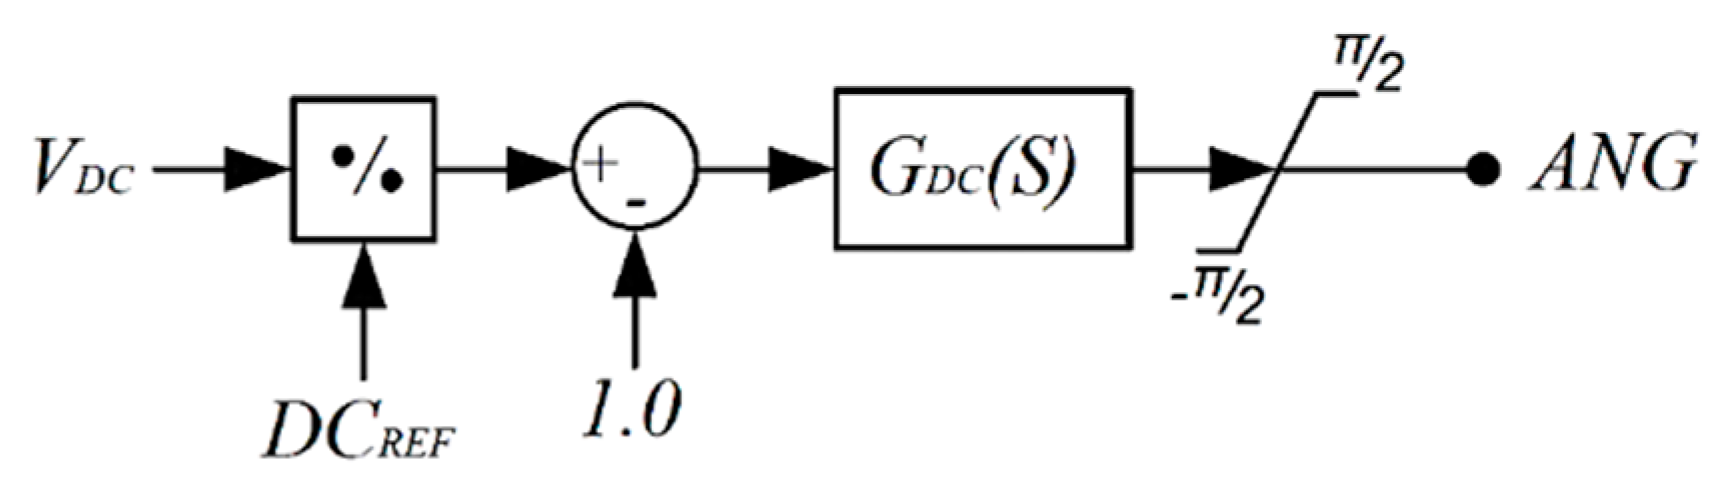
Figure 10 shows the DC-link voltage control loop for the three-phase inverter. At the output, an angle value is obtained (ANG) and saturated in the range of [−π/2,π/2]. This angle is sent to the modulation signal generator. The transfer function of GDC is:
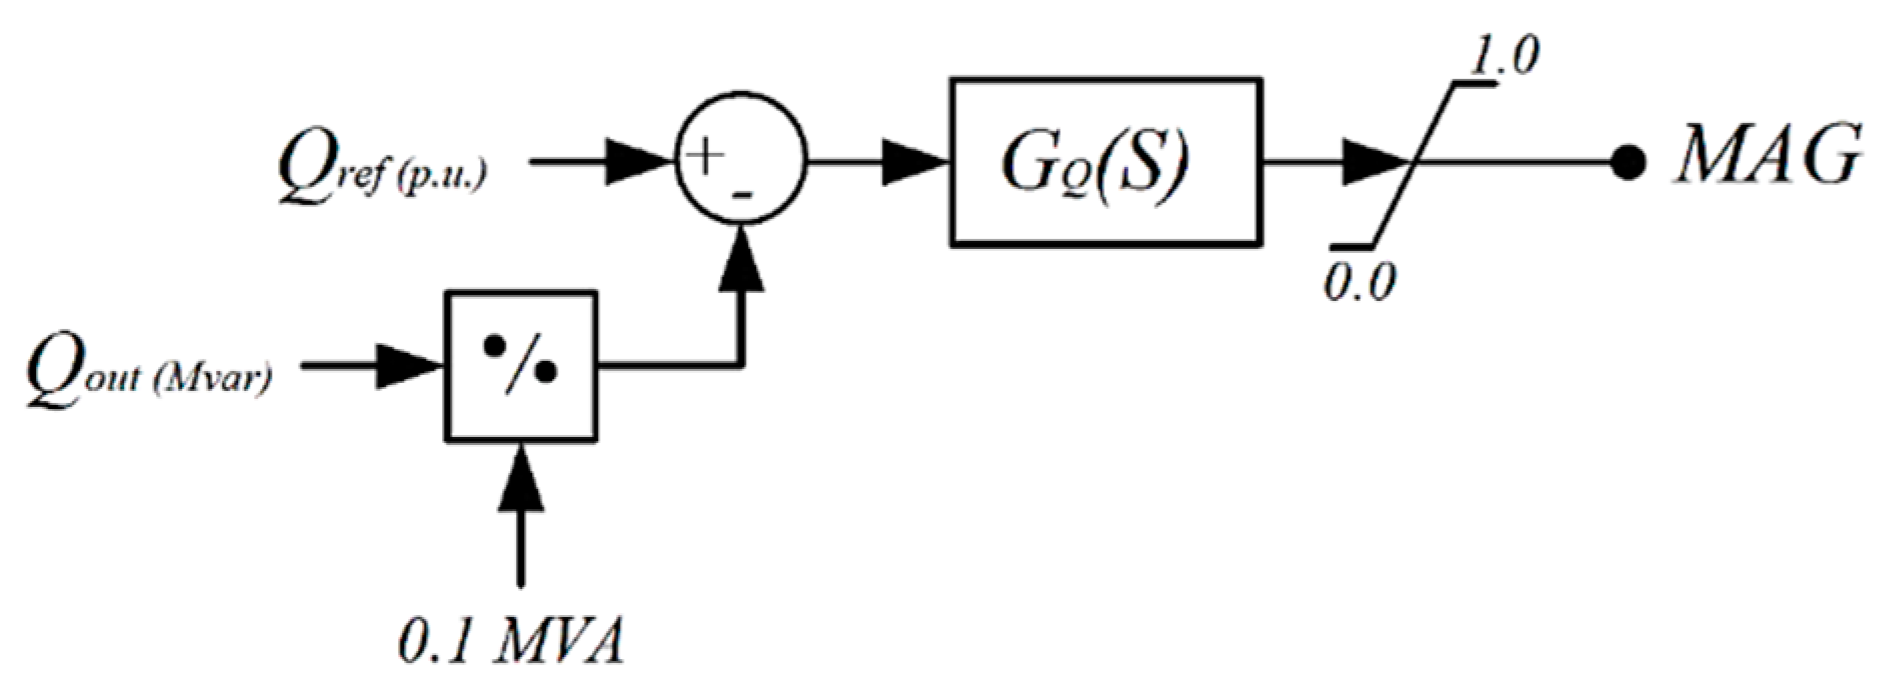
Figure 11 shows the reactive power control loop for the three-phase inverter. The magnitude value MAG is obtained using a PI control. This value is then saturated within the range of [0,1], and finally it is sent to the modulation signal generator. The PI control is defined as:
The control signals ANG and MAG are sent to the PWM module in order to obtain the pulse trains for the three-phase inverter.
4. Hardware Implementation
In this section, the considerations for the control law implementation in the Arduino Due [53] and its connection with the RTDS [54] are described.
4.1. Digital Implementation of Control Laws
To digitally implement the controllers, which are designed in the continuous domain, it is necessary to sample the error signal of each one of the control loops through an analog-to-digital converter (ADC). The selected microcontroller interprets the converted signal as a sequence of numbers, which are processed using a control algorithm, generating a new numerical sequence. This process is done through a digital-to-analog converter (DAC); the numerical sequence is transformed into an analog signal, which becomes the control signal.
In order to obtain the digital control algorithm, the Z transform [55] is required to relate the discrete time domain with the complex frequency domain, the reference frame in which the controllers were originally designed.
4.2. DC–DC Buck Digital Controller Implementation
By applying the Z transform to the buck converter control transfer function described by Equation (17) with a sampling period of TS = 20 μS, the following expression is obtained:
From Equation (22) it is possible to obtain the difference equation for the controller Imbuck[k], as described by Equation (23), which is programmed at the digital device, where e[k] is the error of the actual sample time and e[k − 1] represents the error in the previous sample time.
4.3. DC–DC Boost Digital Controller Implementation
The boost controller is formed by two parts, a voltage controller KVo(s) described by Equation (19), and a current controller KiL(s) defined by Equation (18). Applying the Z transform to KVo(s) with a sample time of TS = 20 μS, the next expression is obtained:
moreover, the difference equation v[k] obtained and implemented in the Arduino Due is:
Similarly, for the second part of the current controller the following expressions are obtained:
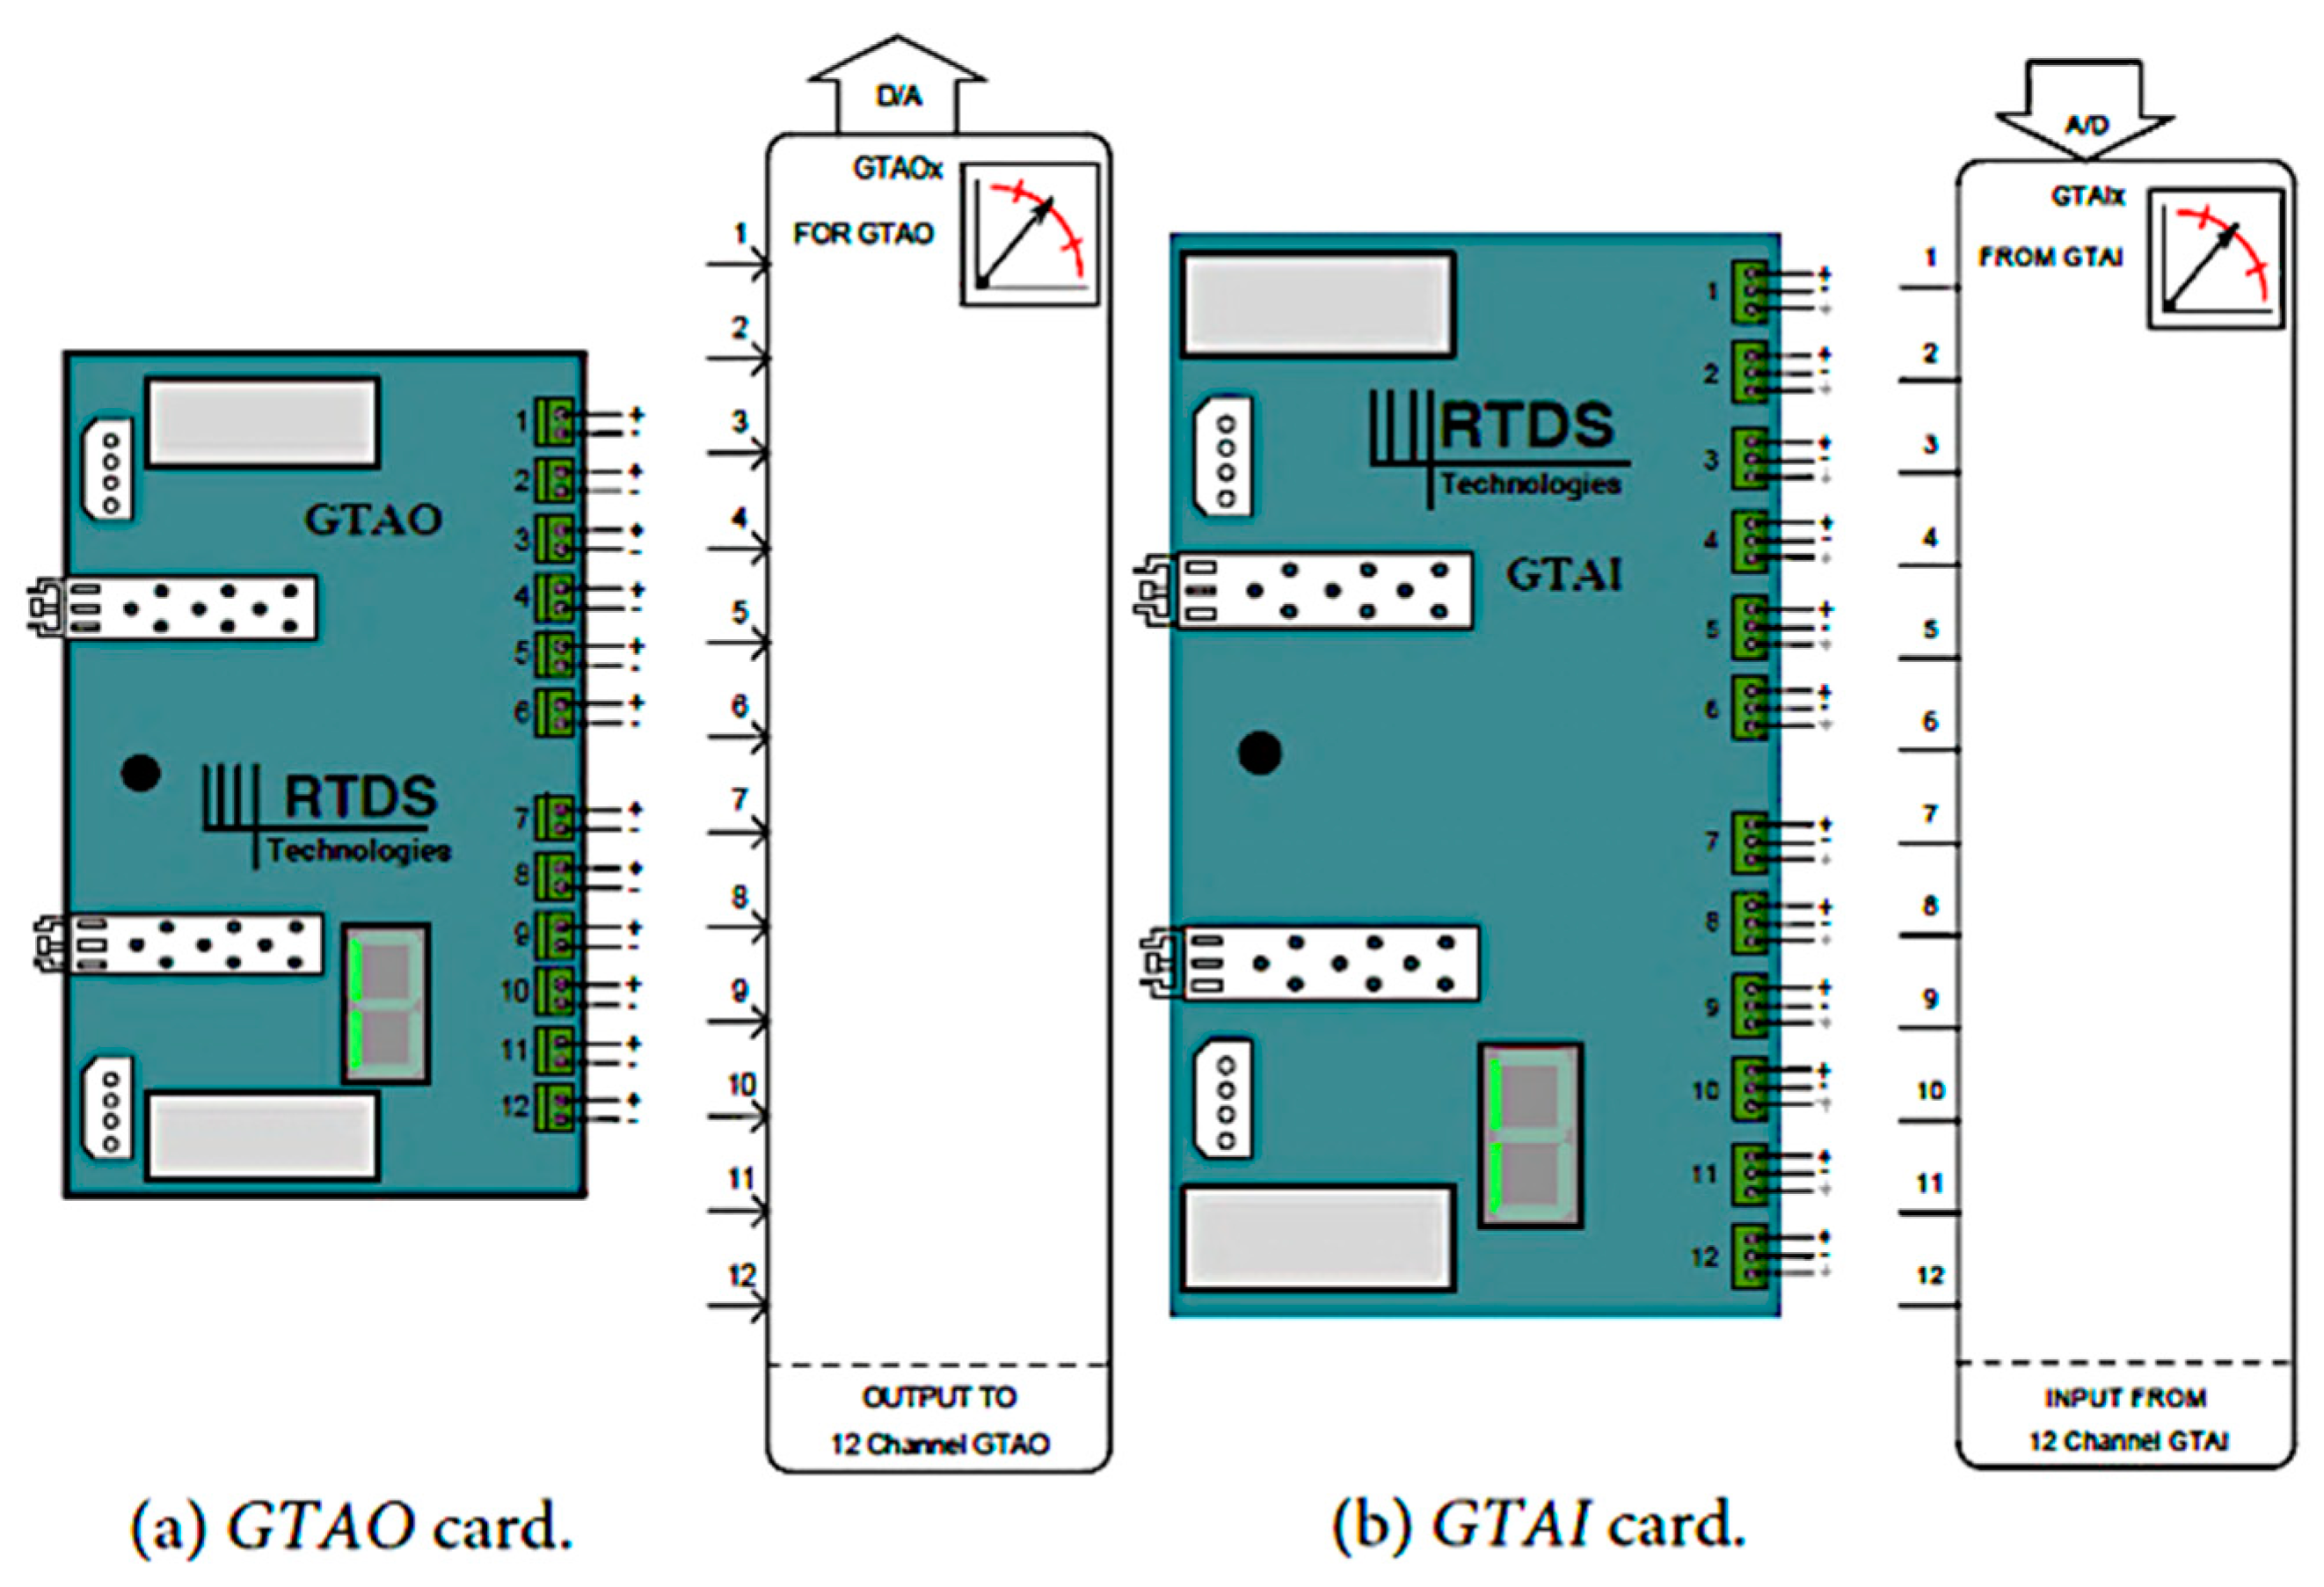
4.4. RTDS Giga-Transceiver Analogue Input/Output Cards (GTAI/GTAO)
The Giga-Transceiver Analogue Output card (GTAO) is used as the interface between the RTDS and external devices. The GTAO card includes 12 output channels of 16 bits each, and a voltage range of ±10 V. The Giga-Transceiver Analogue Input card (GTAI) is also used as the interface between external devices and the RTDS. The GTAI card includes 12 input channels configured as differential inputs with a ±10 V voltage range. Figure 12 shows a general scheme of the GTAO and GTAI cards and their simulation blocks in RSCAD [56].
4.5. Microcontroller Arduino Due
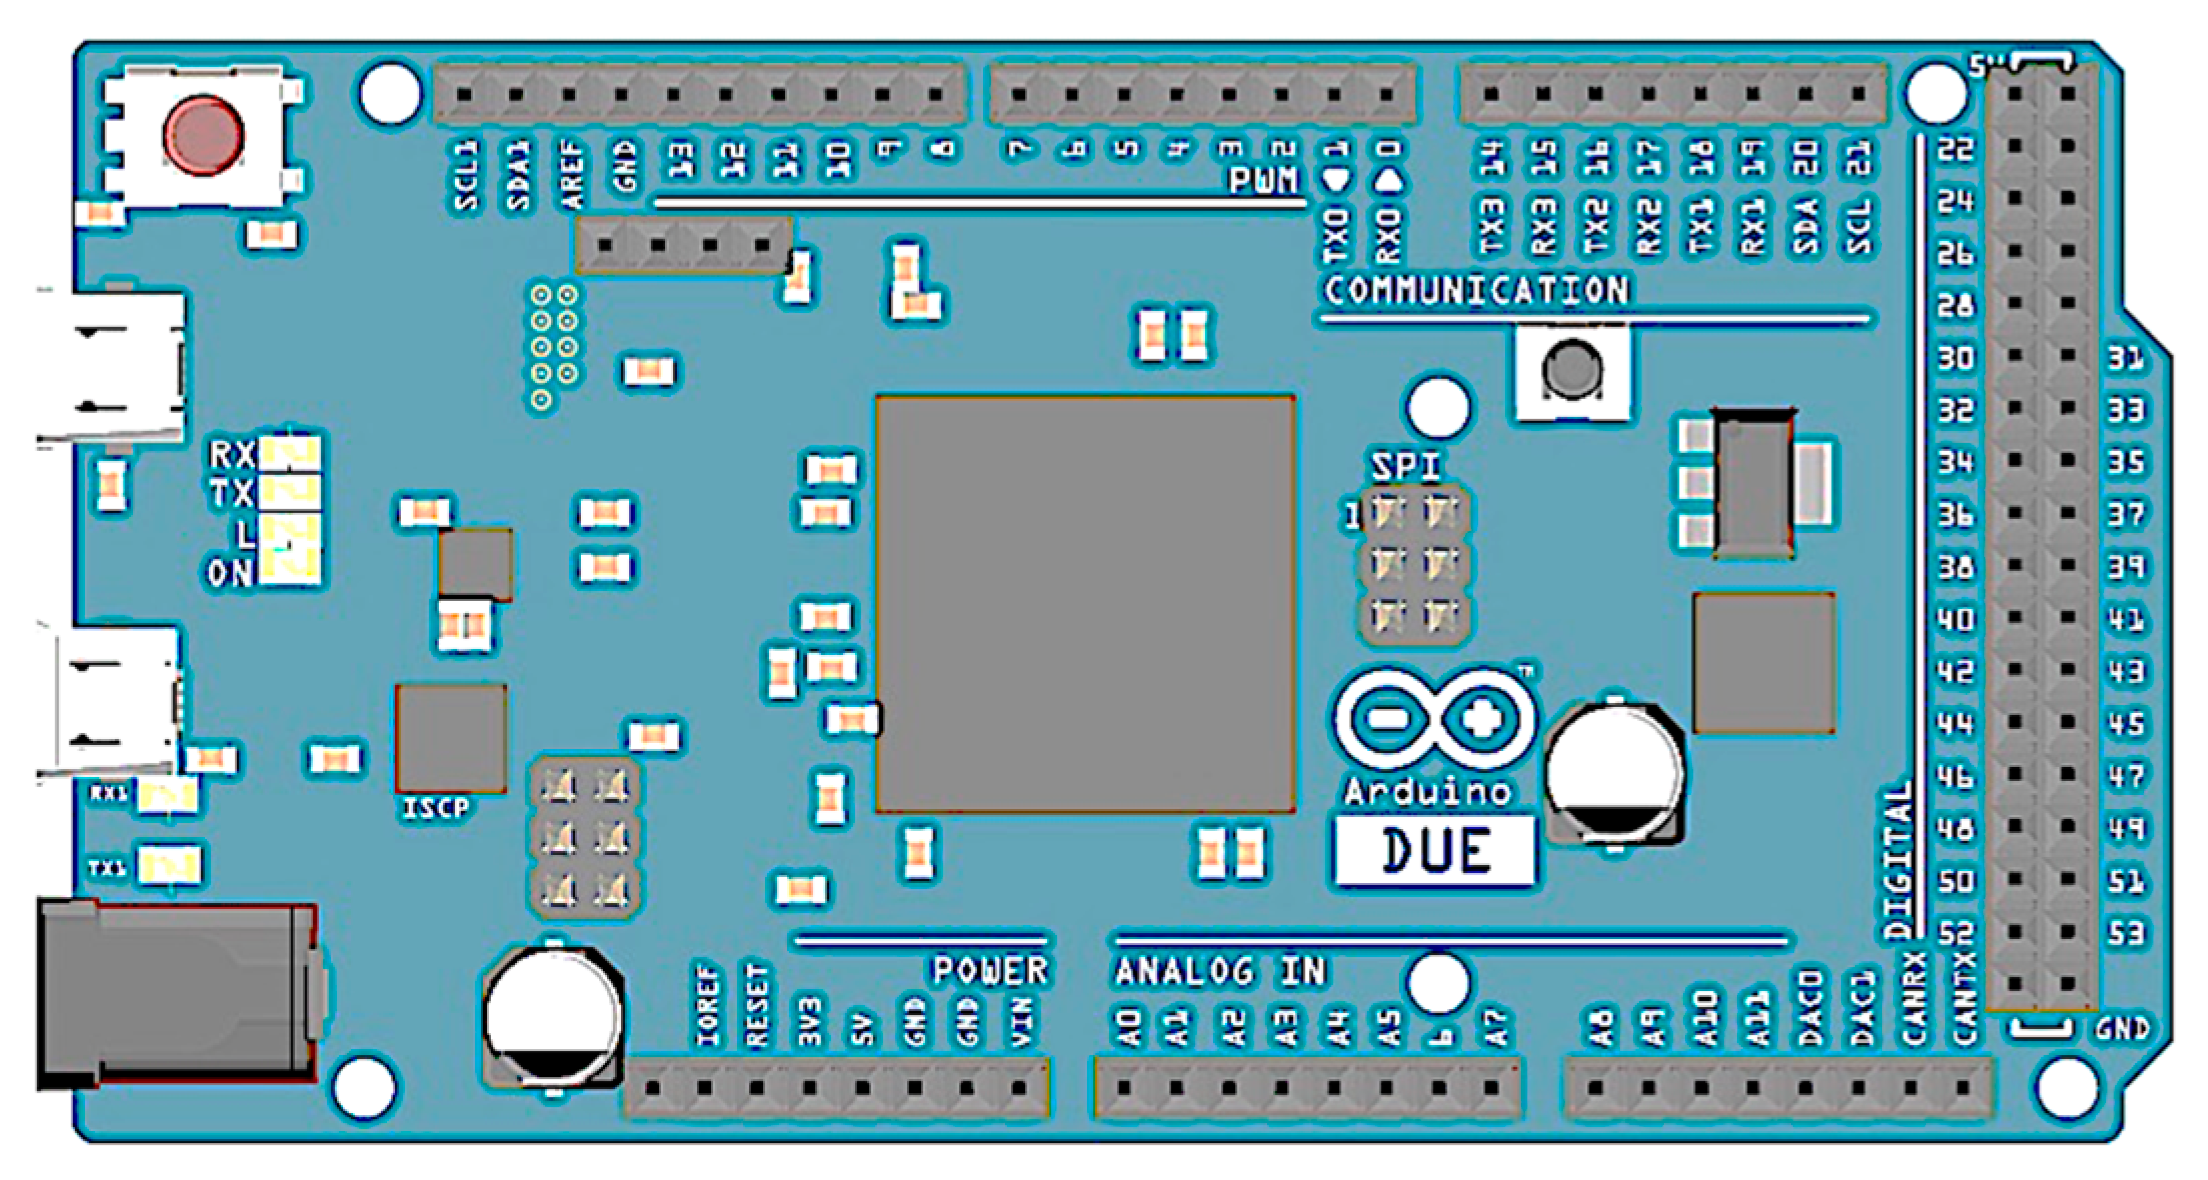
The Arduino Due card is a microcontroller based on the Atmel SAM3X8E ARM Cortex-M3 CPU, and is the first Arduino with a 32 bit core [53]. It has 54 input and output ports, of which 12 can be used as PWM outputs, 12 as analog inputs, 4 as serial ports, an 84 MHz clock, 2 DAC, and a reset and delete button.
The Arduino Due analog input ports have a 10 bit resolution (values between 0–1023), implying that an input voltage of 0 V is reflected in the processor as a value of 0, and an input voltage of 3.3 V is reflected as a value of 1023. On the other hand, the DAC analog outputs have a nominal resolution of 8 bits, with the possibility to work with a resolution of 10 bits. Working with a 10 bit resolution, a value of 0 generates an output voltage of 0.55 V, and a value of 1023 is reflected in an output voltage of 2.77 V. Figure 13 shows the schematic diagram of an Arduino Due card.
4.6. Connection of the Arduino Due Card with the RDTS Station
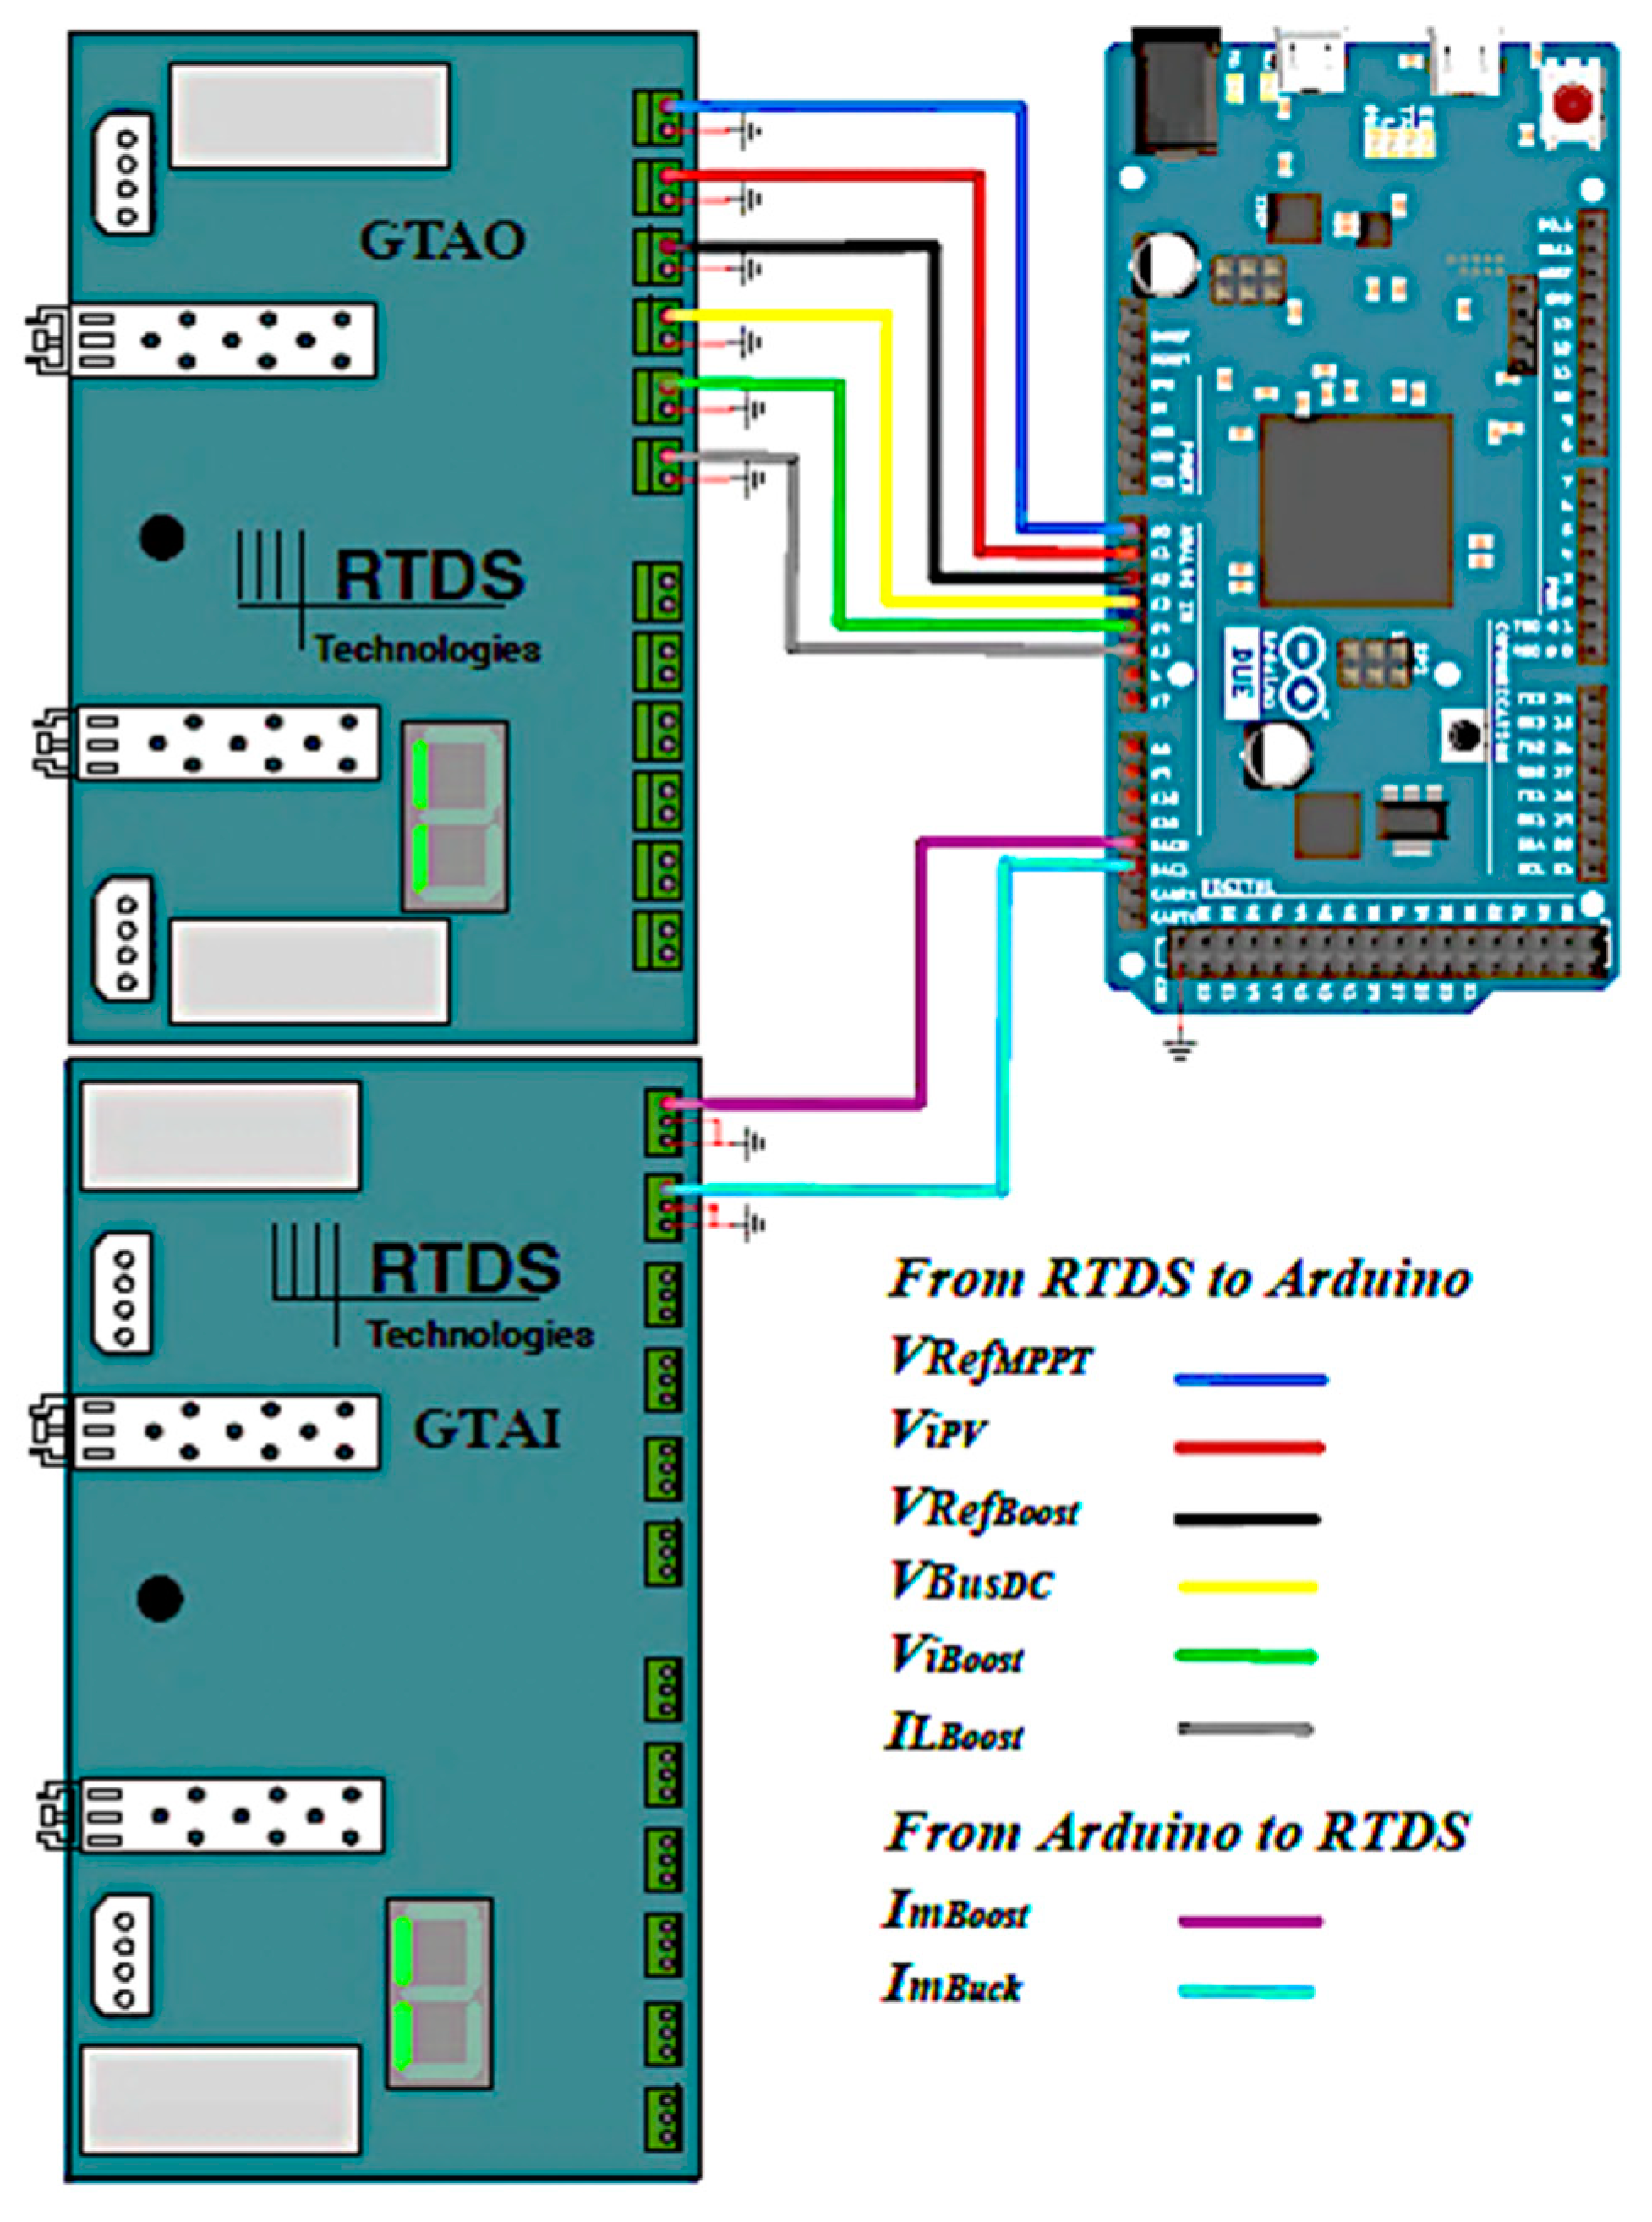
Figure 14 illustrates the connection of the RTDS with the Arduino Due card through the GTAO and GTAI cards and the ADC and DAC ports, respectively. Additionally, this figure shows the signals exchanged between both devices.
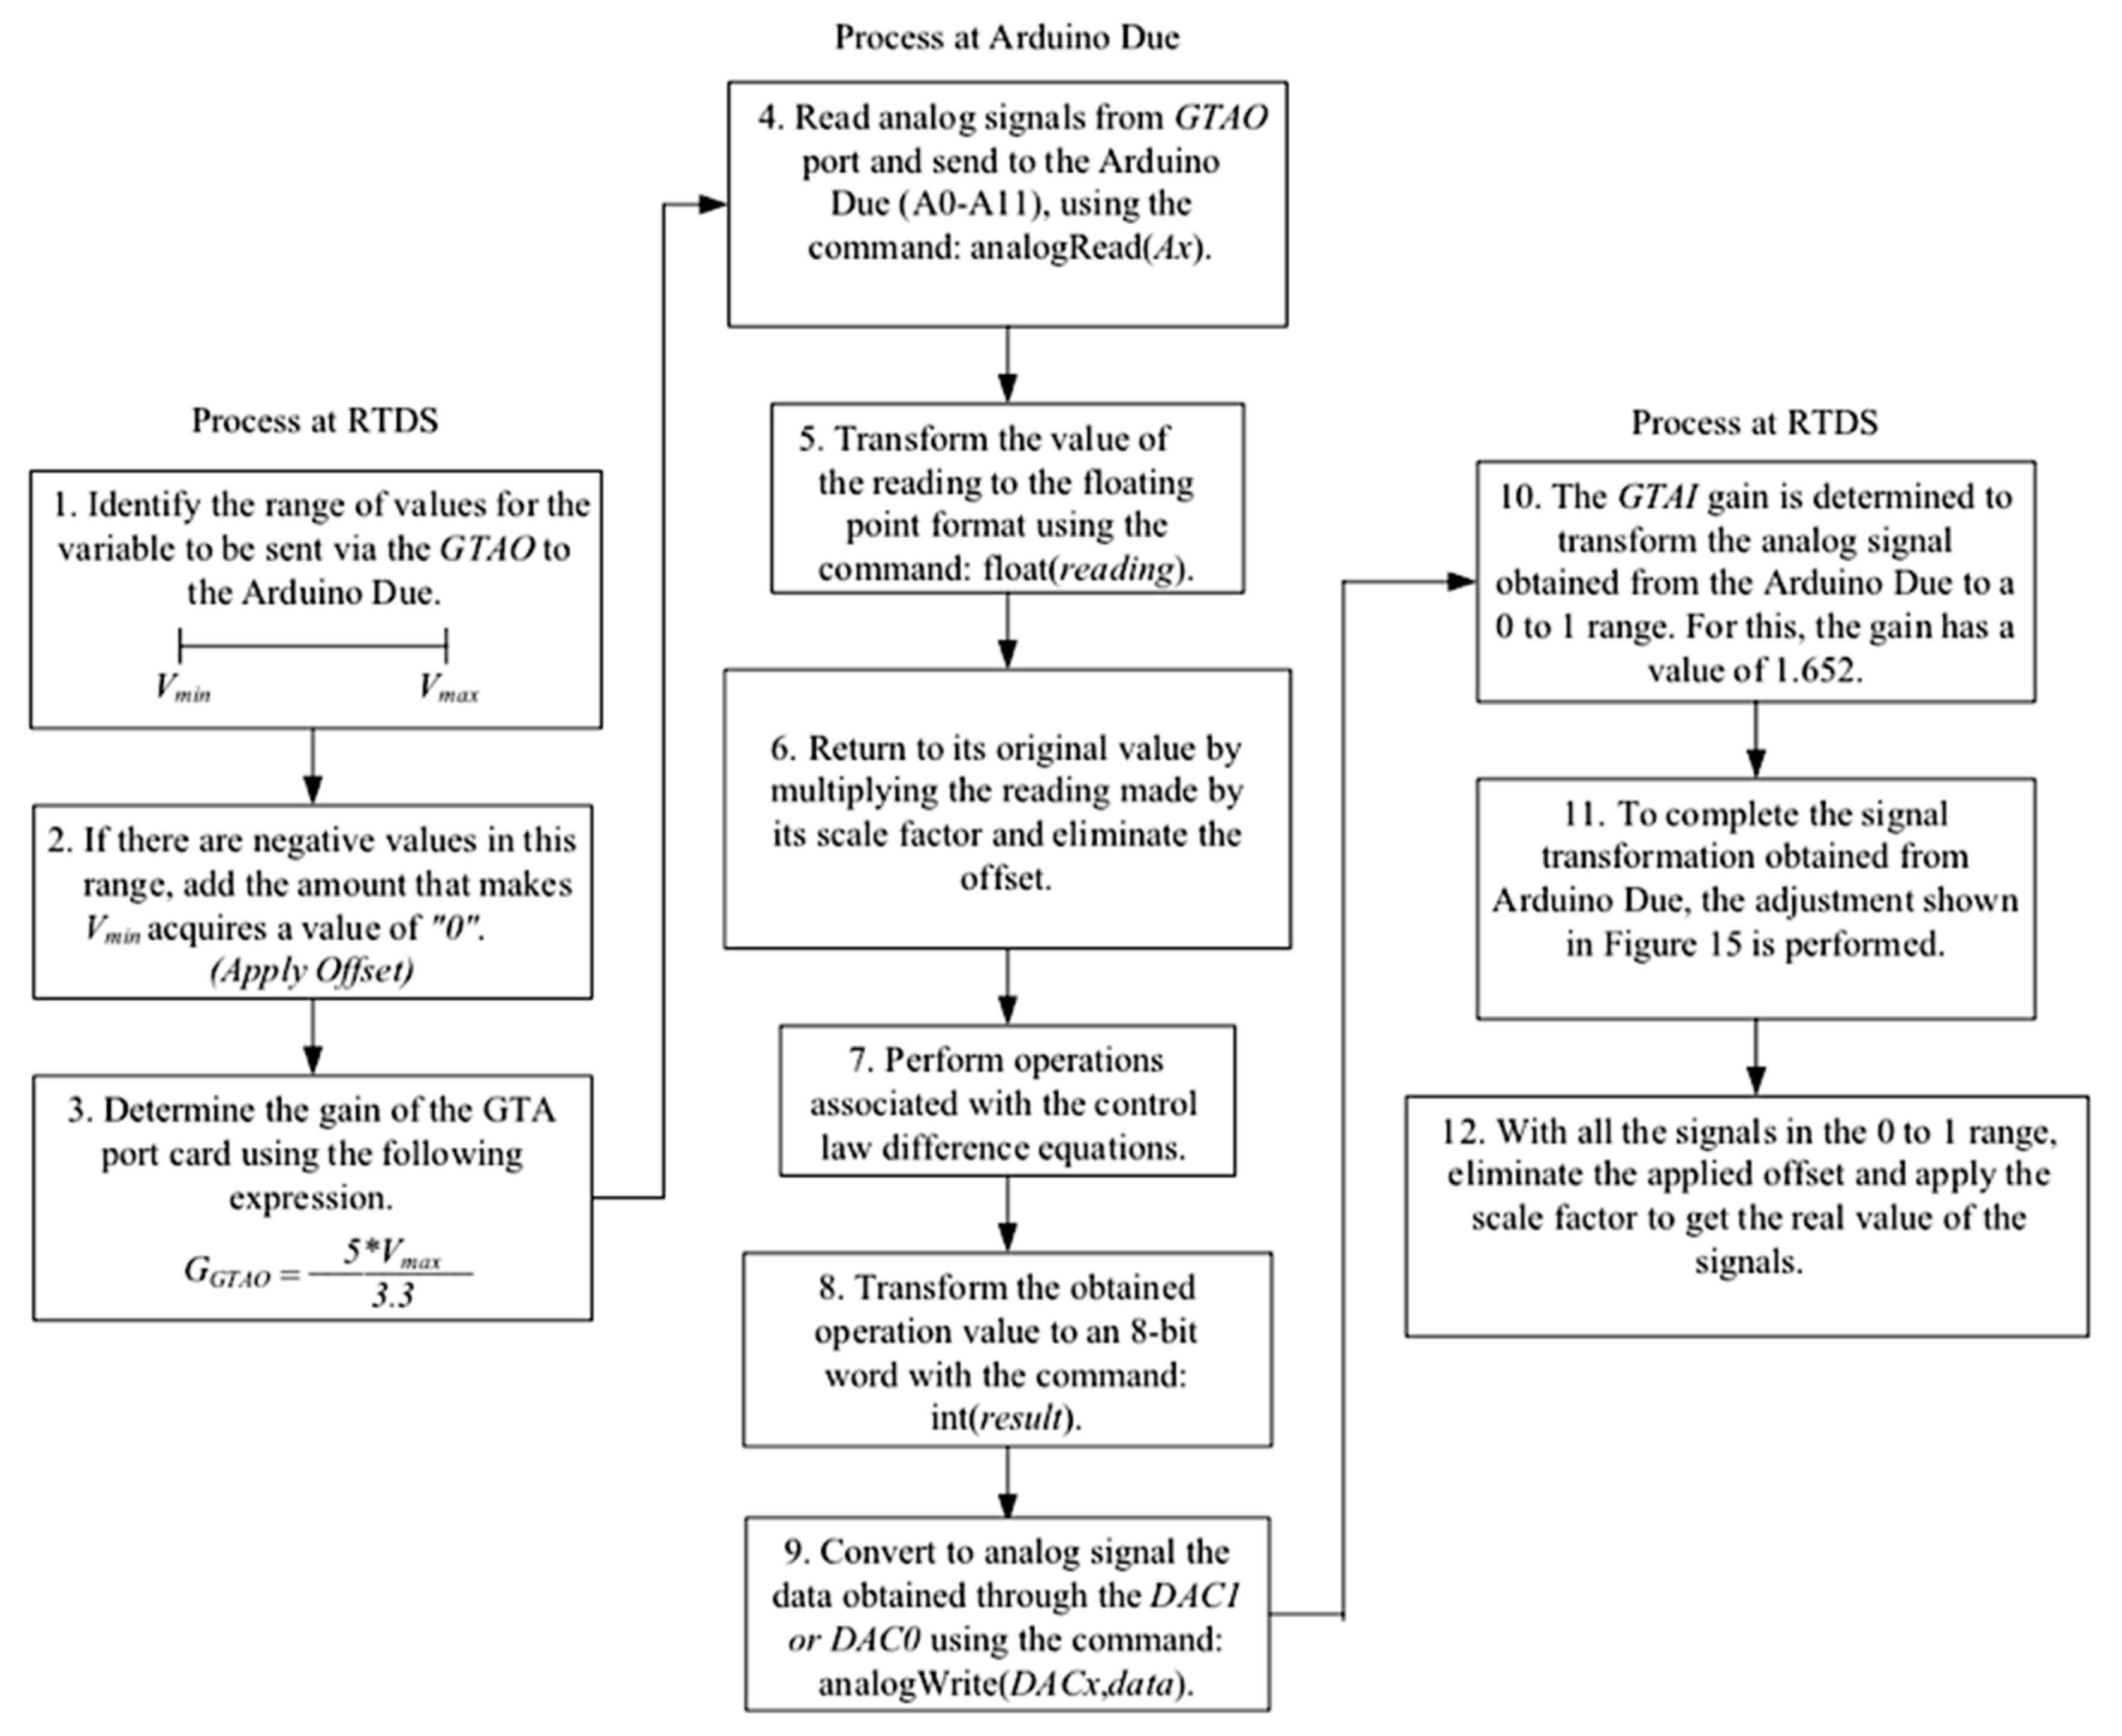
Because the Arduino Due operating voltage is 3.3 V, it is necessary to saturate the analog outputs of the RTDS that can generate up to 10 V in order to avoid damage to the card, and adjust the gain output of the GTAO. It is also necessary to remove the negative signals generated by the RTDS prior to their being sent to the Arduino Due, as this card does not allow negative input voltages. Table 1 shows the range of output values, adjustments, and output factors of the GTAO card to meet with the desired range of voltage between 0 V and 3.3 V.
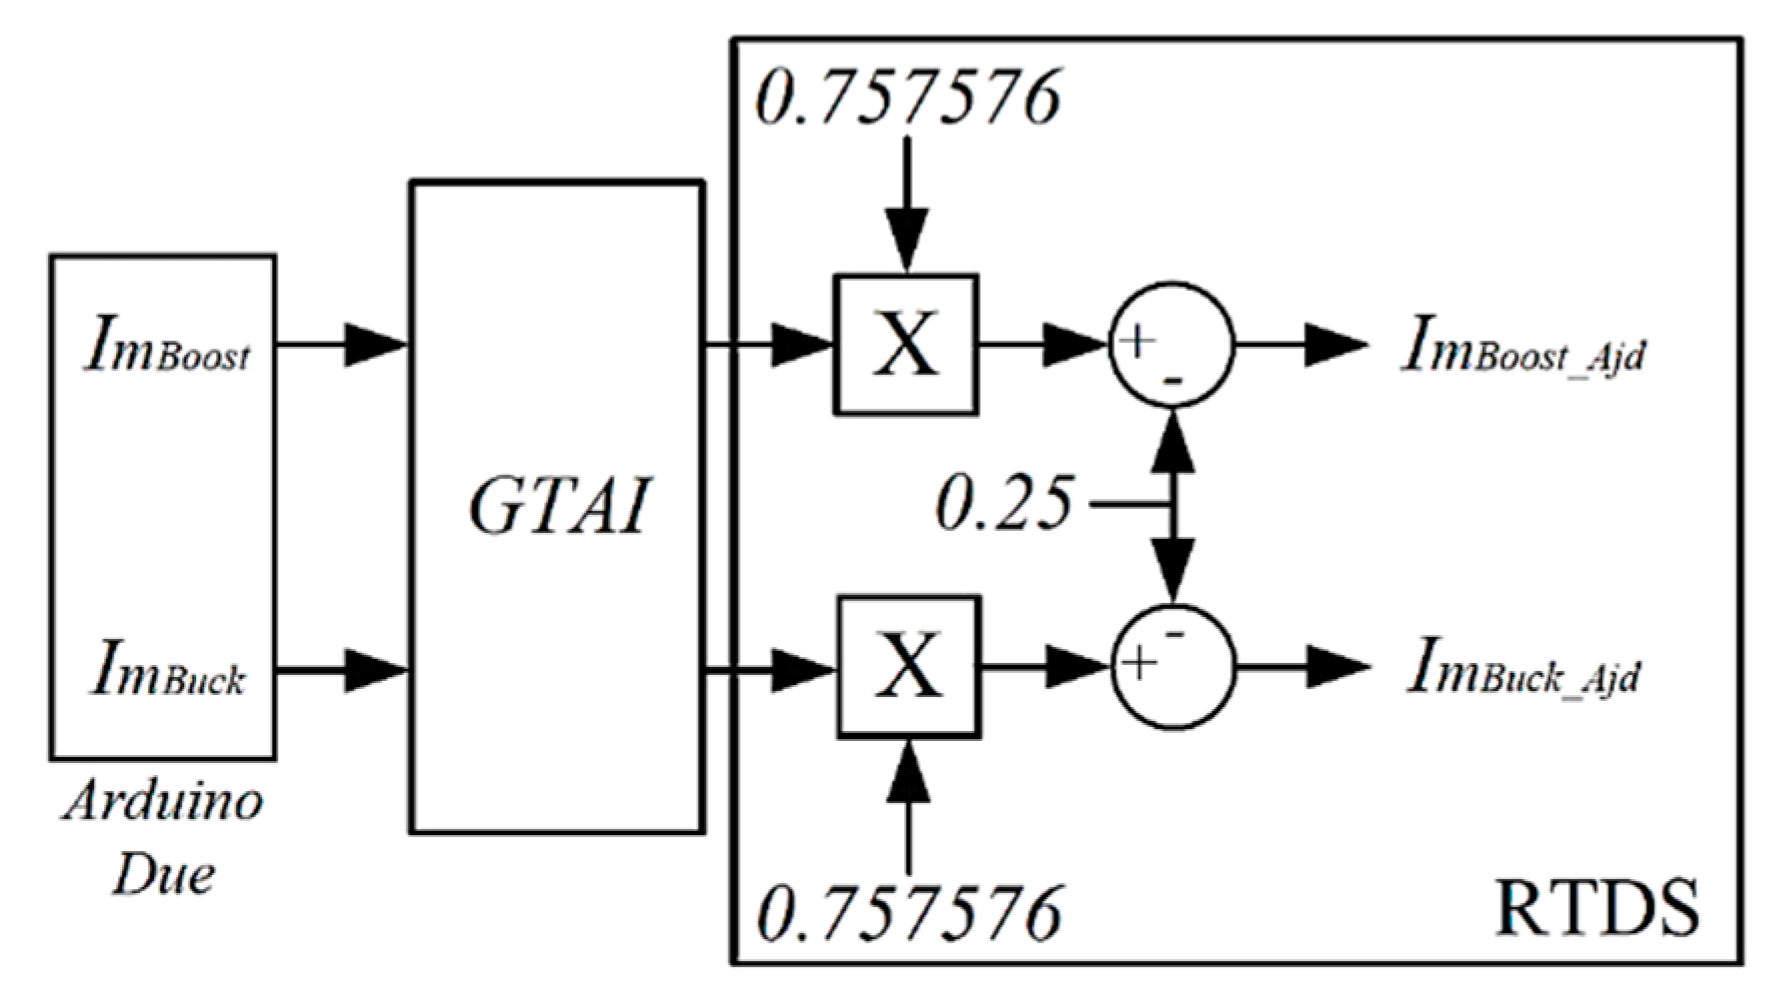
From Equations (23) and (27), the buck and boost converters duty cycles are obtained, respectively, and then saturated digitally in the range of 0–1023. The Arduino Due DAC is configured to read a digital value of 0 and generate an analog signal with a value of 0.55 V, and to read a digital value of 1023 and generate an analog signal with a value of 2.75 V. The RTDS GTAI card is configured with the gains shown in Table 2; with these gains the signal peak value, read in volts, results in a value of 1.0 in the RTDS.
Finally, after applying the described scaling, the signals are taken and processed by the RTDS to obtain the desired range of converters’ duty cycles with values between [0,1], as shown in Figure 15.
Figure 16 shows the general procedure used for the digital implementation of the control laws in the Arduino Due card and its connection with the RTDS.
5. Results and Discussion
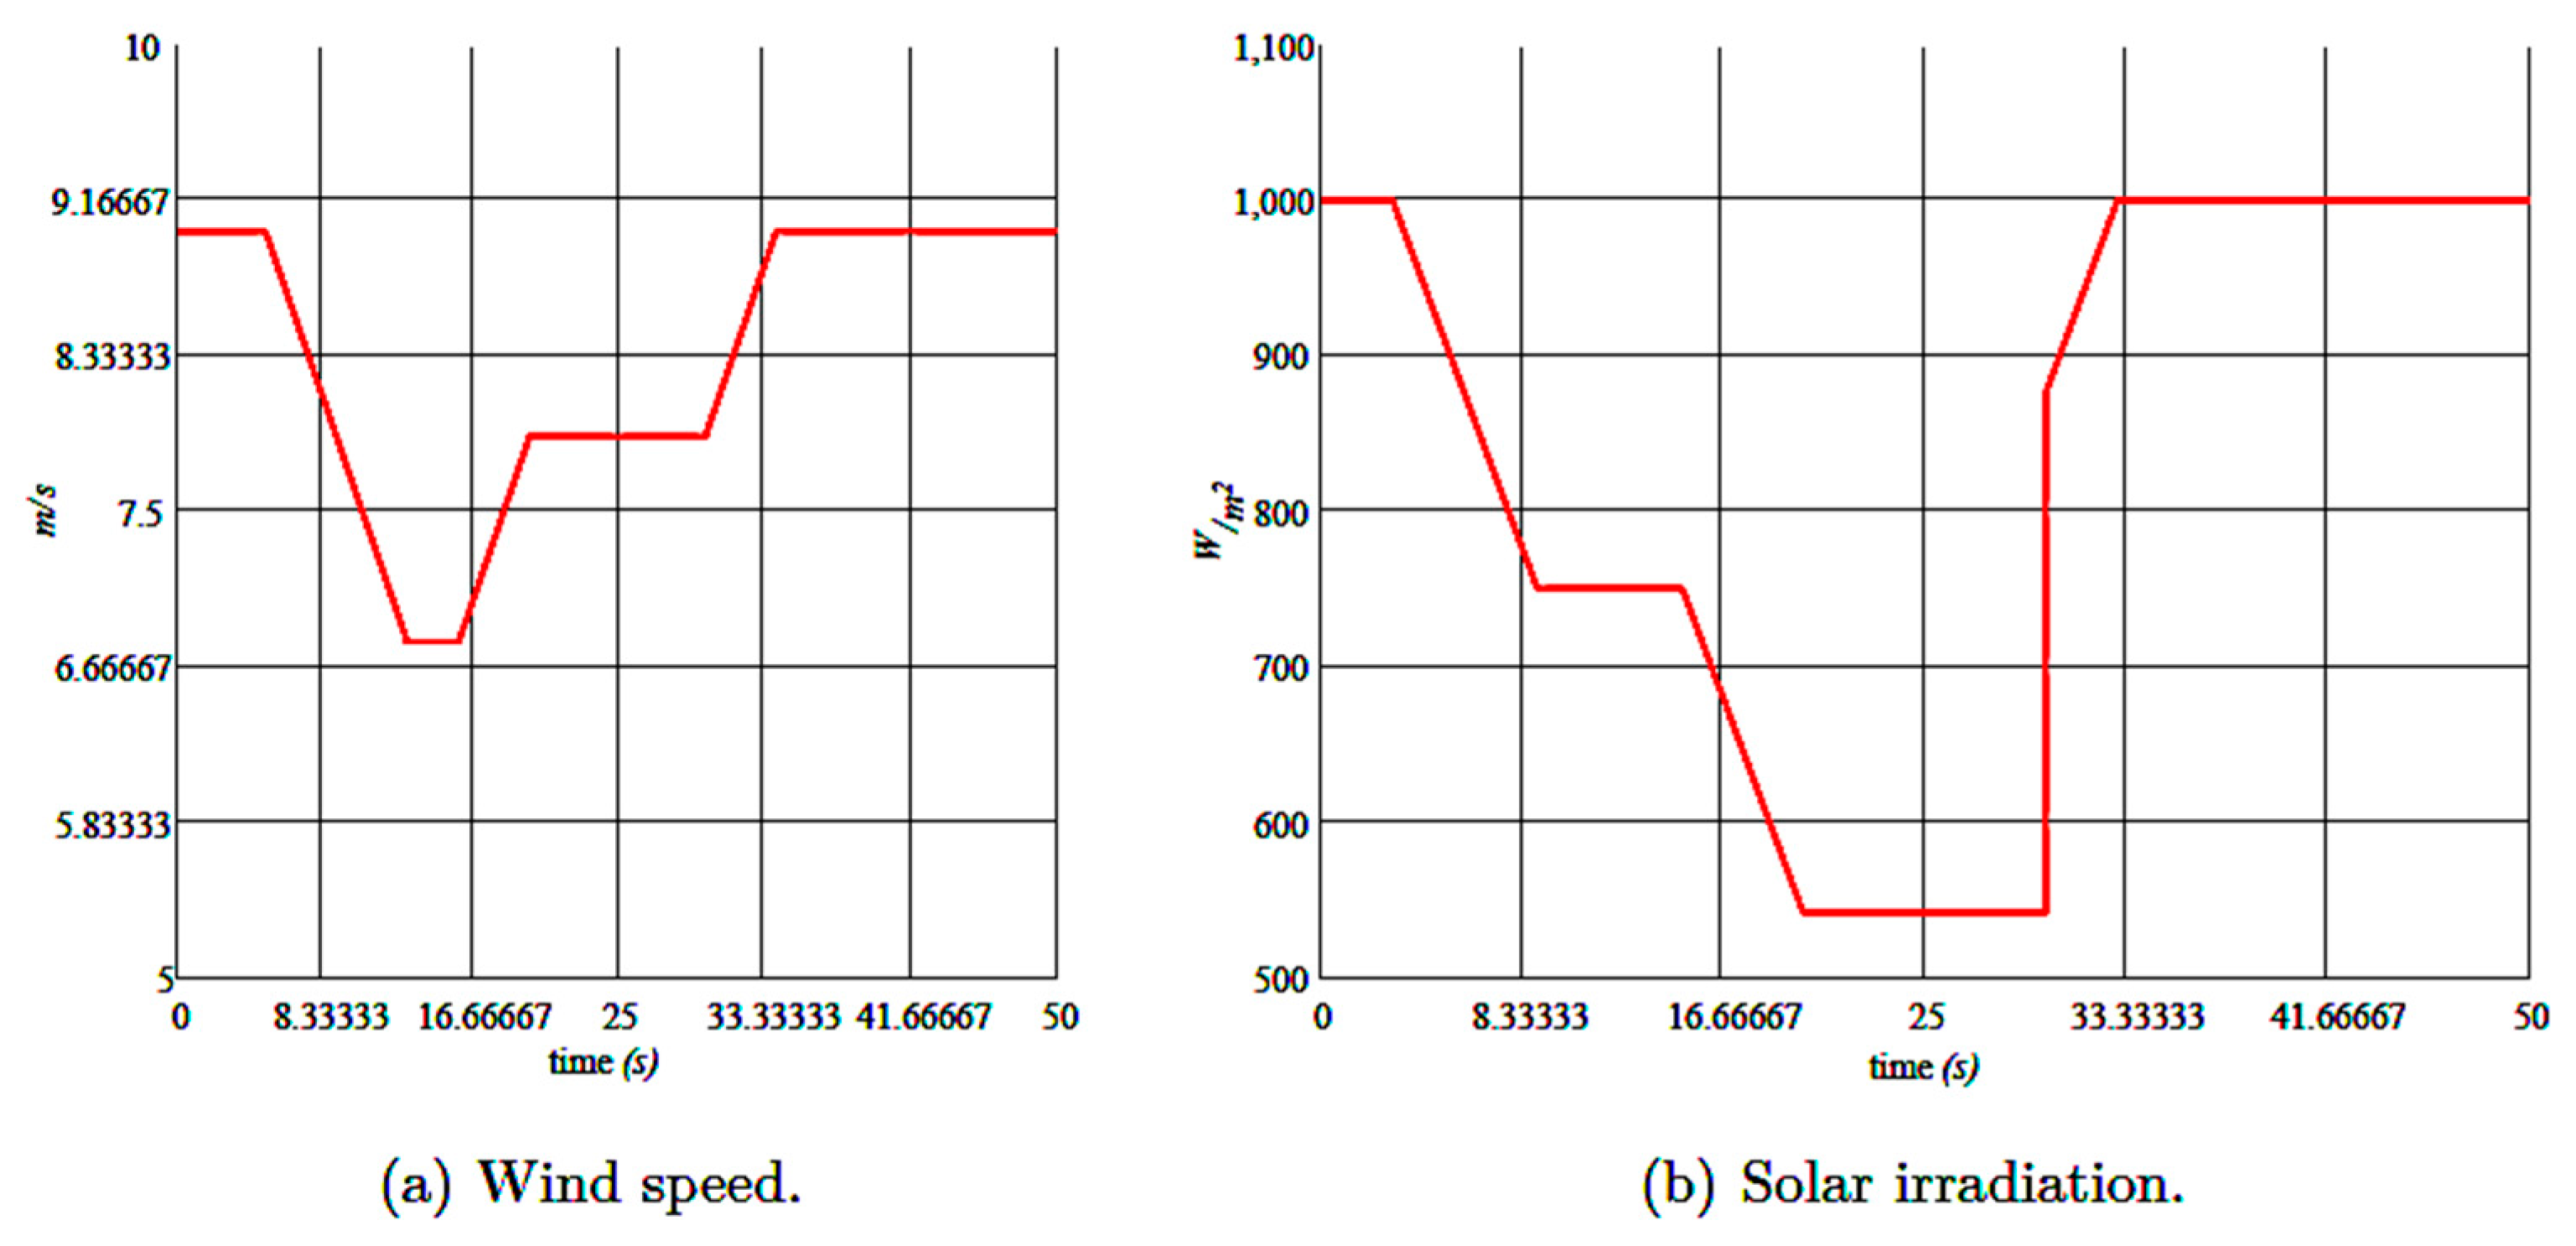
In this section, the performance of the controllers developed for the hybrid PV–wind generation system under changing weather conditions is evaluated. Figure 17 shows the profiles of wind speed and solar irradiation considered for this study. The nominal values were 9 m/s in the case of the wind speed, and 1000 W/m2 for solar irradiation. The value of the solar irradiationwas decreased to 550 W/m2 and then returned to the nominal value to emulate the effects of a cloud passing over the generation system. As for the wind speed, variations in its initial value were applied, considering positive and negative ramps emulating the dynamics in the availability of this resource.
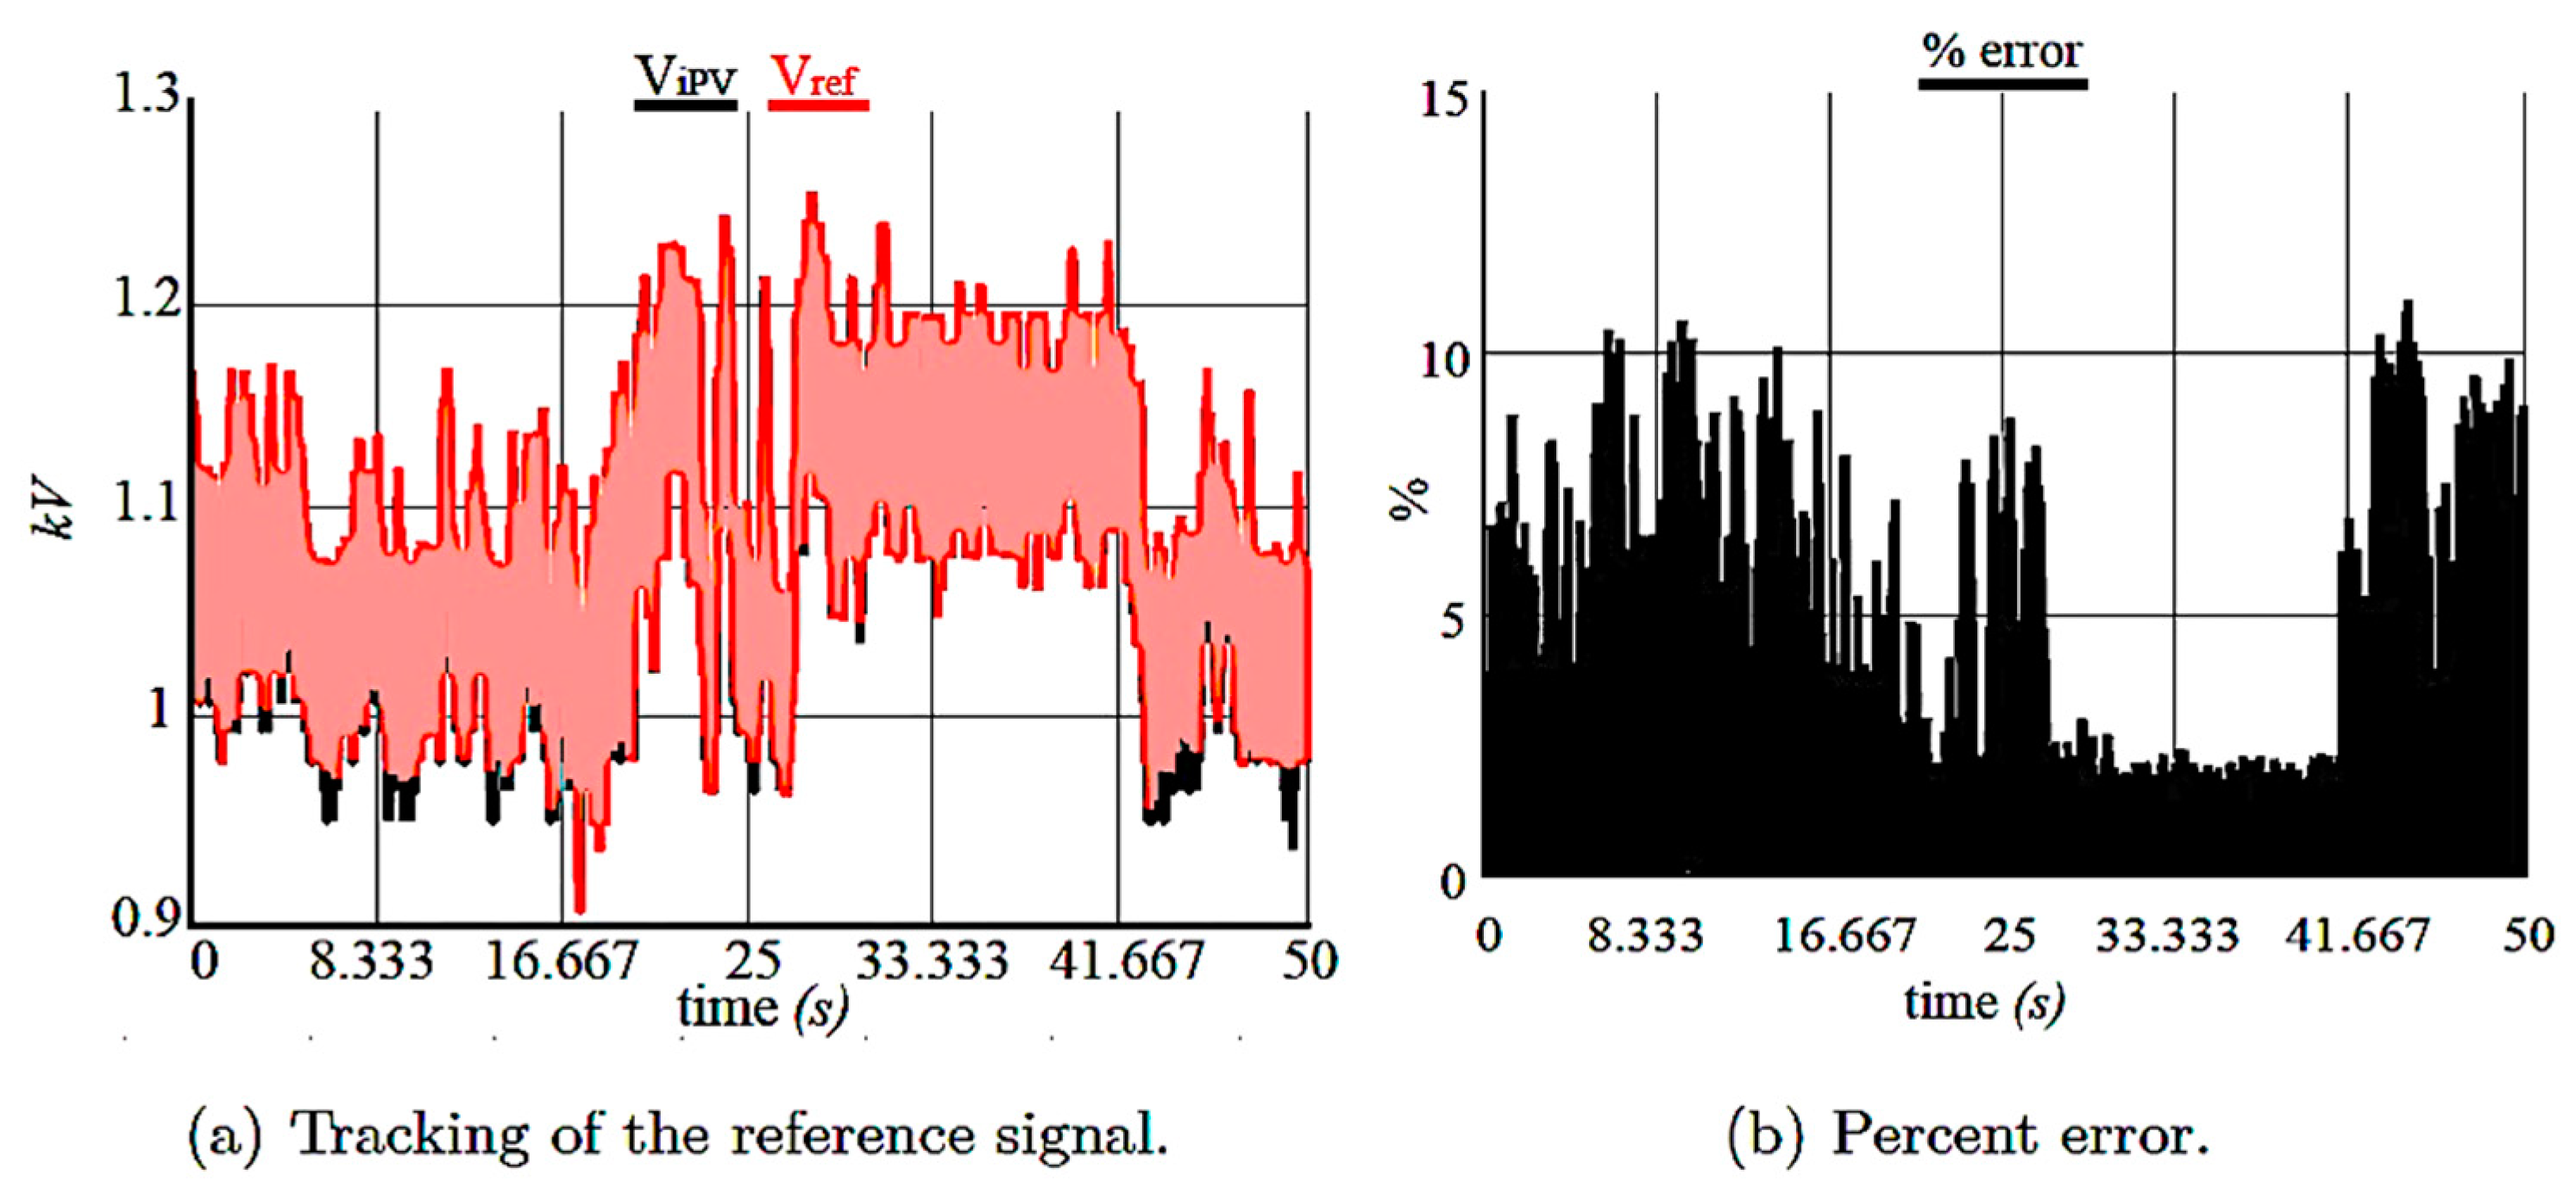
The behavior of control law for the buck converter Kv is shown in Figure 18. Figure 18a shows the reference value generated by the MPPT module (Vref, red line) and the output voltage at the terminals of the PV array (ViPV, black line). Good tracking of the reference voltage was observed, since most of the time the percent error was below 10%, with some peaks exceeding this value, but only during sudden changes in the solar irradiation, as shown in Figure 18b. Additionally, it is important to mention that the errors obtained in this case include the effect of the delay between the communication of the RTDS and the Arduino Card: an effect that is often ignored in offline simulations.
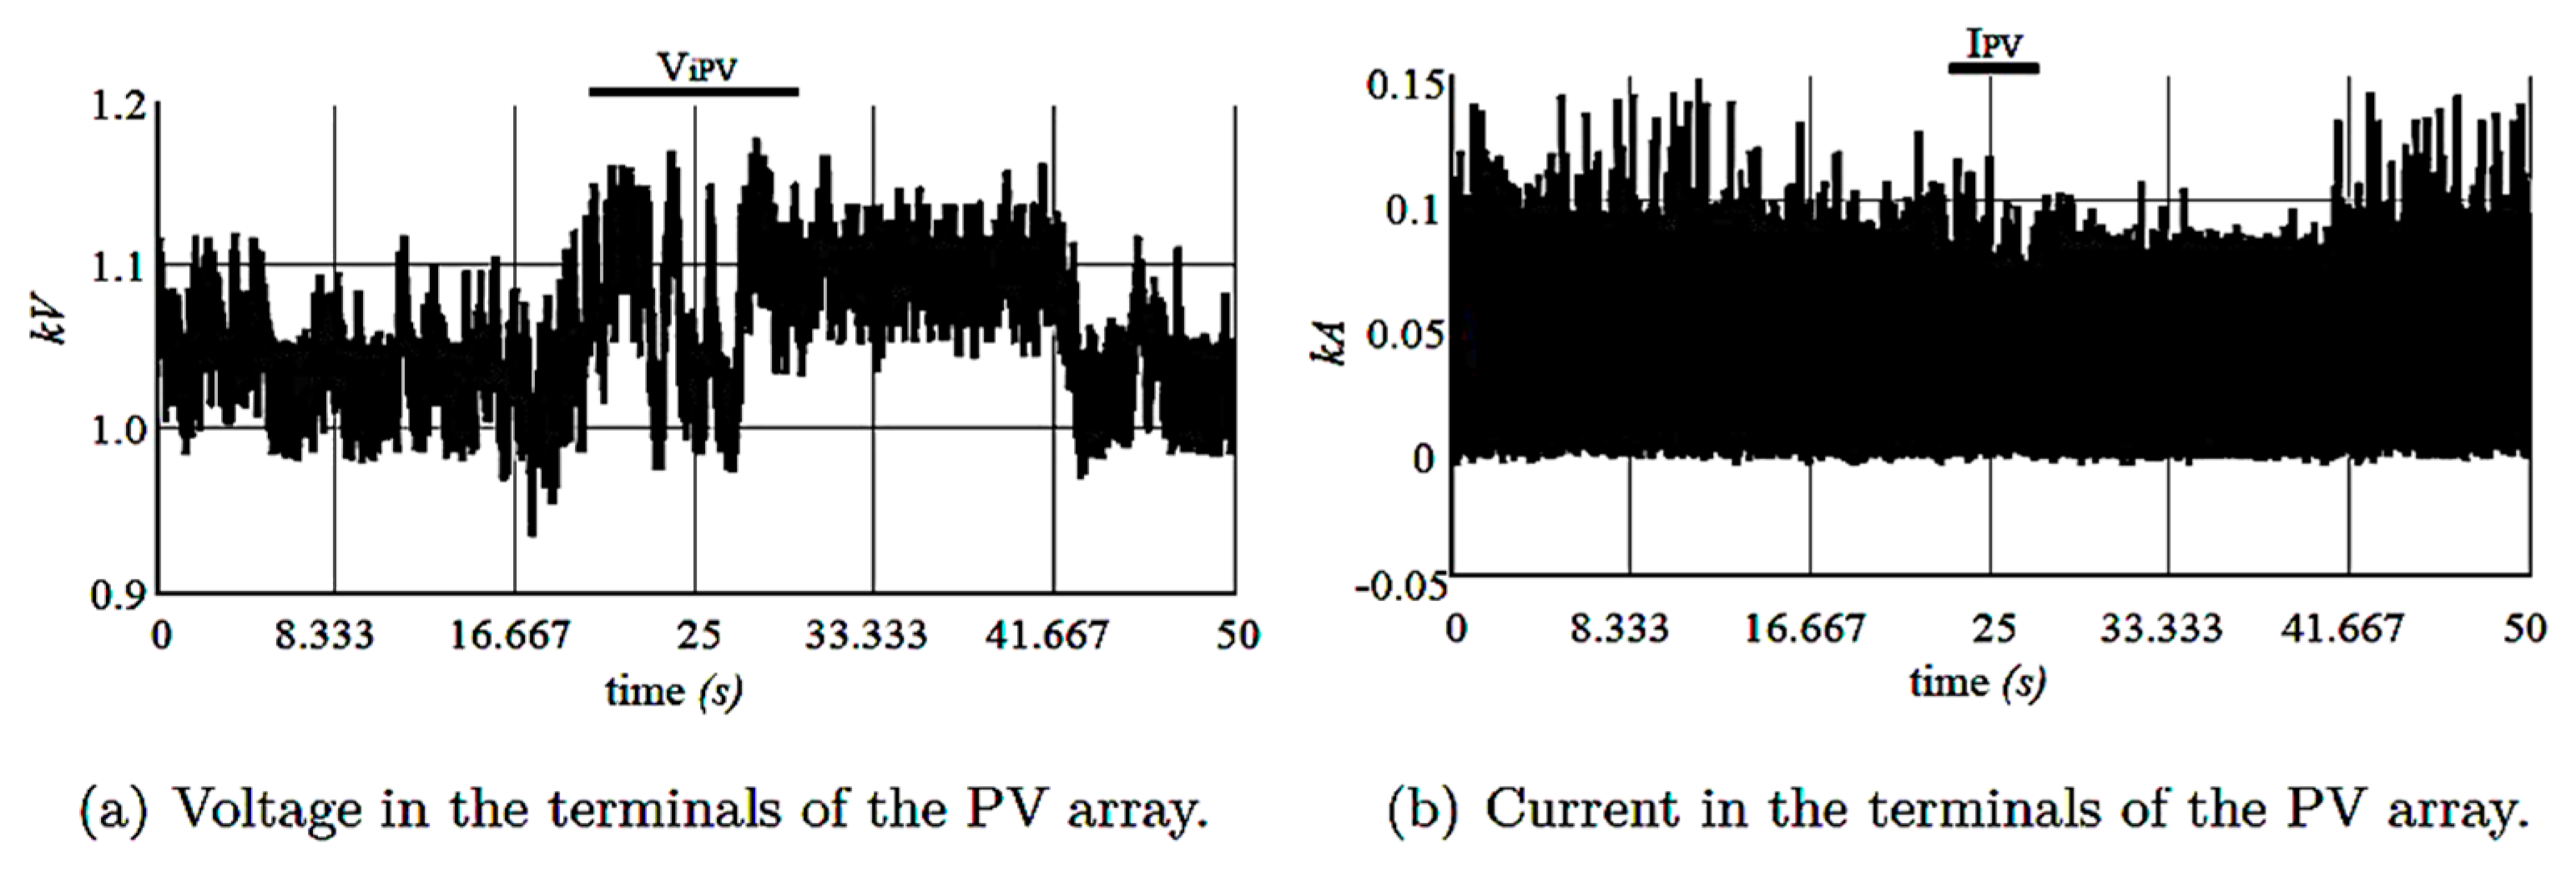
The waveforms of the voltage and current generated by the PV array during changes in the weather conditions are shown in Figure 19. Figure 19a shows that the voltage waveform changed according to the reference generated by the MPPT algorithm (see Figure 18a), and the output current of the PV array had an average value of around 0.05 kA, as shown in Figure 19b.
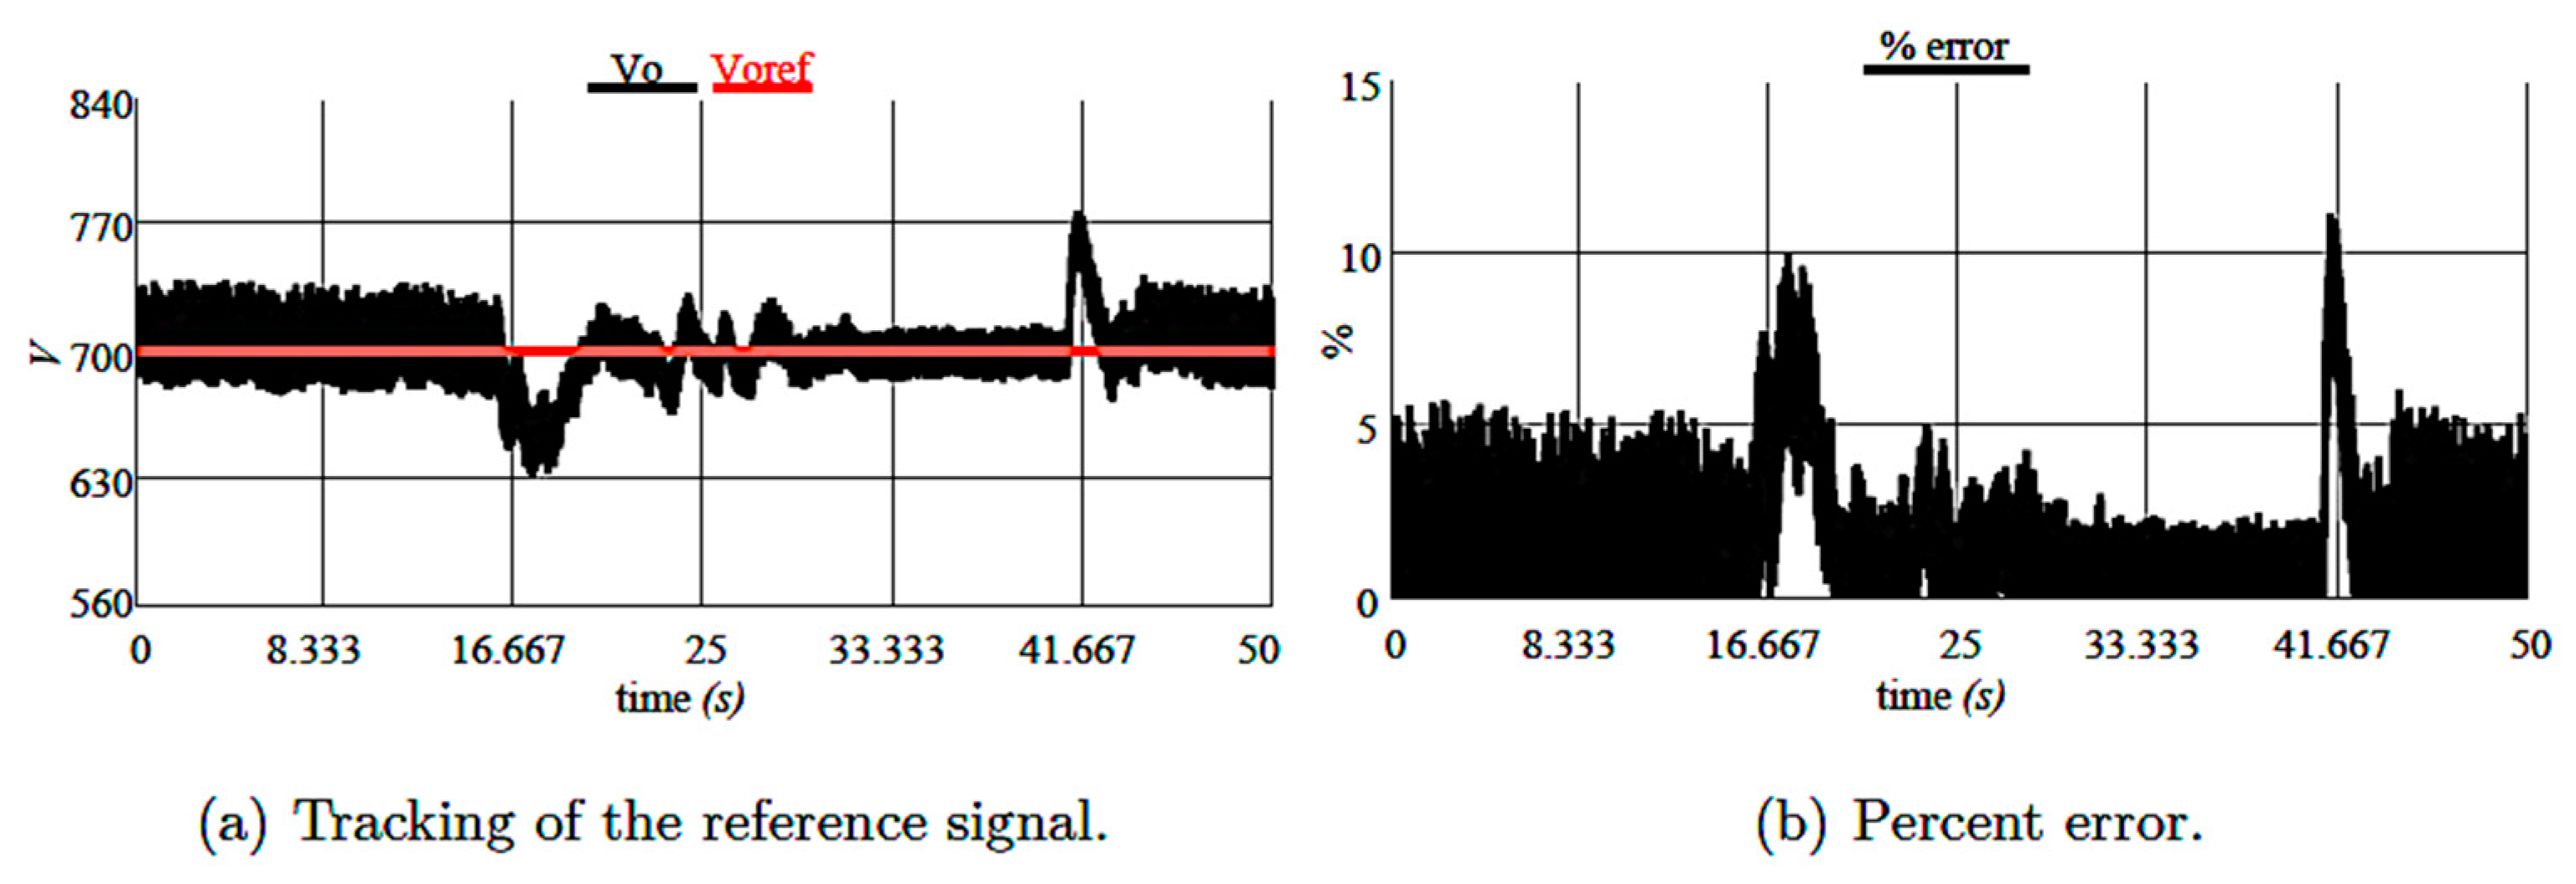
Figure 20 shows the performance of the controller of the boost converter. In Figure 20a, it can be seen that the voltage had a value that oscillated around the reference value Voref = 700 V, with errors below 6%, and peaks over 10% when sudden changes were applied to the value of the wind speed (see Figure 20b). The errors are lower than the errors obtained with the Kv controller of the Buck converter.
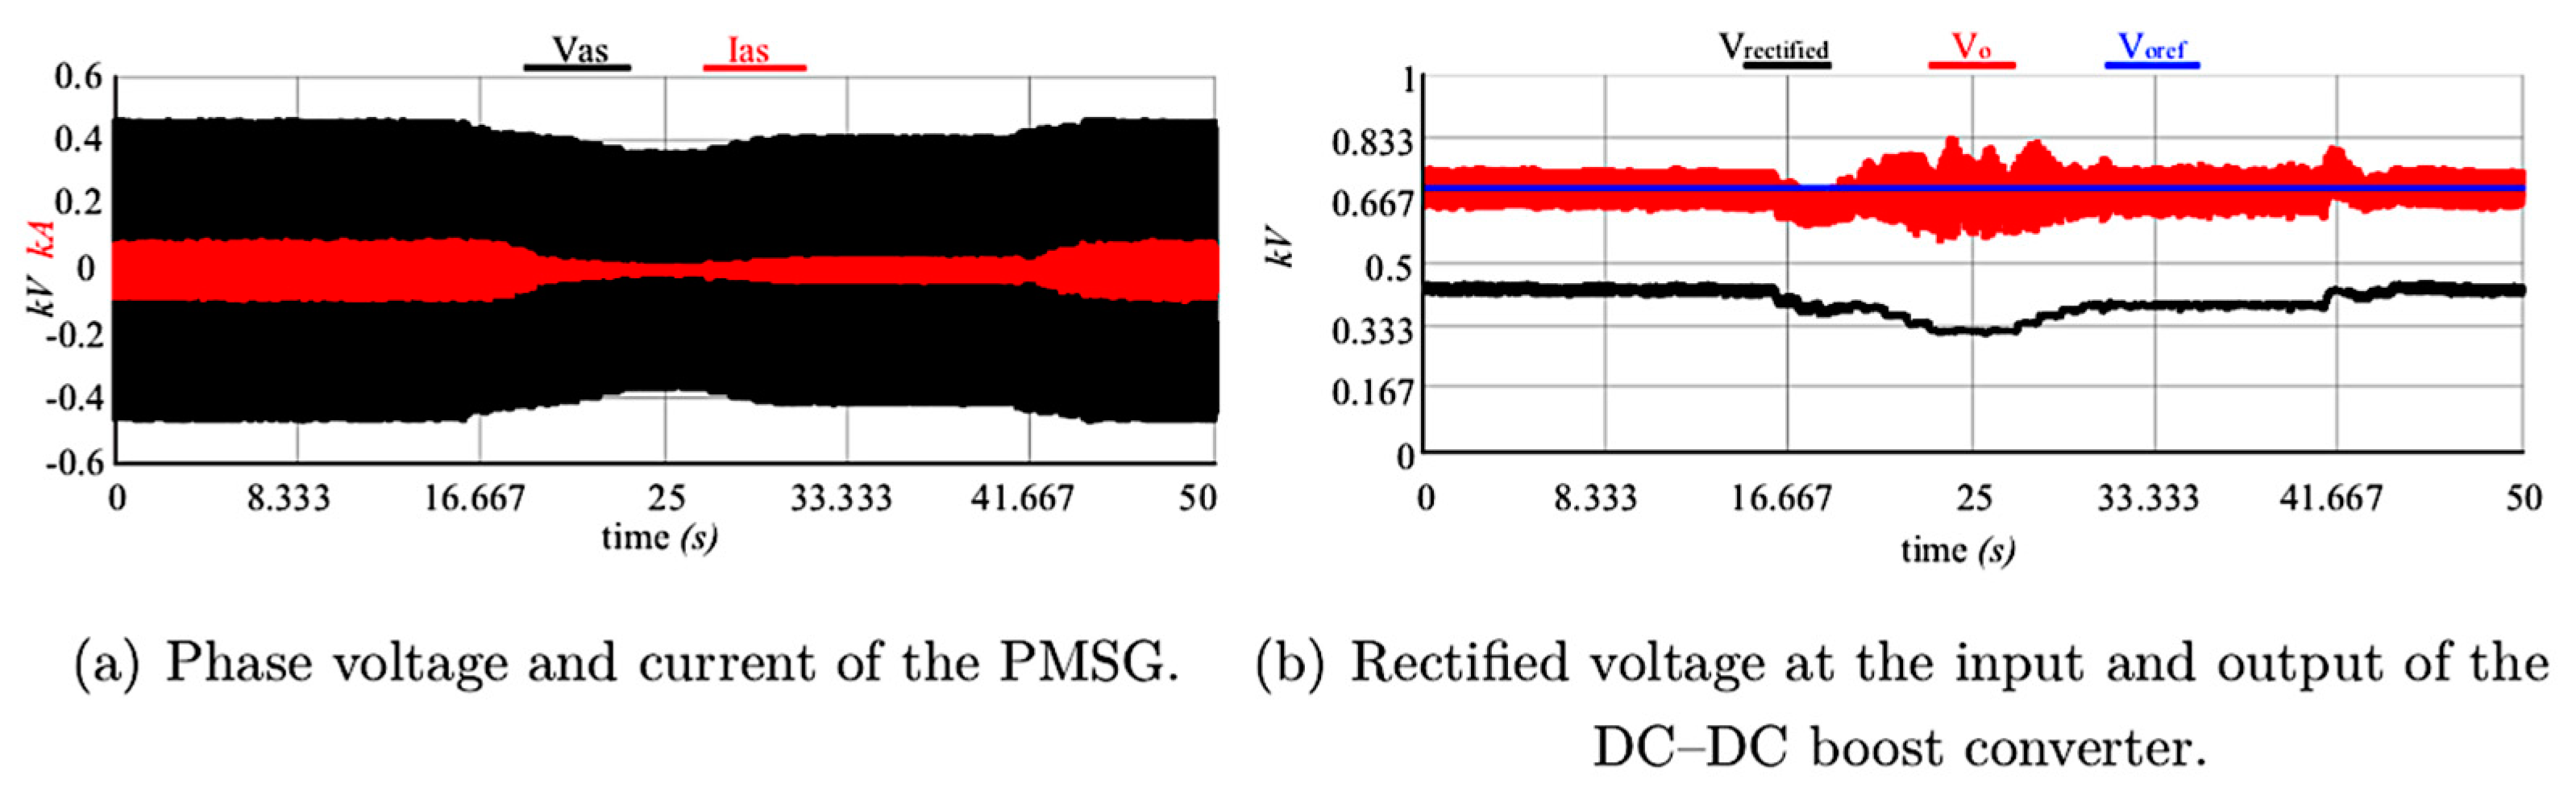
Figure 21a shows the phase voltage and current generated by the PMSG. Additionally, Figure 21b shows the rectified voltage (Vrectified, black line) and the output voltage of the boost converter (Vo, red line), following the reference value of 0.7 kV (Voref, blue line). The controllers performed well, considering the behavior of the voltage and current according to wind speed variations.
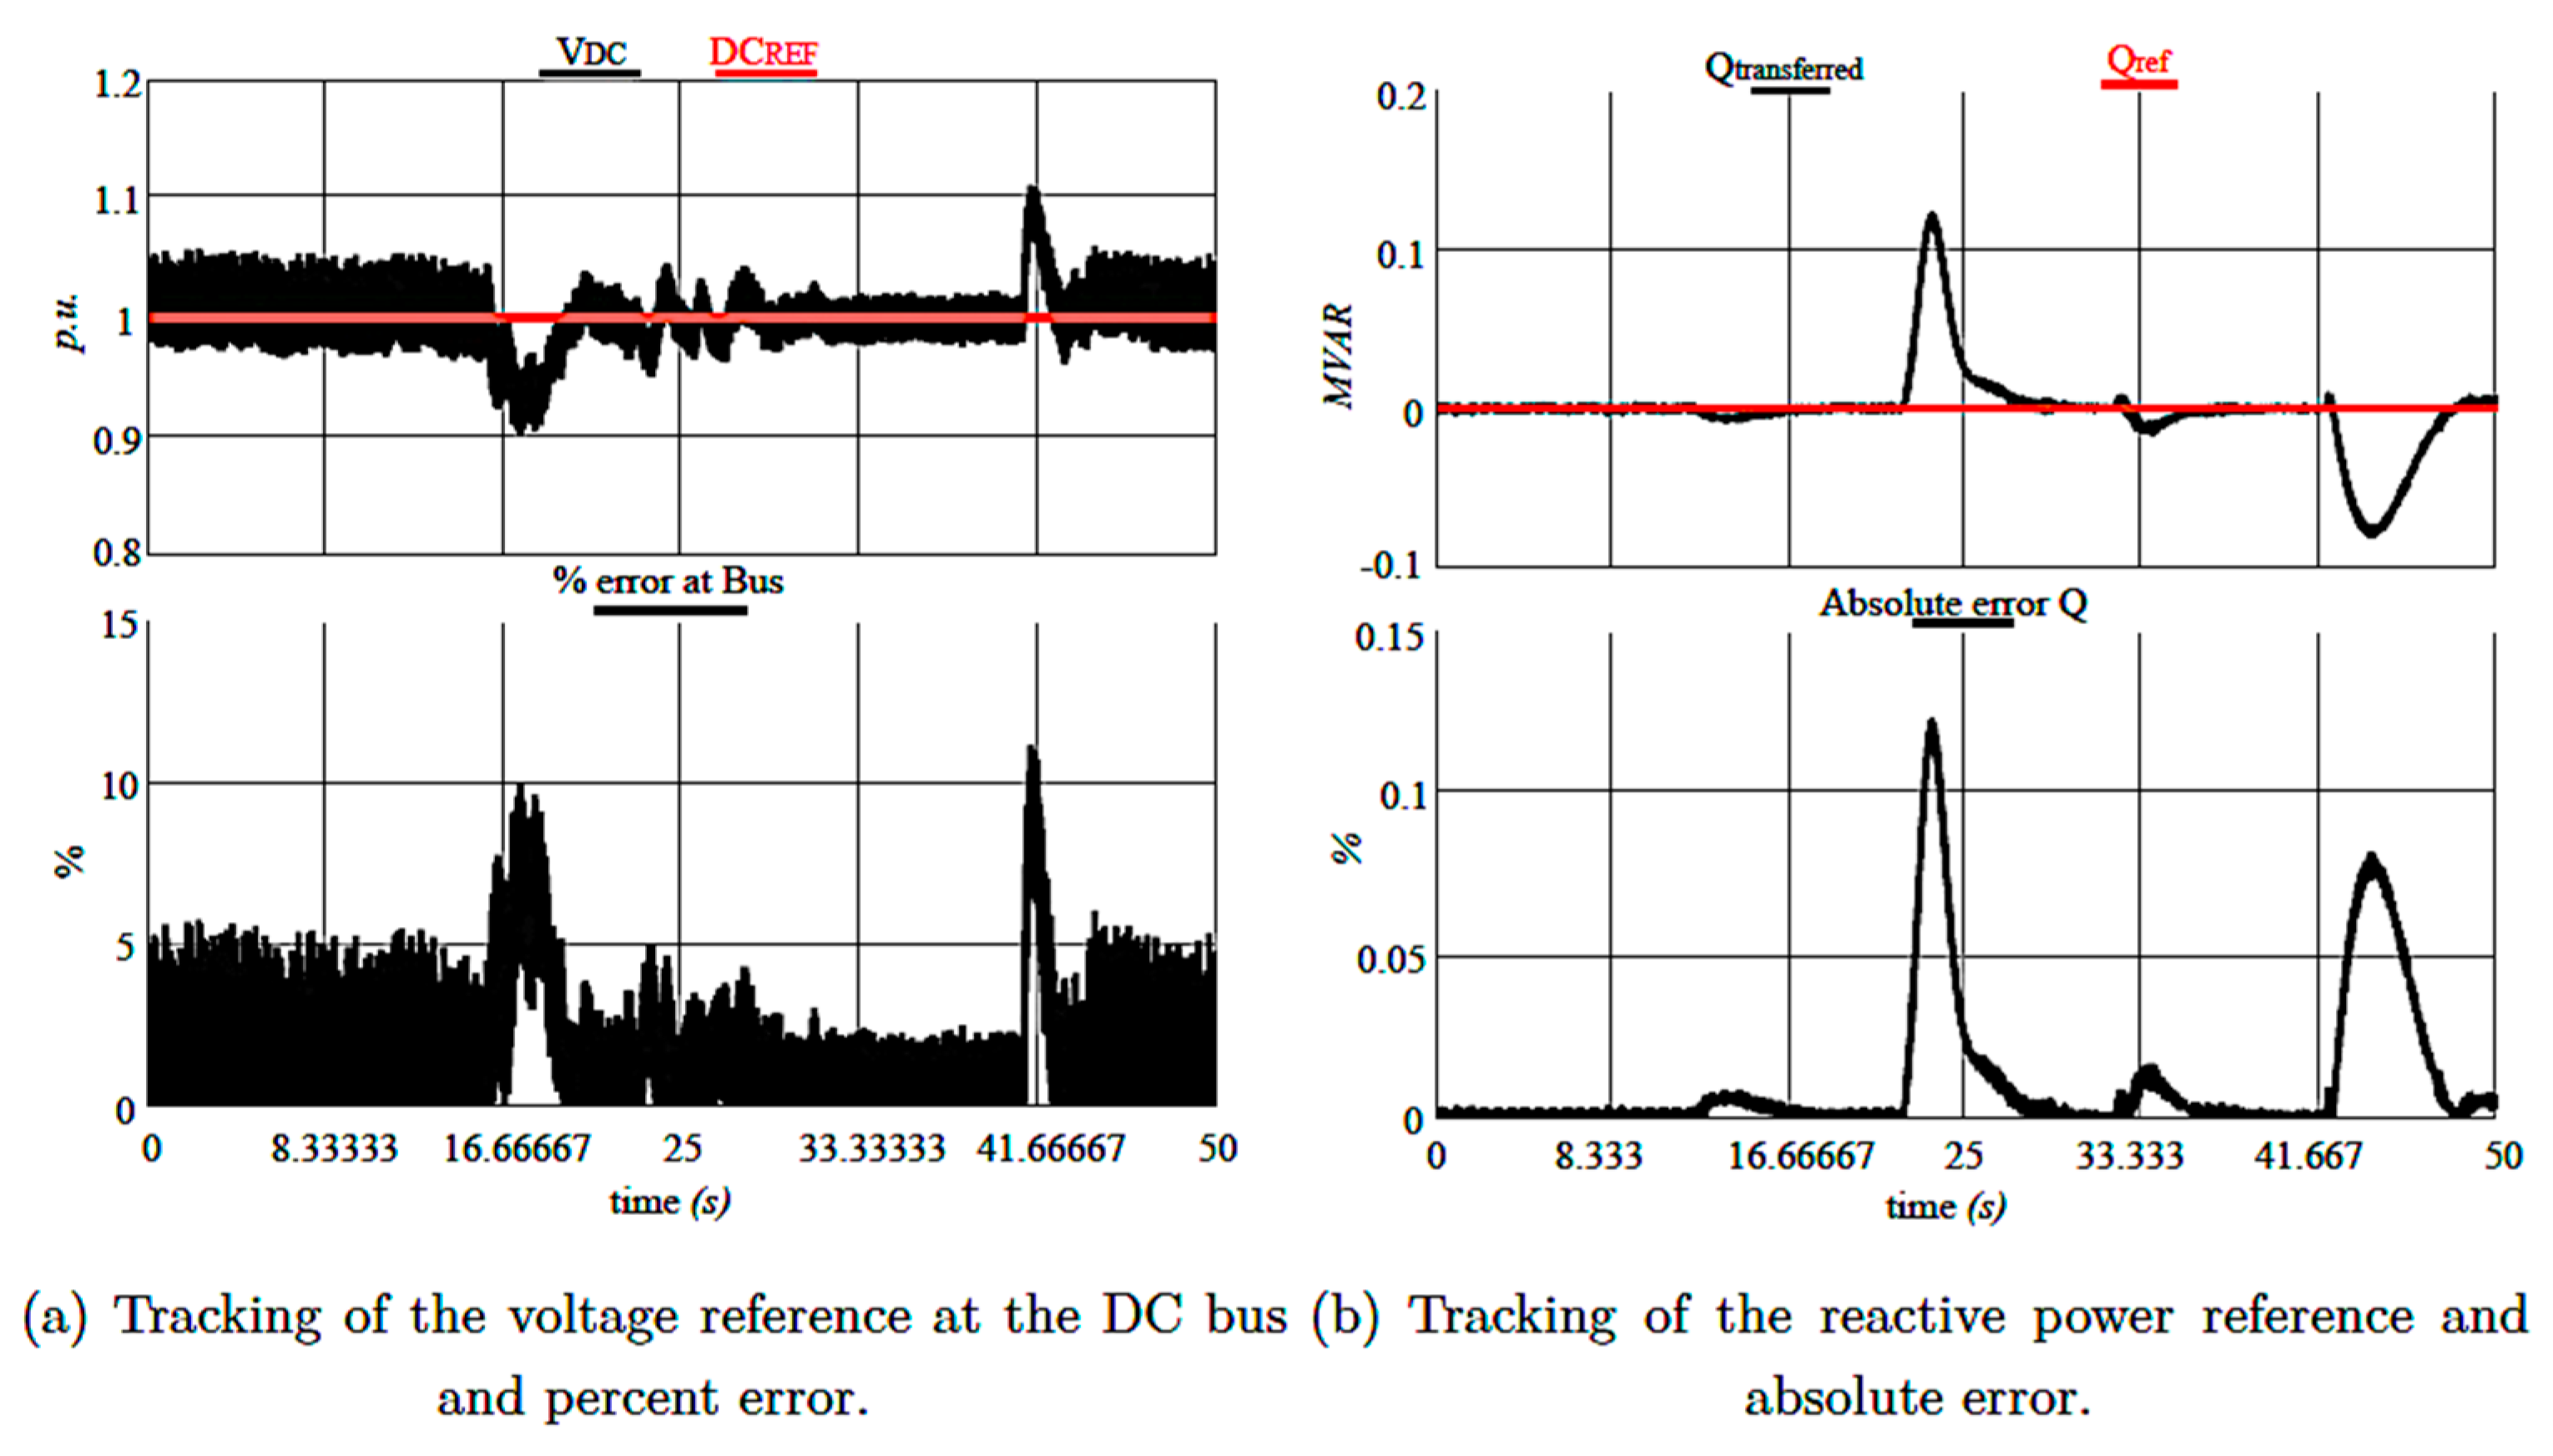
Figure 22 shows the performance of the control loops developed for the three-phase inverter. Please note that the voltage measurement on the DC bus and the reactive power injected to the grid are maintained at their reference value. The reactive power reference, in this case, was 0 MVAR, and the generated reactive power presented some positive and negative overdrafts when changes in the weather conditions were applied, but always returned to the indicated reference value.
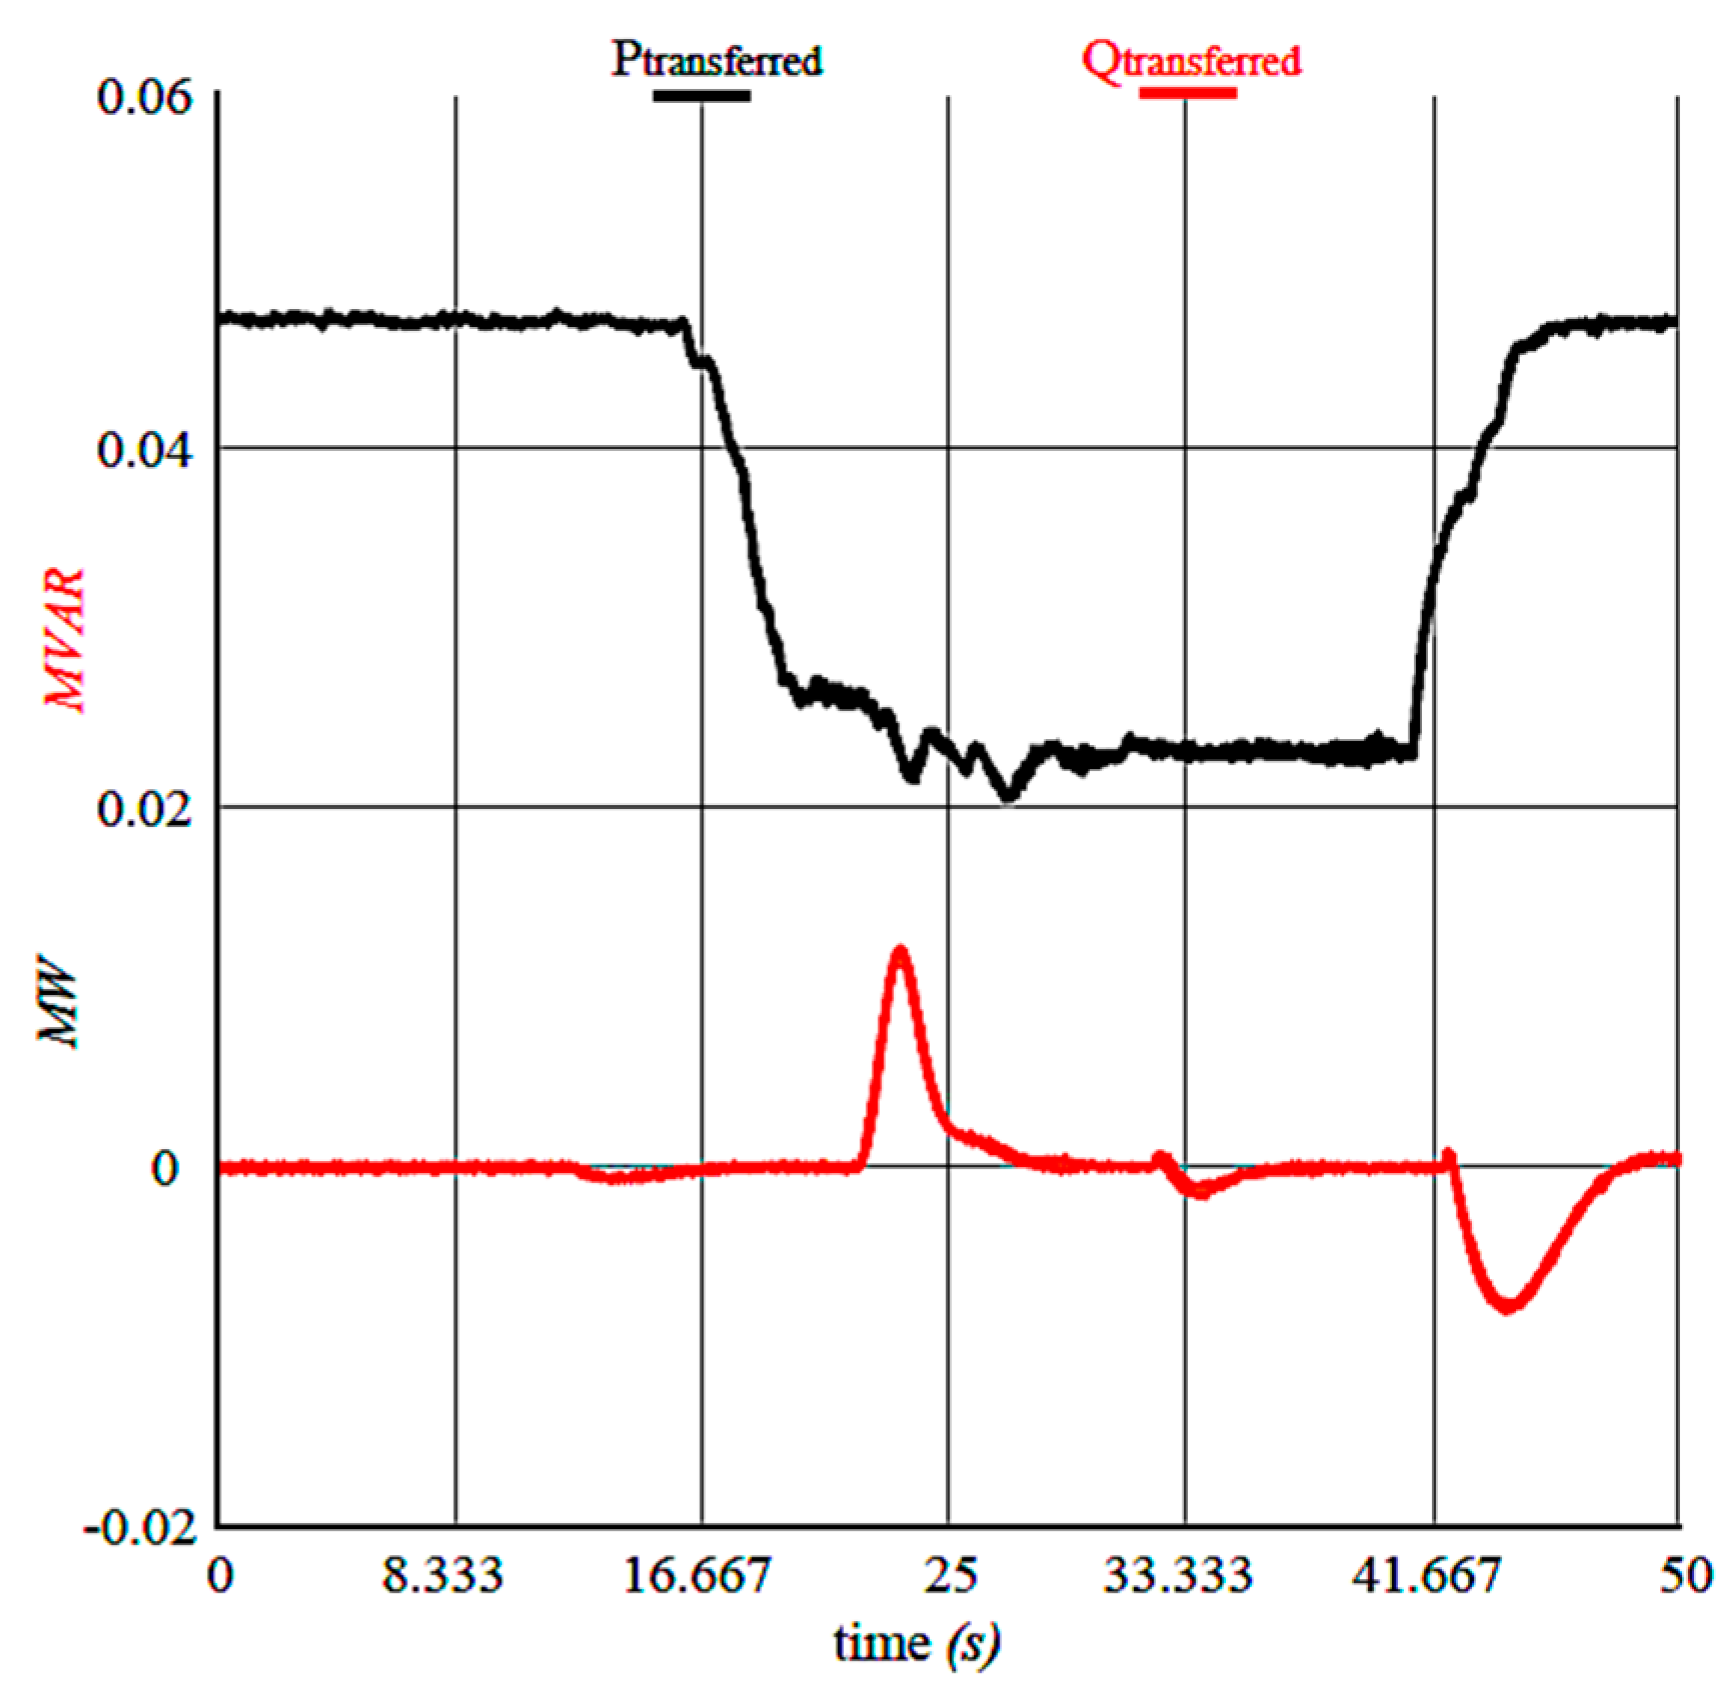
Finally, the active and reactive powers sent through the three-phase transformer to the grid are shown in Figure 23. The active power was generated according to the available natural resources, in this case solar irradiation and wind speed, and the proposed controller helped to extract the maximum power available and regulate the voltage at the connection point. On the other hand, the reactive power generated was minimized to the reference value of 0 MVAR, but the developed controller can be also used to help with the voltage support at the connection point. This can be done by changing the reference value of the reactive power.
From the obtained results it can be observed that the modeled hybrid PV–wind generation system is a good alternative for the generation of electricity. The power electronic converters used, together with the proposed control strategies, helped to maintain the operation of the system most efficiently under dynamic weather conditions, avoiding problems at the connection point related to changes in the wind speed and solar irradiation. Additionally, rapid implementation of the proposed test system in the RTDS and Arduino Due will be useful in the design, development, and testing of new control strategies or equipment before their final implementation, which will help to reduce costs and time.
6. Conclusions
The use of renewable energy sources for electricity generation is an important issue today; therefore, it is crucial to develop test systems to study and analyze their dynamic behavior. In this research work, a hybrid PV–wind generation system, including its electronic power converters, was proposed and implemented in an RTDS. The procedure followed for the development and implementation of each one of the controllers for the converters is presented. Additionally, using a rapid prototyping technique, the controllers were implemented in the digital platform Arduino Due and connected with the RTDS to test their performance in real-time under changing conditions of the inputs, in this case, considering variations in solar irradiation and wind speed.
A case study is presented, where the dynamic behavior of the proposed controllers and the complete system is shown. From the obtained results, it can be concluded that the converters helped in the transfer and conversion of the maximum power available from the natural resources, regulating the voltage in key points of the system. Regarding the proposed controllers, a good performance was observed, with a percent error in tracking the reference signal below 10% for the buck converter and 6% for the boost converter.
An advantage of the rapid implementation of the proposed test system in a real-time digital simulation platform and its controls in Arduino Due is the possibility to analyze the real behavior of the control systems and generation units. In addition to this, it would make it possible to conduct studies of the integration of these types of systems into electric power systems, without compromising the integrity of equipment and personnel.
Author Contributions
Conceptualization, V.P., R.P. and J.S.; methodology, V.P., R.P. and J.S.; software, V.P.; validation, V.P.; formal analysis, V.P., R.P., J.S. and A.O.; investigation, V.P., R.P. and J.S.; data curation, V.P., R.P. and J.S.; writing—original draft preparation, R.P.; writing—review and editing, V.P., R.P., J.S. and A.O.; supervision, R.P. and J.S.
Funding
This research received no external funding.
Acknowledgments
The authors want to acknowledge the Universidad Autónoma de San Luis Potosí (UASLP) through the Facultad de Ingeniería, and the Universidad de la Costa (CUC) for the facilities granted to carry out this investigation. Víctor Pagola wants to acknowledge the financial support received from CONACYT through a scholarship to carry out his MSc studies.
Conflicts of Interest
The authors declare no conflict of interest.
Appendix A
The main parameters of the hybrid PV–wind generation system are given in Table A1, Table A2, Table A3, Table A4, Table A5 and Table A6.

Table A1.
Parameters of the wind turbine.
| Parameter | Value |
|---|---|
| Rated power | 30 kW |
| Rated wind speed | 9 m/s |
| Rated rotor speed | 263 rpm |
| Blade diameter | 3.7 m |
| Air density | 1225 kg/m3 |
Table A2.
Parameters of the PMSG.
| Parameter | Value |
|---|---|
| Rated power | 30 kW |
| Line voltage | 519.6 V |
| Phase inductance of the windings, axis d and q | 28.882 mH |
| Phase resistance of the windings | 0.0038 Ω |
| Leakage inductance | 2.888 mH |
| Number of poles | 12 |
| Rotation speed | 263 rpm |
| Electric frequency | 26.3 Hz |
| Inertia constant | 0.0394 MW/MVA |
Table A3.
Parameters of the PV module.
| Parameter | Value |
|---|---|
| Rated power | 50 W |
| Open-circuit voltage | 22.8 V |
| Short-circuit current | 2.99 A |
| Rated temperature | 25 °C |
| Rated irradiance | 1000 W/m2 |
| Number of PV cells | 36 |
Table A4.
Parameters of the DC–DC boost converter.
| Parameter | Value |
|---|---|
| Maximum power | 30 kW |
| Input voltage | 50–500 V |
| Output voltage | 700 V |
| Switching frequency | 3 kHz |
| Ripple in the inductor current | 25% |
| Ripple in the output voltage | 5% (35 V) |
Table A5.
Parameters of the DC–DC buck converter.
| Parameter | Value |
|---|---|
| Maximum power | 20 kW |
| Input voltage | 780–1500 V |
| Output voltage | 700 V |
| Switching frequency | 3 kHz |
| Ripple in the inductor current | 25% |
| Ripple in the output voltage | 5% (35 V) |
Table A6.
Parameters of the three-phase transformer.
| Parameter | Value |
|---|---|
| Rated power | 0.1 MVA |
| Transformation ratio | 230/13,800 V (line to line) |
| Rated frequency | 60 Hz |
| Leakage inductance | 140 μH |
| No-load losses | 1 kW |
| Magnetization current | 2.51 A |
References
- Badwawi, R.A.; Abusara, M.; Mallick, T. A Review of Hybrid Solar PV and Wind Energy System. Smart Sci. 2015, 3, 127–138. [Google Scholar] [CrossRef] [Green Version]
- Paez, A.F.; Maldonado, Y.M.; Castro, A.O. Future Scenarios and Trends of Energy Demand in Colombia Using Long-Range Energy Alternative Planning. Int. J. Energy Econ. Policy 2017, 7, 178–190. [Google Scholar]
- Engin, M. Sizing and Simulation of PV-Wind Hybrid Power System. Int. J. Photoenergy 2013, 2013, 217526. [Google Scholar] [CrossRef]
- Claudia Roldán, M.; Martínez, M.; Peña, R. Scenarios for a Hierarchical Assessment of the Global Sustainability of Electric Power Plants in México. Renew. Sustain. Energy Rev. 2014, 33, 154–160. [Google Scholar] [CrossRef]
- Ospino-Castro, A.; Pena-Gallardo, R.; Rodriguez, A.H.; Segundo-Ramirez, J.; Munoz-Maldonado, Y.A. Techno-Economic Evaluation of a Grid-Connected Hybrid PV-Wind Power Generation System in San Luis Potosi, Mexico. In Proceedings of the 2017 IEEE International Autumn Meeting on Power, Electronics and Computing (ROPEC 2017), Ixtapa, Mexico, 8–10 November 2017; pp. 1–6. [Google Scholar] [CrossRef]
- Eras, J.J.C.; Fontalvo, M.O.; Rueda, C.A.; Herrera, H.H.; Leiro, P.R. Evaluación de La Calidad de Vida Urbana En Las Principales Ciudades Colombianas. Rev. Bras. Gest. Desenvolv. Reg. 2017, 13, 106–127. [Google Scholar]
- Cheddadi, Y.; Gaga, A.; Errahimi, F.; Sbai, N.E. Design of an Energy Management System for an Autonomous Hybrid Micro-Grid Based on Labview IDE. In Proceedings of the 2015 IEEE International Renewable and Sustainable Energy Conference (IRSEC 2015), Marrakech, Morocco, 10–13 December 2015. [Google Scholar] [CrossRef]
- Park, M.; Yu, I.K. A Novel Real-Time Simulation Technique of Photovoltaic Generation Systems Using RTDS. IEEE Trans. Energy Convers. 2004, 19, 164–169. [Google Scholar] [CrossRef]
- Gao, W.; Zheglov, V.; Wang, G.; Mahajan, S.M. PV-Wind-Fuel Cell-Electrolyzer Micro-Grid Modeling and Control in Real Time Digital Simulator. In Proceedings of the 2009 International Conference on Clean Electrical Power (ICCEP 2009), Capri, Italy, 9–11 June 2009; pp. 29–34. [Google Scholar] [CrossRef]
- Li, W.; Joós, G.; Bélanger, J. Real-Time Simulation of a Wind Turbine Generator Coupled with a Battery Supercapacitor Energy Storage System. IEEE Trans. Ind. Electron. 2010, 57, 1137–1145. [Google Scholar] [CrossRef]
- Mohamed, A.; Mohammed, O. Real-Time Energy Management Scheme for Hybrid Renewable Energy Systems in Smart Grid Applications. Electr. Power Syst. Res. 2013, 96, 133–143. [Google Scholar] [CrossRef]
- Peña, R.; Medina, A. Real Time Simulation of a Power System Including Renewable Energy Sources. In Proceedings of the 2012 North American Power Symposium (NAPS 2012), Champaign, IL, USA, 9–11 September 2012. [Google Scholar] [CrossRef]
- Gibson, I.; Rosen, D.W.; Stucker, B. Additive Manufacturing Technologies: Rapid Prototyping to Direct Digital Manufacturing; Springer: Berlin, Germany, 2010. [Google Scholar] [CrossRef]
- Chinchilla, M.; Arnaltes, S.; Burgos, J.C. Control of Permanent-Magnet Generators Applied to Variable-Speed Wind-Energy Systems Connected to the Grid. IEEE Trans. Energy Convers. 2006, 21, 130–135. [Google Scholar] [CrossRef] [Green Version]
- Agarwal, V.; Aggarwal, R.K.; Patidar, P.; Patki, C. A Novel Scheme for Rapid Tracking of Maximum Power Point in Wind Energy Generation Systems. IEEE Trans. Energy Convers. 2010, 25, 228–236. [Google Scholar] [CrossRef] [Green Version]
- Lin, W.-M.; Hong, C.-M. Intelligent Approach to Maximum Power Point Tracking Control Strategy for Variable-Speed Wind Turbine Generation System. Energy 2010, 35, 2440–2447. [Google Scholar] [CrossRef]
- Antonishen, M.P.; Han, H.Y.; Brekken, T.K.A.; Von Jouanne, A.; Yokochi, A.; Halamay, D.A.; Song, J.; Naviaux, D.B.; Davidson, J.D.; Bistrika, A. A Methodology to Enable Wind Farm Participation in Automatic Generation Control Using Energy Storage Devices. In Proceedings of the IEEE Power and Energy Society General Meeting, San Diego, CA, USA, 22–26 July 2012. [Google Scholar] [CrossRef]
- Selvamuthukumaran, R.; Gupta, R. Rapid Prototyping of Power Electronics Converters for Photovoltaic System Application Using Xilinx System Generator. IET Power Electron. 2014, 7, 2269–2278. [Google Scholar] [CrossRef]
- Rahim, N.A.; Mekhilef, S. Implementation of Three-Phase Grid Connected Inverter for Photovoltaic Solar Power Generation System. In Proceedings of the PowerCon 2002—2002 International Conference on Power System Technology, Kunming, China, 13–17 October 2002; Volume 1, pp. 570–573. [Google Scholar] [CrossRef]
- Ciobotaru, M.; Kerekes, T.; Teodorescu, R.; Bouscayrol, A. PV Inverter Simulation Using MATLAB/Simulink Graphical Environment and PLECS Blockset. In Proceedings of the IECON Proceedings (Industrial Electronics Conference), Paris, France, 6–10 November 2006; pp. 5313–5318. [Google Scholar] [CrossRef]
- Villanueva, E.; Correa, P.; Rodríguez, J.; Member, S.; Pacas, M.; Member, S. Control of a Single-Phase Cascaded H-Bridge Multilevel Inverter for Grid-Connected Photovoltaic Systems. IEEE Trans. Ind. Electron. 2009, 56, 4399–4406. [Google Scholar] [CrossRef]
- Selvaraj, J.; Rahim, N.A. Multilevel Inverter for Grid-Connected PV System Employing Digital PI Controller. IEEE Trans. Ind. Electron. 2009, 56, 149–158. [Google Scholar] [CrossRef]
- Liu, C.; Chau, K.T.; Zhang, X. An Efficient Wind-Photovoltaic Hybrid Generation System Using Doubly Excited Permanent-Magnet Brushless Machine. IEEE Trans. Ind. Electron. 2010, 57, 831–839. [Google Scholar] [CrossRef]
- Daniel, S.A.; AmmasaiGounden, N. A Novel Hybrid Isolated Generating System Based on PV Fed Inverter-Assisted Wind-Driven Induction Generators. IEEE Trans. Energy Convers. 2004, 19, 416–422. [Google Scholar] [CrossRef]
- Kim, S.K.; Jeon, J.H.; Cho, C.H.; Ahn, J.B.; Kwon, S.H. Dynamic Modeling and Control of a Grid-Connected Hybrid Generation System with Versatile Power Transfer. IEEE Trans. Ind. Electron. 2008, 55, 1677–1688. [Google Scholar] [CrossRef]
- Nejabatkhah, F.; Danyali, S.; Hosseini, S.H.; Sabahi, M.; Niapour, S.M. Modeling and Control of a New Three-Input Dc-Dc Boost Converter for Hybrid PV/FC/Battery Power System. IEEE Trans. Power Electron. 2012, 27, 2309–2324. [Google Scholar] [CrossRef]
- Chen, Y.M.; Cheng, C.S.; Wu, H.C. Grid-connected hybrid PV/wind power generation system with improved DC bus voltage regulation strategy. In Proceedings of the Twenty-First Annual IEEE Applied Power Electronics Conference and Exposition (APEC’06), Dallas, TX, USA, 19–23 March 2006; pp. 1–7. [Google Scholar] [CrossRef]
- Merabet, A.; Tawfique Ahmed, K.; Ibrahim, H.; Beguenane, R.; Ghias, A.M.Y.M. Energy Management and Control System for Laboratory Scale Microgrid Based Wind-PV-Battery. IEEE Trans. Sustain. Energy 2017, 8, 145–154. [Google Scholar] [CrossRef]
- Villalva, M.G.; Gazoli, J.R.; Filho, E.R. Comprehensive Approach to Modeling and Simulation of Photovoltaic Arrays. IEEE Trans. Power Electron. 2009, 24, 1198–1208. [Google Scholar] [CrossRef]
- Salmi, T.; Bouzguenda, M.; Gastli, A.; Masmoudi, A. MATLAB/Simulink Based Modelling of Solar Photovoltaic Cell. Int. J. Renew. Energy Res. 2012, 2, 213–218. [Google Scholar] [CrossRef]
- Xiao, W.; Dunford, W.G.; Capel, A. A Novel Modeling Method for Photovoltaic Cells. In Proceedings of the PESC Record—IEEE Annual Power Electronics Specialists Conference, Aachen, Germany, 20–25 June 2004; Volume 3, pp. 1950–1956. [Google Scholar] [CrossRef]
- Chenni, R.; Makhlouf, M.; Kerbache, T.; Bouzid, A. A Detailed Modeling Method for Photovoltaic Cells. Energy 2007, 32, 1724–1730. [Google Scholar] [CrossRef]
- Tobías-González, A.; Peña-Gallardo, R.; Morales-Saldaña, J.; Gutiérrez-Urueta, G. Modeling of a Wind Turbine with a Permanent Magnet Synchronous Generator for Real Time Simulations. In Proceedings of the 2015 IEEE International Autumn Meeting on Power, Electronics and Computing (ROPEC 2015), Ixtapa, Mexico, 4–6 November 2015. [Google Scholar] [CrossRef]
- Tan, K.; Islam, S. Optimum Control Strategies in Energy Conversion of PMSG Wind Turbine System without Mechanical Sensors. IEEE Trans. Energy Convers. 2004, 19, 392–399. [Google Scholar] [CrossRef]
- Rolán, A.; Luna, Á.; Vázquez, G.; Aguilar, D.; Azevedo, G. Modeling of a Variable Speed Wind Turbine with a Permanent Magnet Synchronous Generator. In Proceedings of the IEEE International Symposium on Industrial Electronics, Seoul, Korea, 5–8 July 2009; pp. 734–739. [Google Scholar] [CrossRef]
- Ko, H.S. Modeling and Control of PMSG-Based Variable-Speed Wind Turbine. In Wind Turbine Control and Monitoring; Springer: Berlin, Germany, 2014; pp. 3–21. [Google Scholar] [CrossRef]
- Ackermann, T. Wind Power in Power Systems; John Wiley & Sons, Ltd.: Hoboken, NJ, USA, 2005. [Google Scholar] [CrossRef]
- Krause, P.C.; Wasynczuk, O.; Sudhoff, S.D.; Pekarek, S. Analysis of Electric Machinery and Drive Systems; Institute of Electrical and Electronics Engineers, Inc.: Piscataway, NJ, USA, 2013. [Google Scholar] [CrossRef]
- Tobías-González, A.; Peña-Gallardo, R.; Morales-Saldaña, J.; Medina-Ríos, A.; Anaya-Lara, O. A State-Space Model and Control of a Full-Range PMSG Wind Turbine for Real-Time Simulations. Electr. Eng. 2018, 100, 2177–2191. [Google Scholar] [CrossRef]
- Peña, R.; Medina, A.; Anaya-Lara, O. A Methodology for the Efficient Computer Representation of Dynamic Power Systems: Application to Wind Parks. Wind Energy 2013, 16, 109–121. [Google Scholar] [CrossRef]
- Shiau, J.K.; Lee, M.Y.; Wei, Y.C.; Chen, B.C. Circuit Simulation for Solar Power Maximum Power Point Tracking with Different Buck-Boost Converter Topologies. Energies 2014, 7, 5027–5046. [Google Scholar] [CrossRef] [Green Version]
- Karami, N.; Moubayed, N.; Outbib, R. General Review and Classification of Different MPPT Techniques. Renew. Sustain. Energy Rev. 2017, 68, 1–18. [Google Scholar] [CrossRef]
- Mohapatra, A.; Nayak, B.; Das, P.; Mohanty, K.B. A Review on MPPT Techniques of PV System under Partial Shading Condition. Renew. Sustain. Energy Rev. 2017, 80, 854–867. [Google Scholar] [CrossRef]
- Reza Reisi, A.; Hassan Moradi, M.; Jamasb, S. Classification and Comparison of Maximum Power Point Tracking Techniques for Photovoltaic System: A Review. Renew. Sustain. Energy Rev. 2013, 19, 433–443. [Google Scholar] [CrossRef]
- Pagola-Torres, V.; Pena-Gallardo, R.; Segundo-Ramírez, J. Low Voltage Ride-through Analysis in Real Time of a PV-Wind Hybrid System. In Proceedings of the 2015 IEEE International Autumn Meeting on Power, Electronics and Computing (ROPEC 2015), At Ixtapa, México, 4–6 November 2015. [Google Scholar] [CrossRef]
- Rajapakse, A.D.; Muthumuni, D. Simulation Tools for Photovoltaic System Grid Integration Studies. In Proceedings of the 2009 IEEE Electrical Power and Energy Conference (EPEC 2009), Montreal, QC, Canada, 22–23 October 2009. [Google Scholar] [CrossRef]
- Sera, D.; Mathe, L.; Kerekes, T.; Spataru, S.V.; Teodorescu, R. On the Perturb-and-Observe and Incremental Conductance Mppt Methods for PV Systems. IEEE J. Photovolt. 2013, 3, 1070–1078. [Google Scholar] [CrossRef]
- Muyeen, S.M.; Takahashi, R.; Murata, T.; Tamura, J. Transient Stability Enhancement of Variable Speed Wind Turbine Driven PMSG with Rectifier-Boost Converter-Inverter. In Proceedings of the 2008 International Conference on Electrical Machines (ICEM’08), Vilamoura, Portugal, 6–9 September 2008. [Google Scholar] [CrossRef]
- Boost, M.A.; Ziogas, P.D. State-of-the-Art Carrier PWM Techniques: A Critical Evaluation. IEEE Trans. Ind. Appl. 1988, 24, 271–280. [Google Scholar] [CrossRef]
- Rodríguez, P.; Timbus, A.V.; Teodorescu, R.; Liserre, M.; Blaabjerg, F. Independent PQ Control for Distributed Power Generation Systems under Grid Faults. In Proceedings of the IECON Proceedings (Industrial Electronics Conference), Paris, France, 6–10 November 2006; pp. 5185–5190. [Google Scholar] [CrossRef]
- Vazquez, S.; Sanchez, J.A.; Carrasco, J.M.; Leon, J.I.; Galvan, E. A Model-Based Direct Power Control for Three-Phase Power Converters. IEEE Trans. Ind. Electron. 2008, 55, 1647–1657. [Google Scholar] [CrossRef]
- Conroy, J.F.; Watson, R. Low-Voltage Ride-through of a Full Converter Wind Turbine with Permanent Magnet Generator. IET Renew. Power Gener. 2007, 1, 182–189. [Google Scholar] [CrossRef]
- Arduino. Arduino Due: Overview. Available online: https://www.arduino.cc/en/Main/ArduinoBoardDue (accessed on 10 December 2018).
- Kuffel, R.; Giesbrecht, J.; Maguire, T.; Wierckx, R.P.; McLaren, P. RTDS-a fully digital power system simulator operating in real time. In Proceedings of the 1995 International Conference on Energy Management and Power Delivery EMPD’95, Singapore, 21–23 November 1995; pp. 498–503. [Google Scholar] [CrossRef]
- Jeffrey, A. The Z-Transform. In Handbook of Mathematical Formulas and Integrals; Academic Press: Cambridge, MA, USA, 2004. [Google Scholar] [CrossRef]
- RTDS Technologies Inc. Real-Time Digital Simulator Tutorial Manual; RSCAD Version 5; RTDS Technologies Inc.: Winnipeg, MB, Canada, 2016. [Google Scholar]
Figure 1.
Hybrid photovoltaic (PV)–wind generation system configuration.

Figure 2.
Scheme of a PV cell.

Figure 3.
Equivalent circuits of a permanent magnet synchronous generator (PMSG), (a) q-axis, (b) d-axis, and (c) 0-axis.
Figure 3.
Equivalent circuits of a permanent magnet synchronous generator (PMSG), (a) q-axis, (b) d-axis, and (c) 0-axis.

Figure 4.
The buck converter and the maximum power point tracking (MPPT) control scheme.

Figure 5.
Bode plot of the low-pass filter.

Figure 6.
Flow chart of the incremental conductance method.

Figure 7.
Boost converter and the average current control scheme.

Figure 8.
Bode plot for the KiL controller.

Figure 9.
Bode plot for the KVo controller.

Figure 10.
DC-link voltage control loop.

Figure 11.
Reactive power control loop.

Figure 12.
Schematic diagram of, (a) the Giga-Transceiver Analogue Output (GTAO), and (b) Input (GTAI) cards in RSCAD.
Figure 12.
Schematic diagram of, (a) the Giga-Transceiver Analogue Output (GTAO), and (b) Input (GTAI) cards in RSCAD.

Figure 13.
Schematic diagram of an Arduino Due card [53].
Figure 13.
Schematic diagram of an Arduino Due card [53].

Figure 14.
Real-time digital simulator (RTDS) station and Arduino Due card connection scheme.

Figure 15.
RTDS signal adjustment from the Arduino Due card.

Figure 16.
Methodology for the Arduino Due connection with the RTDS.

Figure 17.
Variations in the weather conditions, (a) wind speed, and (b) solar irradiation.

Figure 18.
Voltage tracking in terminals of the PV array by the Kv controller, (a) reference signal, and (b) percent error.
Figure 18.
Voltage tracking in terminals of the PV array by the Kv controller, (a) reference signal, and (b) percent error.

Figure 19.
Behavior of the electrical variables of the PV array, (a) voltage, and (b) current.

Figure 20.
Voltage tracking at the output of the DC–DC boost converter, (a) reference signal, and (b) percent error.
Figure 20.
Voltage tracking at the output of the DC–DC boost converter, (a) reference signal, and (b) percent error.

Figure 21.
Electrical variables of the PMSG, (a) phase voltage and current, and (b) rectified voltage.
Figure 21.
Electrical variables of the PMSG, (a) phase voltage and current, and (b) rectified voltage.

Figure 22.
Performance of the controls for the three-phase inverter, (a) voltage, and (b) reactive power.
Figure 22.
Performance of the controls for the three-phase inverter, (a) voltage, and (b) reactive power.

Figure 23.
Active and reactive power generated by the hybrid PV–wind system transferred through the transformer.
Figure 23.
Active and reactive power generated by the hybrid PV–wind system transferred through the transformer.

Table 1.
Output signal adjustment from the RTDS through the GTAO card.
| Signal | Value Range | GTAO Gain |
|---|---|---|
| VRefMPPT | 0–2 | 3.39 |
| ViPV | 0–2 | 3.39 |
| VRefBoost | 0–1000 | 1696.97 |
| VBusDC | 0–1000 | 1696.97 |
| ViBoost | 0–500 | 848.485 |
| ILBoost | 0–800 | 1357.58 |
Table 2.
Output signal adjustment from the RTDS through the GTAO card.
| Signal | Value Range | GTAI Gain |
|---|---|---|
| ImBoost | 0.55–2.75 V | 1.652 |
| ImBuck | 0.55–2.75 V | 1.652 |
© 2019 by the authors. Licensee MDPI, Basel, Switzerland. This article is an open access article distributed under the terms and conditions of the Creative Commons Attribution (CC BY) license (http://creativecommons.org/licenses/by/4.0/).
Share and Cite
MDPI and ACS Style
Pagola, V.; Peña, R.; Segundo, J.; Ospino, A. Rapid Prototyping of a Hybrid PV–Wind Generation System Implemented in a Real-Time Digital Simulation Platform and Arduino. Electronics 2019, 8, 102. https://doi.org/10.3390/electronics8010102
AMA Style
Pagola V, Peña R, Segundo J, Ospino A. Rapid Prototyping of a Hybrid PV–Wind Generation System Implemented in a Real-Time Digital Simulation Platform and Arduino. Electronics. 2019; 8(1):102. https://doi.org/10.3390/electronics8010102
Chicago/Turabian StylePagola, Víctor, Rafael Peña, Juan Segundo, and Adalberto Ospino. 2019. "Rapid Prototyping of a Hybrid PV–Wind Generation System Implemented in a Real-Time Digital Simulation Platform and Arduino" Electronics 8, no. 1: 102. https://doi.org/10.3390/electronics8010102
Note that from the first issue of 2016, this journal uses article numbers instead of page numbers. See further details here.