Article

Shannon Entropy Index and a Fuzzy Logic System for the Assessment of Stator Winding Short-Circuit Faults in Induction Motors

by
Arturo Mejia-Barron
1,
J. Jesus de Santiago-Perez
1,
David Granados-Lieberman
2,
Juan P. Amezquita-Sanchez
1 and
Martin Valtierra-Rodriguez
1,*
1
ENAP-Research Group, CA-Sistemas Dinámicos, Facultad de Ingeniería, Universidad Autónoma de Querétaro (UAQ), Campus San Juan del Río, Río Moctezuma 249, Col. San Cayetano, San Juan del Río, Qro., C. P. 76807, Mexico
2
ENAP-Research Group, CA-Fuentes Alternas y Calidad de la Energía Eléctrica, Departamento de Ingeniería Electromecánica, Instituto Tecnológico Superior de Irapuato (ITESI), Carr. Irapuato-Silao km 12.5, Colonia El Copal, Irapuato, Guanajuato C. P. 36821, Mexico
*
Author to whom correspondence should be addressed.
Electronics 2019, 8(1), 90; https://doi.org/10.3390/electronics8010090
Submission received: 28 November 2018 / Revised: 5 January 2019 / Accepted: 9 January 2019 / Published: 15 January 2019
(This article belongs to the Special Issue Signal Processing and Analysis of Electrical Circuit)

Abstract

:
The induction motor (IM) is one of the most important elements in industry. Although IMs are robust machines, they are susceptible to faults, where the stator winding short-circuit fault is one of the most common ones. In this work, the Shannon entropy (SE) index and a fuzzy logic (FL) system are proposed to diagnose short-circuit faults, considering both different severity levels and different load conditions. In the proposed methodology, a filtering stage based on brick-wall band-pass filters is firstly carried out. After this stage, the SE index is computed to quantify the fault severity and a FL system is applied to diagnose the IM condition in an automatic way. Unlike other works that propose some types of space transformations, the proposal is only based on a filtering stage and a time domain index, requiring low computational resources. The obtained results demonstrate the effectiveness of the proposal, i.e., the SE index quantifies the fault severity, regardless of the mechanical load, and the proposed FL system achieves a positive classification rate of 98%.

1. Introduction

In recent years, the development of monitoring systems to assess the physical condition of rotatory machinery has been vital to guaranteeing the reliability of industrial processes [1,2,3]. Among the rotatory machinery, the three-phase induction motor (IM), representing ~85% of the consumed power in the industry, is a default implementation in industrial processes [4] because it offers great benefits, such as low maintenance, low cost, high robustness to aggressive environments and easy control under different load conditions [5,6]. Despite these great benefits, IMs are susceptible to present electrical and mechanical faults during their service-life, which are produced mainly by power quality problems, prolonged activity times and harsh operating conditions, among other factors [1,2,3,5,6]. Regarding electrical faults, stator winding faults (SWFs) are one of the most dangerous and common faults in IMs [7], representing about a 36–38% of faults that can take place [8,9]. This fault, even in its incipient/early state, can produce alterations and increments in current consumption, temperature and vibrations, putting at risk the personnel, the production, the machine itself and other machines in the same line of production.
During the last 15 years, an important number of techniques and methodologies for SWF detection using the analysis of acoustic, current and vibration signals have been proposed [10,11,12,13,14]. Motor current signature analysis (MCSA) is one of the most used methods because of its advantages, such as possessing a non-invasive capacity, possible remote sensing, easy implementation and low implementation costs [2,9]. MCSA is mainly used to identify faults in the IM according to the analysis of frequency components found in the measured signal. Particularly, MCSA for SWF detection is employed to identify frequencies around the fundamental frequency or harmonic components [15]. In the literature, diverse signal processing algorithms for stator winding short-circuit (SWSC) fault detection using MCSA have been introduced; for instance, fast Fourier transform (FFT) [14,16,17], wavelet transform (WT) [18,19,20], empirical mode decomposition-based methods (EMD) [21,22], Wigner-Ville distribution (WVD) [22], Hilbert transform (HT) [23], statistical time series model (STSM) [24], and statistical analysis (SA) [25]. Despite obtaining promising results, diverse limitations still remain. For instance, the FFT is a proficient tool to analyze time signals with stationary properties; yet, current applications in industry require continuous changes of the load applied to IMs, which can generate fluctuations in the voltage and current signals, producing non-stationary properties, therefore making the FFT method unsuitable [26]. WT is a suitable tool for analyzing signals of non-stationary nature; regrettably, it requires a fine election of the decomposition level and the wavelet mother in order to estimate adequate features that allow for correct evaluation of the IM’s condition [27]. In this sense, EMD-based algorithms are used to analyze or decompose time signals of non-stationary nature according to their frequency components; yet, they are susceptible to present a phenomenon called mode mixing, which produces waves with different frequency components that are assigned to the same frequency band, complicating the identification of frequencies associated to the SWSC fault. Furthermore, the computational resources can increase depending on the EMD-method used, e.g., when the ensemble-EMD method is used [28]. HT is employed for obtaining the instantaneous frequency and the instantaneous amplitude of a time signal; but its results can be affected by the noise and the number of frequency components found in the analyzed signal [29]. WVD is a method capable of providing a time-frequency representation of time signals; yet, its results can be contaminated with spurious frequencies, frequency components that do not exist in the measured signal due to a problem called cross-term [30], compromising the ability for adequate location of the frequencies associated to the SWSC fault. STSMs are employed for modelling signals with a linear or time-invariant behavior; but, they can present problems for modelling nonlinear behaviors [31], which are greatly produced in an IM because of the dynamic loading. Further, their results are susceptible to errors due to the quantity of noise contained in the measured signal. The SA methods are employed for calculating statistical parameters of the time-domain signals, such as median, variance, standard deviation and among others, but their results can fail due to the noise and nonlinearities found in the time signal [32].
Although diverse methods for SWSC fault detection have been introduced in the literature, most of them are negatively affected by the non-stationary properties of the measured signal. These properties are generated by different factors, e.g., the variations in current consumption associated to changes in the mechanical load. In this regard, the proposal and development of efficient and reliable methodologies in terms of processing and performance are still required, mainly if they are not susceptible to the motor load, e.g., they have to be independent of the motor mechanical load in order to provide a consistent diagnosis for a large variety of industrial processes where the mechanical load can be different and time-variant.
In this paper, a new methodology to diagnose and quantify the severity of SWSC faults, where an independent fault indicator of the mechanical load is presented. The proposed methodology is based on MCSA, using the monitored current during the IM steady-state as input. It is based on three steps. Firstly, a filtering stage based on brick-wall band-pass filters is carried out. This type of filter is used as it presents great advantages, such as a rectangular frequency response and an abrupt transition between the pass and stop bands. Secondly, the Shannon entropy (SE) index is applied to the filtered signal in order to identify the short-circuit faults, considering both different severity levels and different load conditions. Other indices, such as the signal energy and the root mean square (RMS) value are tested and compared with the results obtained by the SE index. Finally, a fuzzy logic (FL) system is developed in order to classify the IM condition in an automatic way. The usefulness and effectiveness of the proposal is validated through experimentation, where a healthy (HLT) IM and an IM with short-circuited turns using four different levels of load are considered. The obtained results show that the proposal is an effective and consistent tool for diagnosing SWSC faults independently of load conditions, making it a promising solution for a large variety of industrial applications.

2. Theoretical Background

2.1. Motor Current Signal Analysis (MCSA)

MCSA is a widely used method for online condition monitoring in IMs, where the current spectra is used to obtain information associated to the motor fault. This fault information is obtained through abnormal harmonics in the stator current produced by the magnetomotive force distribution and the permeance-wave representation of the air gap [15,33].
Regarding the SWSC fault, signature patterns in different frequency components have been associated to the following equation [9,15,33]:
f s t   = f 1 { n p ( 1 s ) ± k }    k = 1 , 3 , 5 , n = 1 , 2 , 3 ,
where the values for fst are the frequency components due to the SWSC fault, f1 is the supply frequency, p is the pole-pairs and s is the slip. Different values for k and n can be tested in order to obtain the frequencies of interest, where promising results have been obtained for k = 1 with n = 3 and n = 5 [15].

2.2. Brick-Wall Filters

Brick-wall filters or sinc filters are idealized digital FIR (finite impulse response) filters with a rectangular frequency response, which provides an ideally flat amplitude response in the passband and an abrupt transition in the cutoff frequency [34]. Besides, a FIR filter is featured by its stability and linear phase. Then, an ideal brick-wall low-pass filter with bandwidth ωp and zero phase provides the impulse response, as per Reference [35]:
g ( t ) = ω p 2 sin ω p t ω p t
As the filter impulse response has an infinite length, making the structure implementation impossible [35], a window function w(t) of length τ is applied to g(t) to obtain a practical filter, which can be expressed as per Reference [35]:
h ( t ) = w ( t ) ω p 2 sin ω p t ω p t
By using two brick-wall low-pass filters, a brick-wall band-pass filter is obtained as follows:
h ( t ) B P = h ( t ) u h ( t ) l
where h(t)u and h(t)l are the upper and lower band edges, respectively.

2.3. Fault Indices

In the literature, several indices have been presented for fault diagnosis. In this work, the SE, energy and RMS indices, which have proven to be efficient in other electric applications related to the diagnosis of faults in induction motors and transformers [36,37,38,39], are analyzed as potential indicators to diagnose SWSC faults.
In the information theory, SE is used to describe the uncertainty of information content provided by an event or a signal [36]; as the SWSC fault generates different frequency components, the amount of information can change, making the SE index a promising fault indicator to quantify this change. It is given by:
SE ( X ) = i = 1 n p ( x i ) log 2 [ p ( x i ) ]
where x1, x2, x3, …, xn are the possible outcomes of an event or signal given by X, where p(xi) is the corresponding probability vector.
On the other hand, the energy and RMS indices are obtained by means of the following equations [37]:
Energy = i = 1 N [ x ( i ) ] 2
RMS = 1 N i = 1 N [ x ( i ) ] 2
where x(i) is the signal value at the sample i and N is the total number of samples. As can be noticed, these indices somehow increase their value according to the increments in the signal amplitude x(i); therefore, they can be sensitive to SWSC faults, considering that the presence of fault and its severity increase the signal amplitude from the increment of different frequency components.

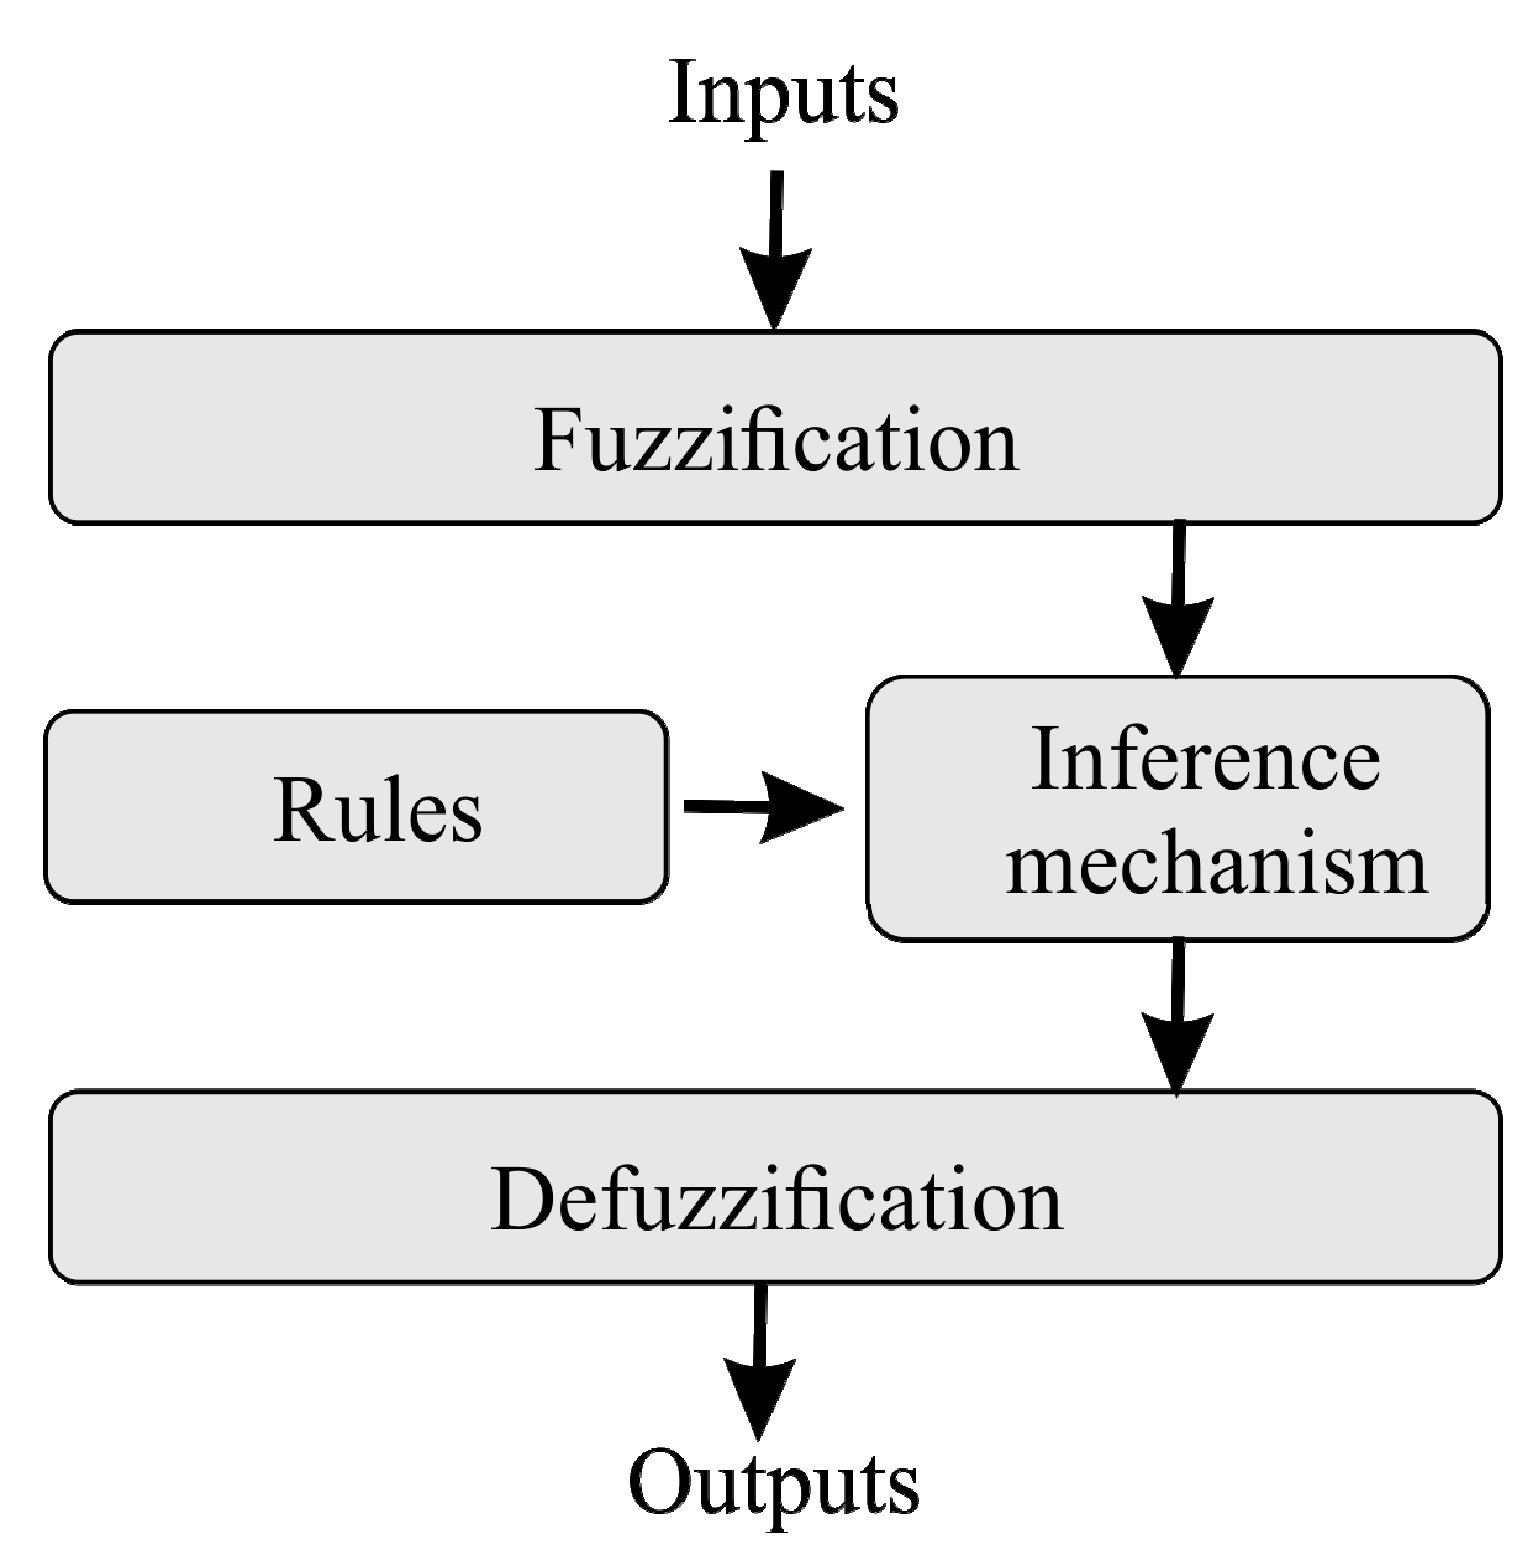
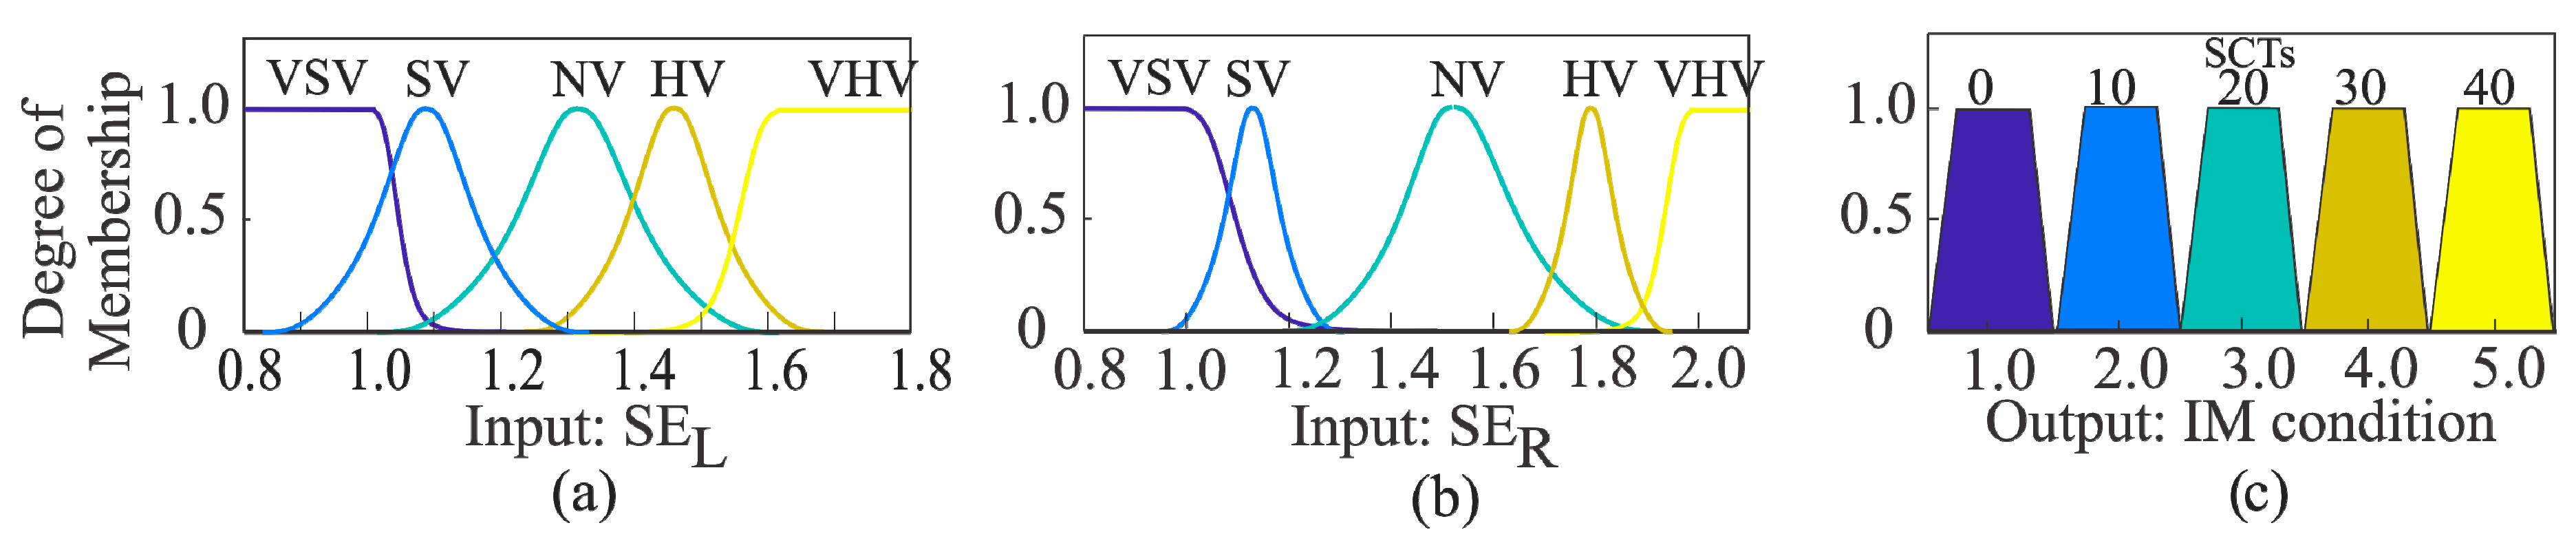
2.4. Fuzzy Logic Systems

In general, FL systems can be used as control strategies based exclusively on FL or in combination with other methods, such as neural networks (neuro-fuzzy systems) [40,41,42,43,44] or classification algorithms [5,26], where features such as simplicity and flexibility of design, handling of imprecise data and the capability to model nonlinear systems, among others, can be exploited. In particular, a classification task can be carried out if the information behavior is described using ‘if-then’ classification rules for when information about the input data is known. These rules describe the class of an object according to its features; for instance, if an object is high then its class is big.
FL systems consist of four stages: Fuzzification, rules, inference mechanism and defuzzification [5,44], as shown in Figure 1. In the fuzzification, the inputs are mapped into linguistic variables and quantified through membership functions. These functions can have Gaussian, triangular, trapezoidal or other shapes. As mentioned previously, the ‘if-then’ rules describe linguistically how an object has to be assigned to a specific class according to its features. These rules are set by an expert that knows the features and classes. In the inference mechanism, the decision-making process is carried out, giving a conclusion for a specific set of inputs. Finally, the conclusion is converted to understandable information for the user using the defuzzification stage. In this stage, there are several defuzzification methods, where the center-of-gravity method is one of the most popular.

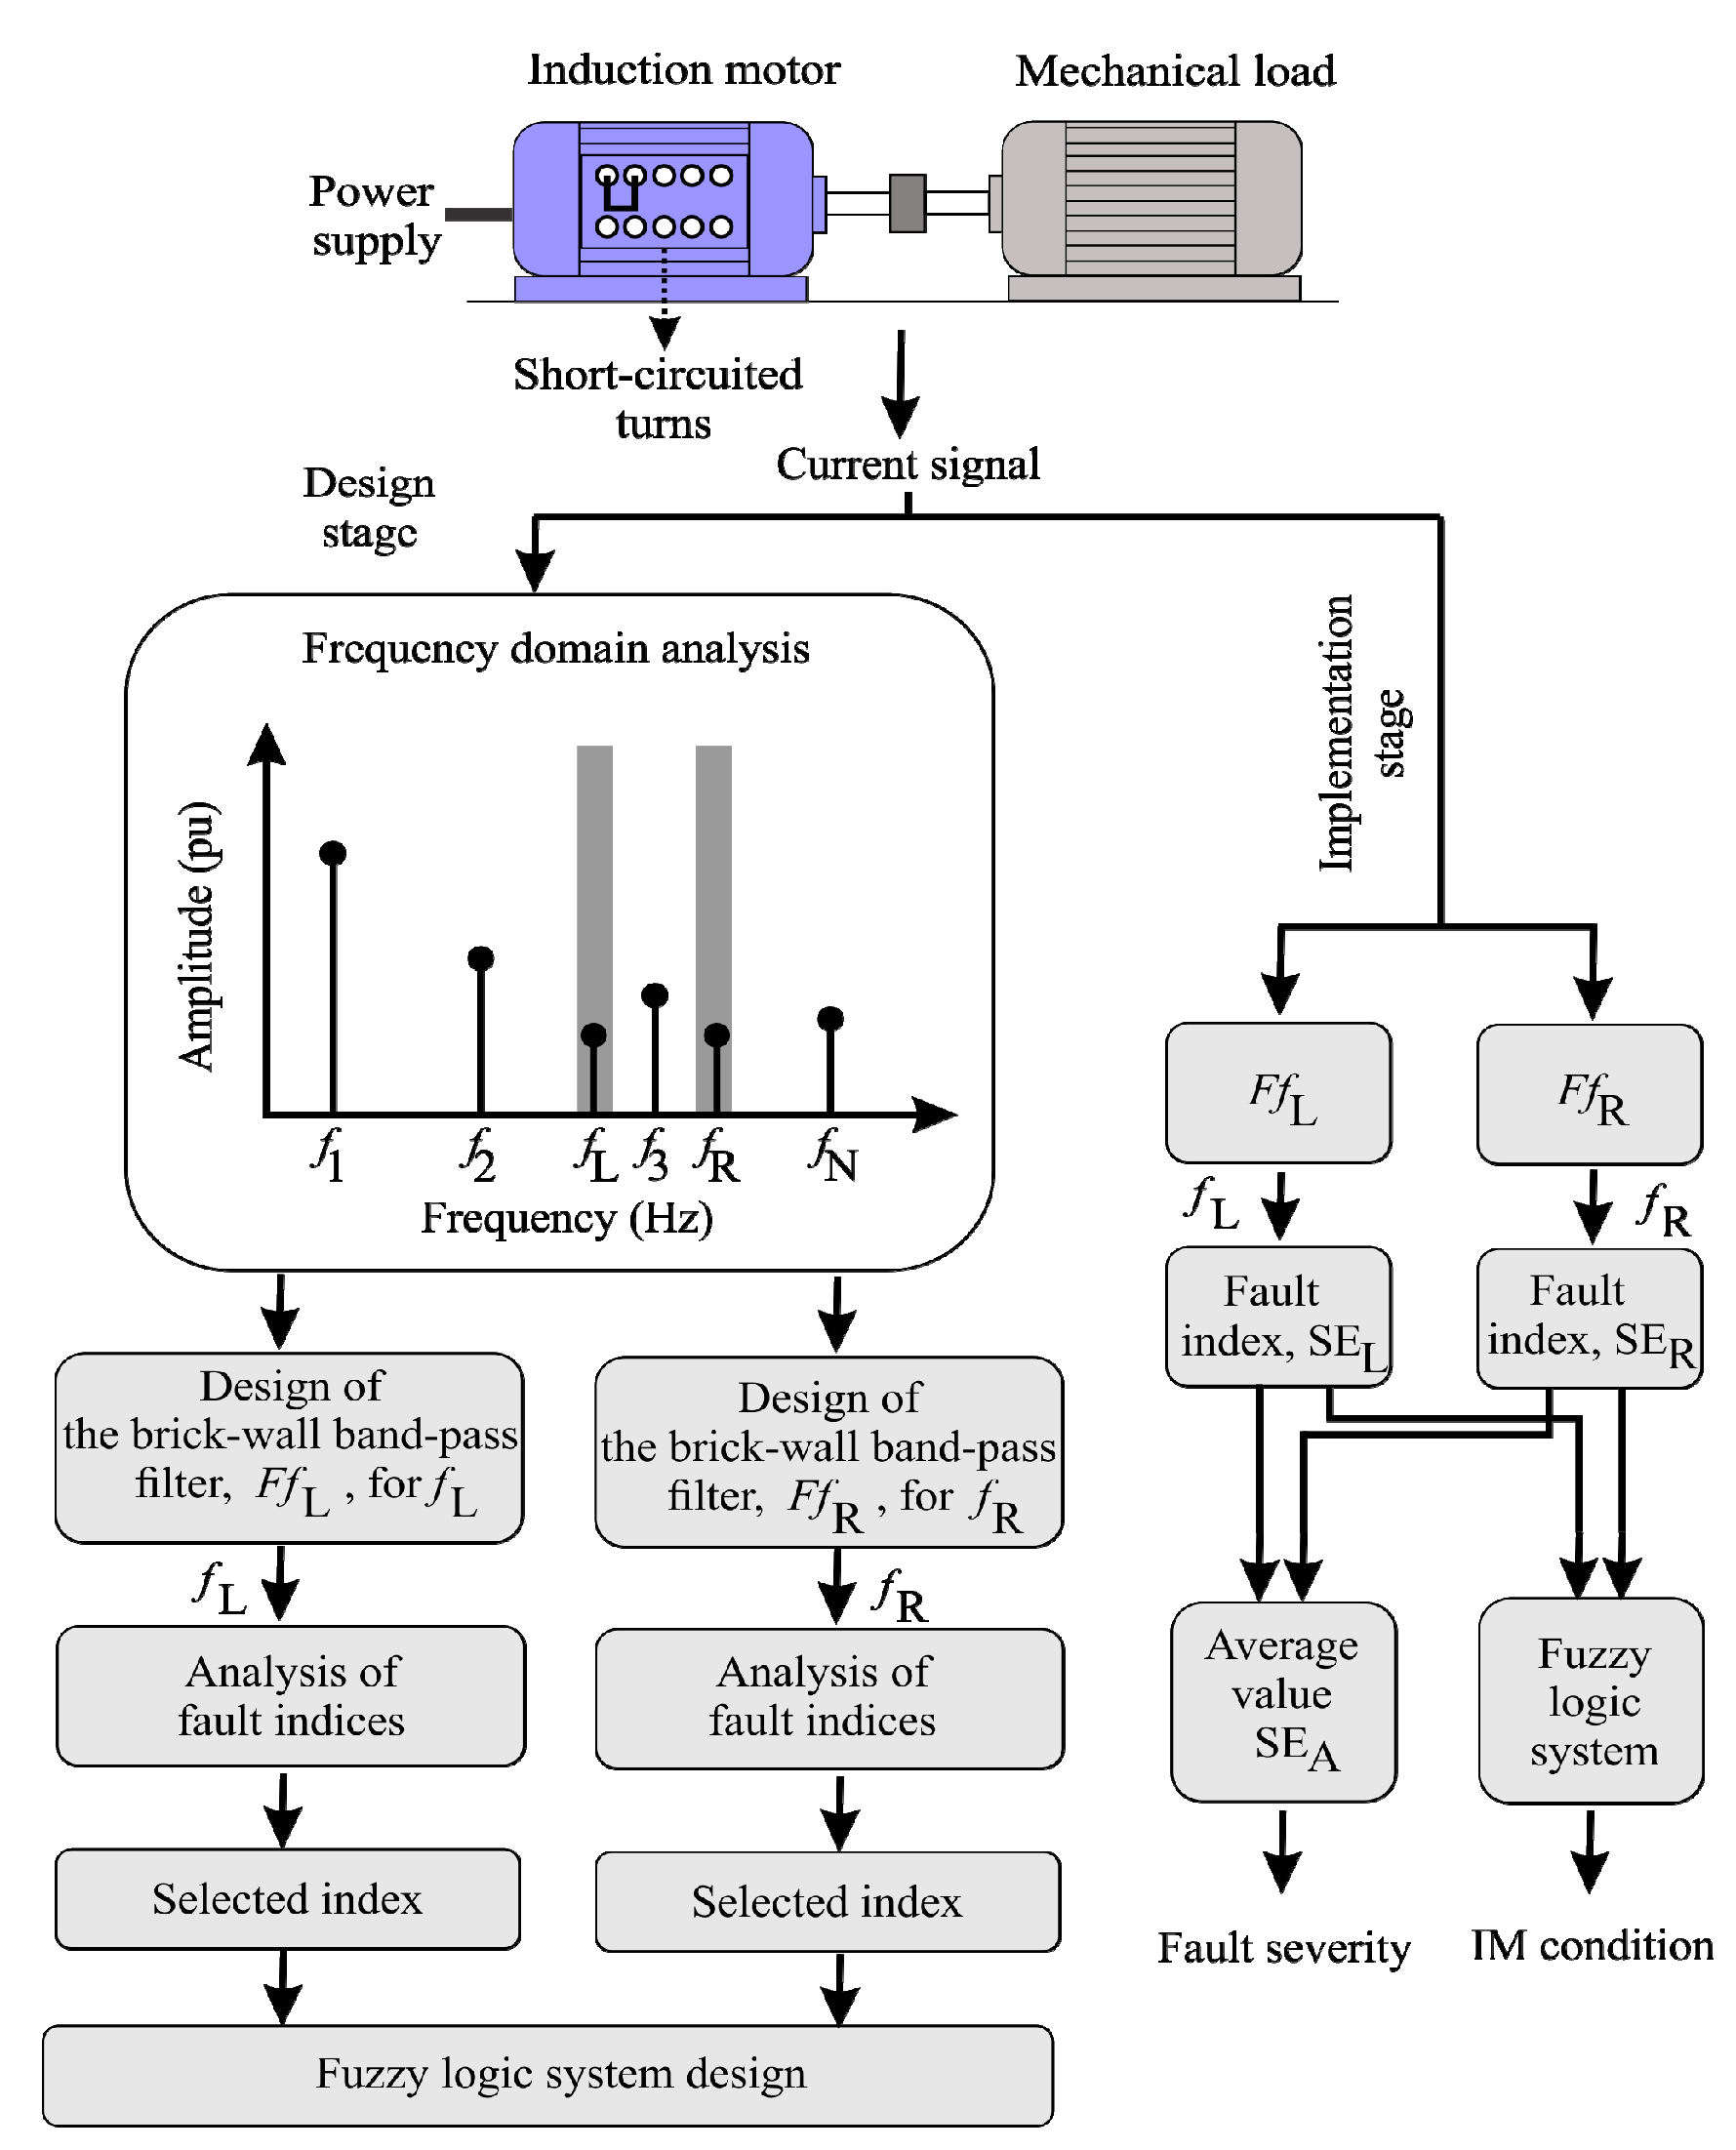
3. Proposed Methodology

The proposed methodology to detect SWSC faults in IMs is shown in Figure 2. In general, the methodology is divided into two stages: Design and implementation. In the design stage, the current signals of an IM, ranging from steady state to different fault severities, along with different load conditions are firstly acquired. Then, from the frequency domain analysis, and by following Equation (1), information related to the SWSC condition can be found in fL (k = 1 and n = 3) and fR (k = 1 and n = 5). In particular, an IM with two pairs of poles (p = 2) operating in an electric system where f = 60 Hz at no load condition (slip of s ≈ 0) presents information related to the SWSC fault, where fL = 150 and fR = 210. In this regard, two brick-wall band-pass filters (using Equation (4)) are constructed to extract that information. Figure 3 shows their design. In Figure 3a, the region of interest in the frequency domain (fL and fR) can be observed. As s in the IM can shift the fL and fR components, the brick-wall band-pass filters consider the bandwidths denoted by (fL_1,fL_2) and (fR_1,fR_2), respectively. By considering a wide range for s according to the nominal motor speed, the values of fL_1 = 160, fL_2 = 170, fR_1 = 200, and fR_2 = 210 are used. Figure 3b shows that the band-pass filter, FfL, is designed using the difference of two brick-wall low-pass filters with fL_1 and fL_2 as cutoff frequencies. In a similar way, the band-pass filter, FfR, is designed using fR_1 and fR_2. The order of the filters is set to 1024 in order to achieve a high attenuation in the stop band. Figure 3c shows the frequency responses for the two brick-wall band-pass filters. FfL is the filter that is constructed to extract the fL component and FfR is the filter that is constructed to extract the fR component. Once the filters are designed, the analysis of fault indices is carried out (see Figure 2); in order to do so, the SE, energy and RMS indices (using Equations (5)–(7) are applied to the filtered signals to determine which index presents the most discriminant information in terms of the fault severity and its susceptibility to the mechanical load. When the most appropriate index to diagnose the SWSC has been obtained, a FL system is designed to automatically determine the IM condition from the information provided by the selected index. The designed FL system consists of the stages presented in Figure 1, i.e., fuzzification, rules, inference mechanism and defuzzification. As the elements that compound each stage depend on the experimental results, they are described in detail in Section 4.3.
In the implementation stage, the designed filters, FfL and FfR, are applied to the input current signal (see Figure 2). Then, the selected index is computed for each frequency component, namely SEL for fL and SER for fR. Finally, on the one hand, the indices are averaged to provide an indicator that quantifies the fault severity, and on the other hand, the indices are analyzed by the FL system to determine the IM condition in an automatic way.

4. Experimentation and Results

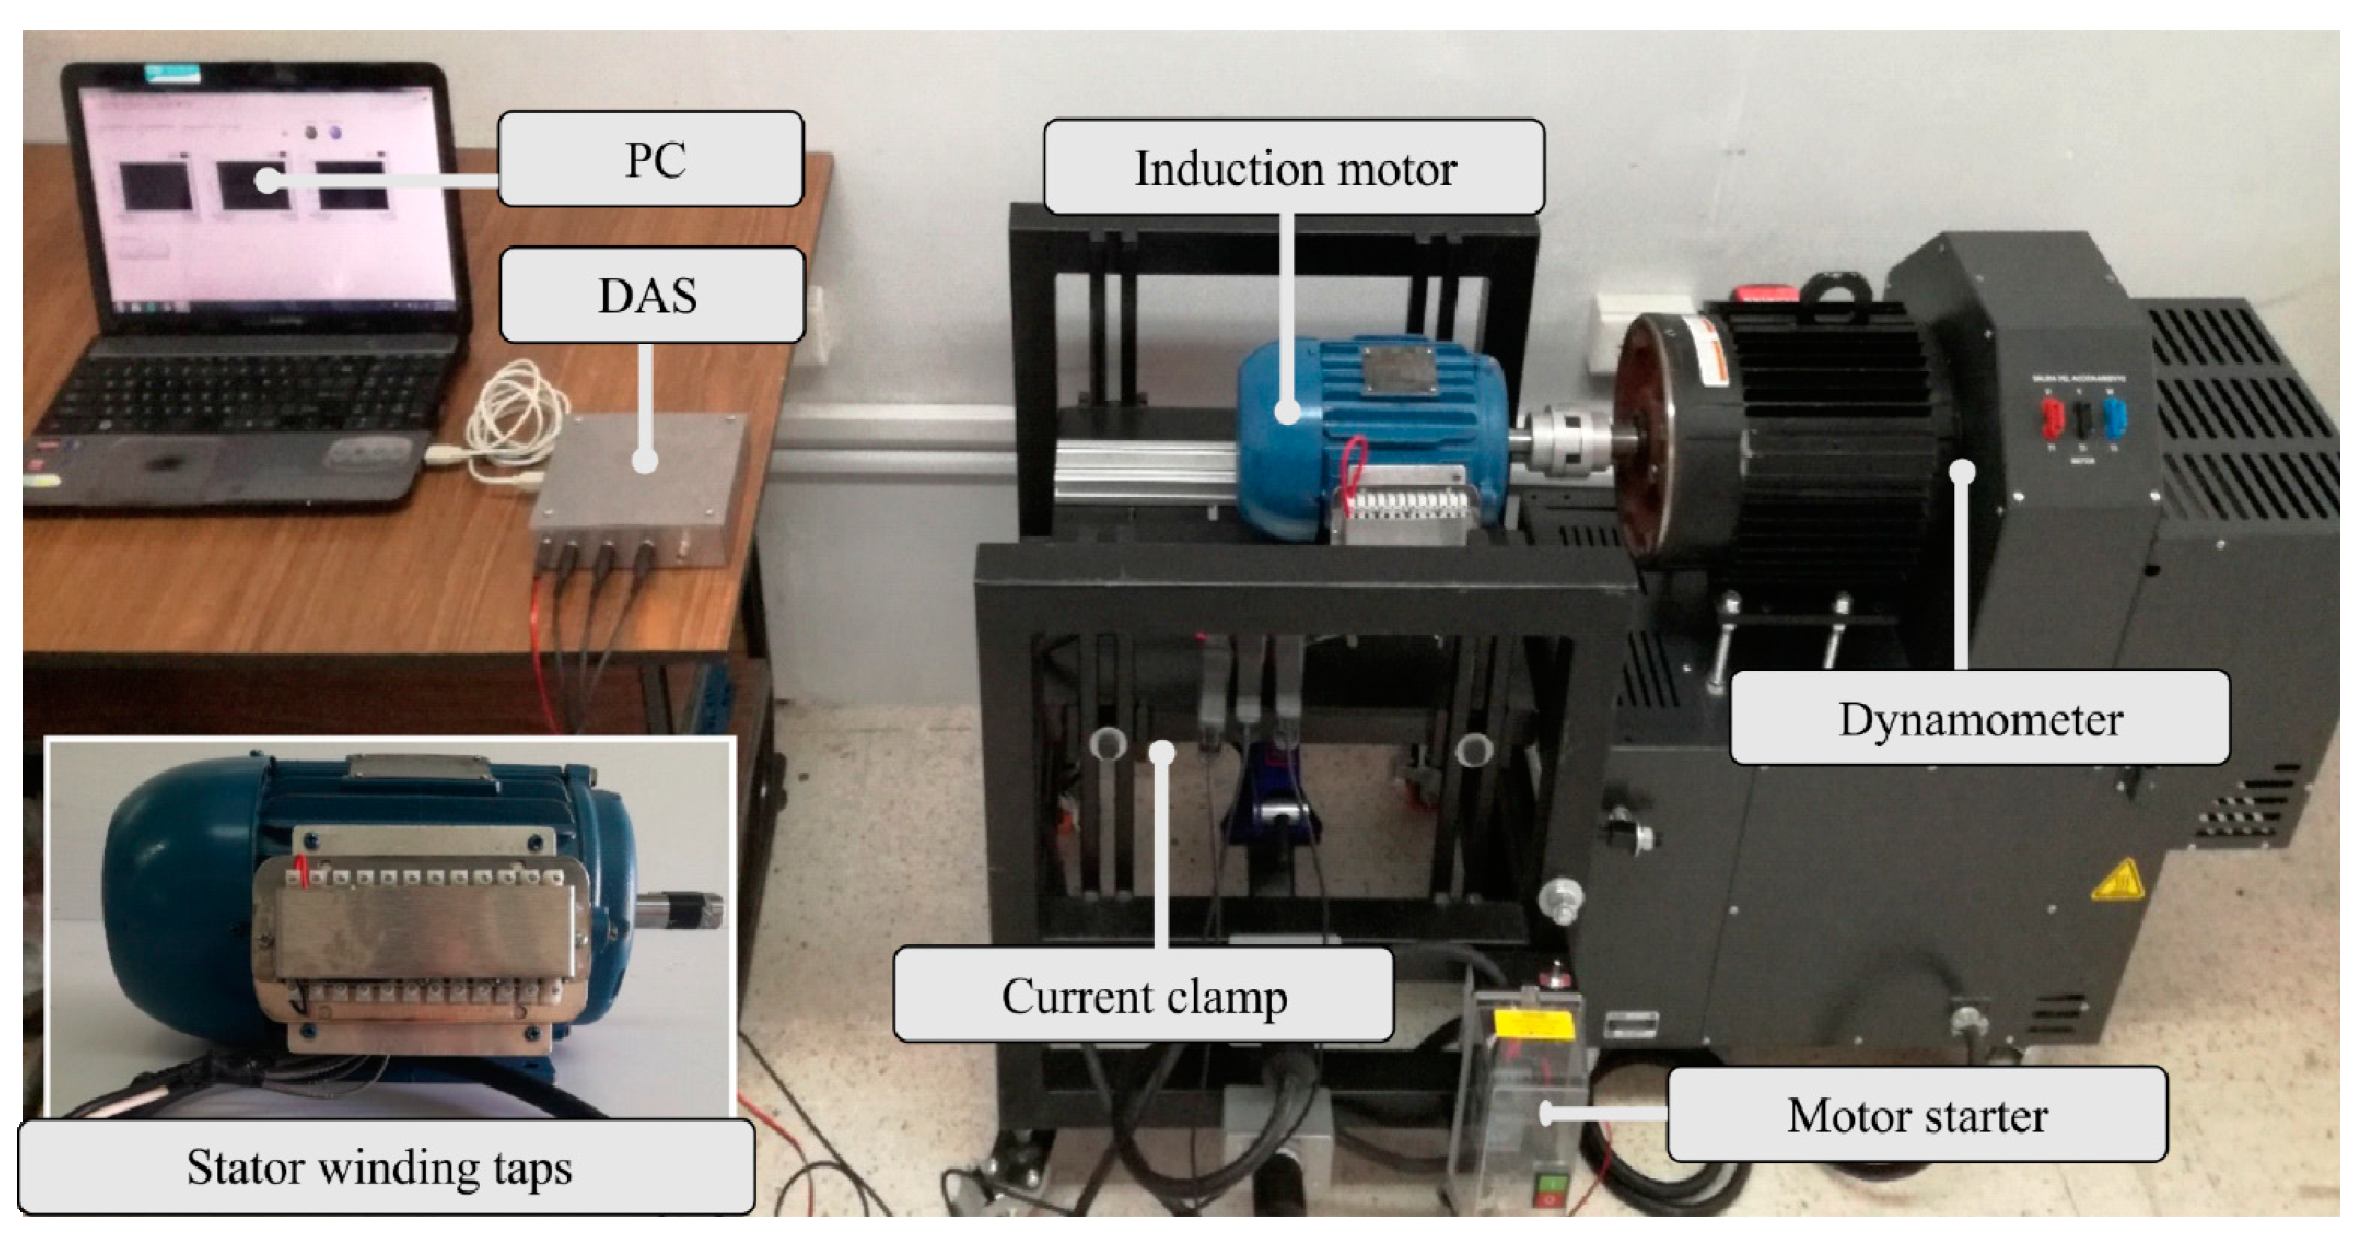
4.1. Experimental Setup

In Figure 4, the experimental setup used to test and validate the proposal is depicted. In general, it consists of: A personal computer (PC) to implement the analysis using MATLAB software, an IM in which the stator-winding has been modified with several taps, a motor starter, a data acquisition system (DAS) to acquire the current signals and a dynamometer to generate the mechanical load in a controlled way. The model of the used 3-phase IM was WEG 218ET3EM145TW, featuring 2 poles, 2 hp, 220 VAC and 60 Hz. The SWSC conditions were artificially produced with the insertion of taps in phase A. The analyzed taps correspond to 10, 20, 30 and 40 short-circuited turns (SCTs). The current signal was acquired using a model i200 current clamp from Fluke, a 16-bit analog-to-digital converter model which was incorporated in the NI-USB 6211 board from National Instruments, and a sampling frequency of 6000 samples/s during a time window of 1 s. For the analysis, twenty tests for each motor condition (0, 10, 20, 30 and 40 SCTs) were carried out; therefore, 100 tests were analyzed. Regarding the mechanical load, it was provided by a four-quadrant model 8540 dynamometer from Lab-Volt, where 0.00, 2.04, 4.09 and 6.13 Nm were used as the load torques. These values ranged from no-load to nominal load.
Figure 5 shows an example of the acquired current signals, where it was observed that the magnitude of the current signal increased with both the mechanical load and the fault severity. This is very important, as the proposed methodology has to be capable of detecting the SCTs regardless of the mechanical load. For instance, a methodology based on the magnitude of the current signal is inappropriate as the fault can be confused with an increment in the load.

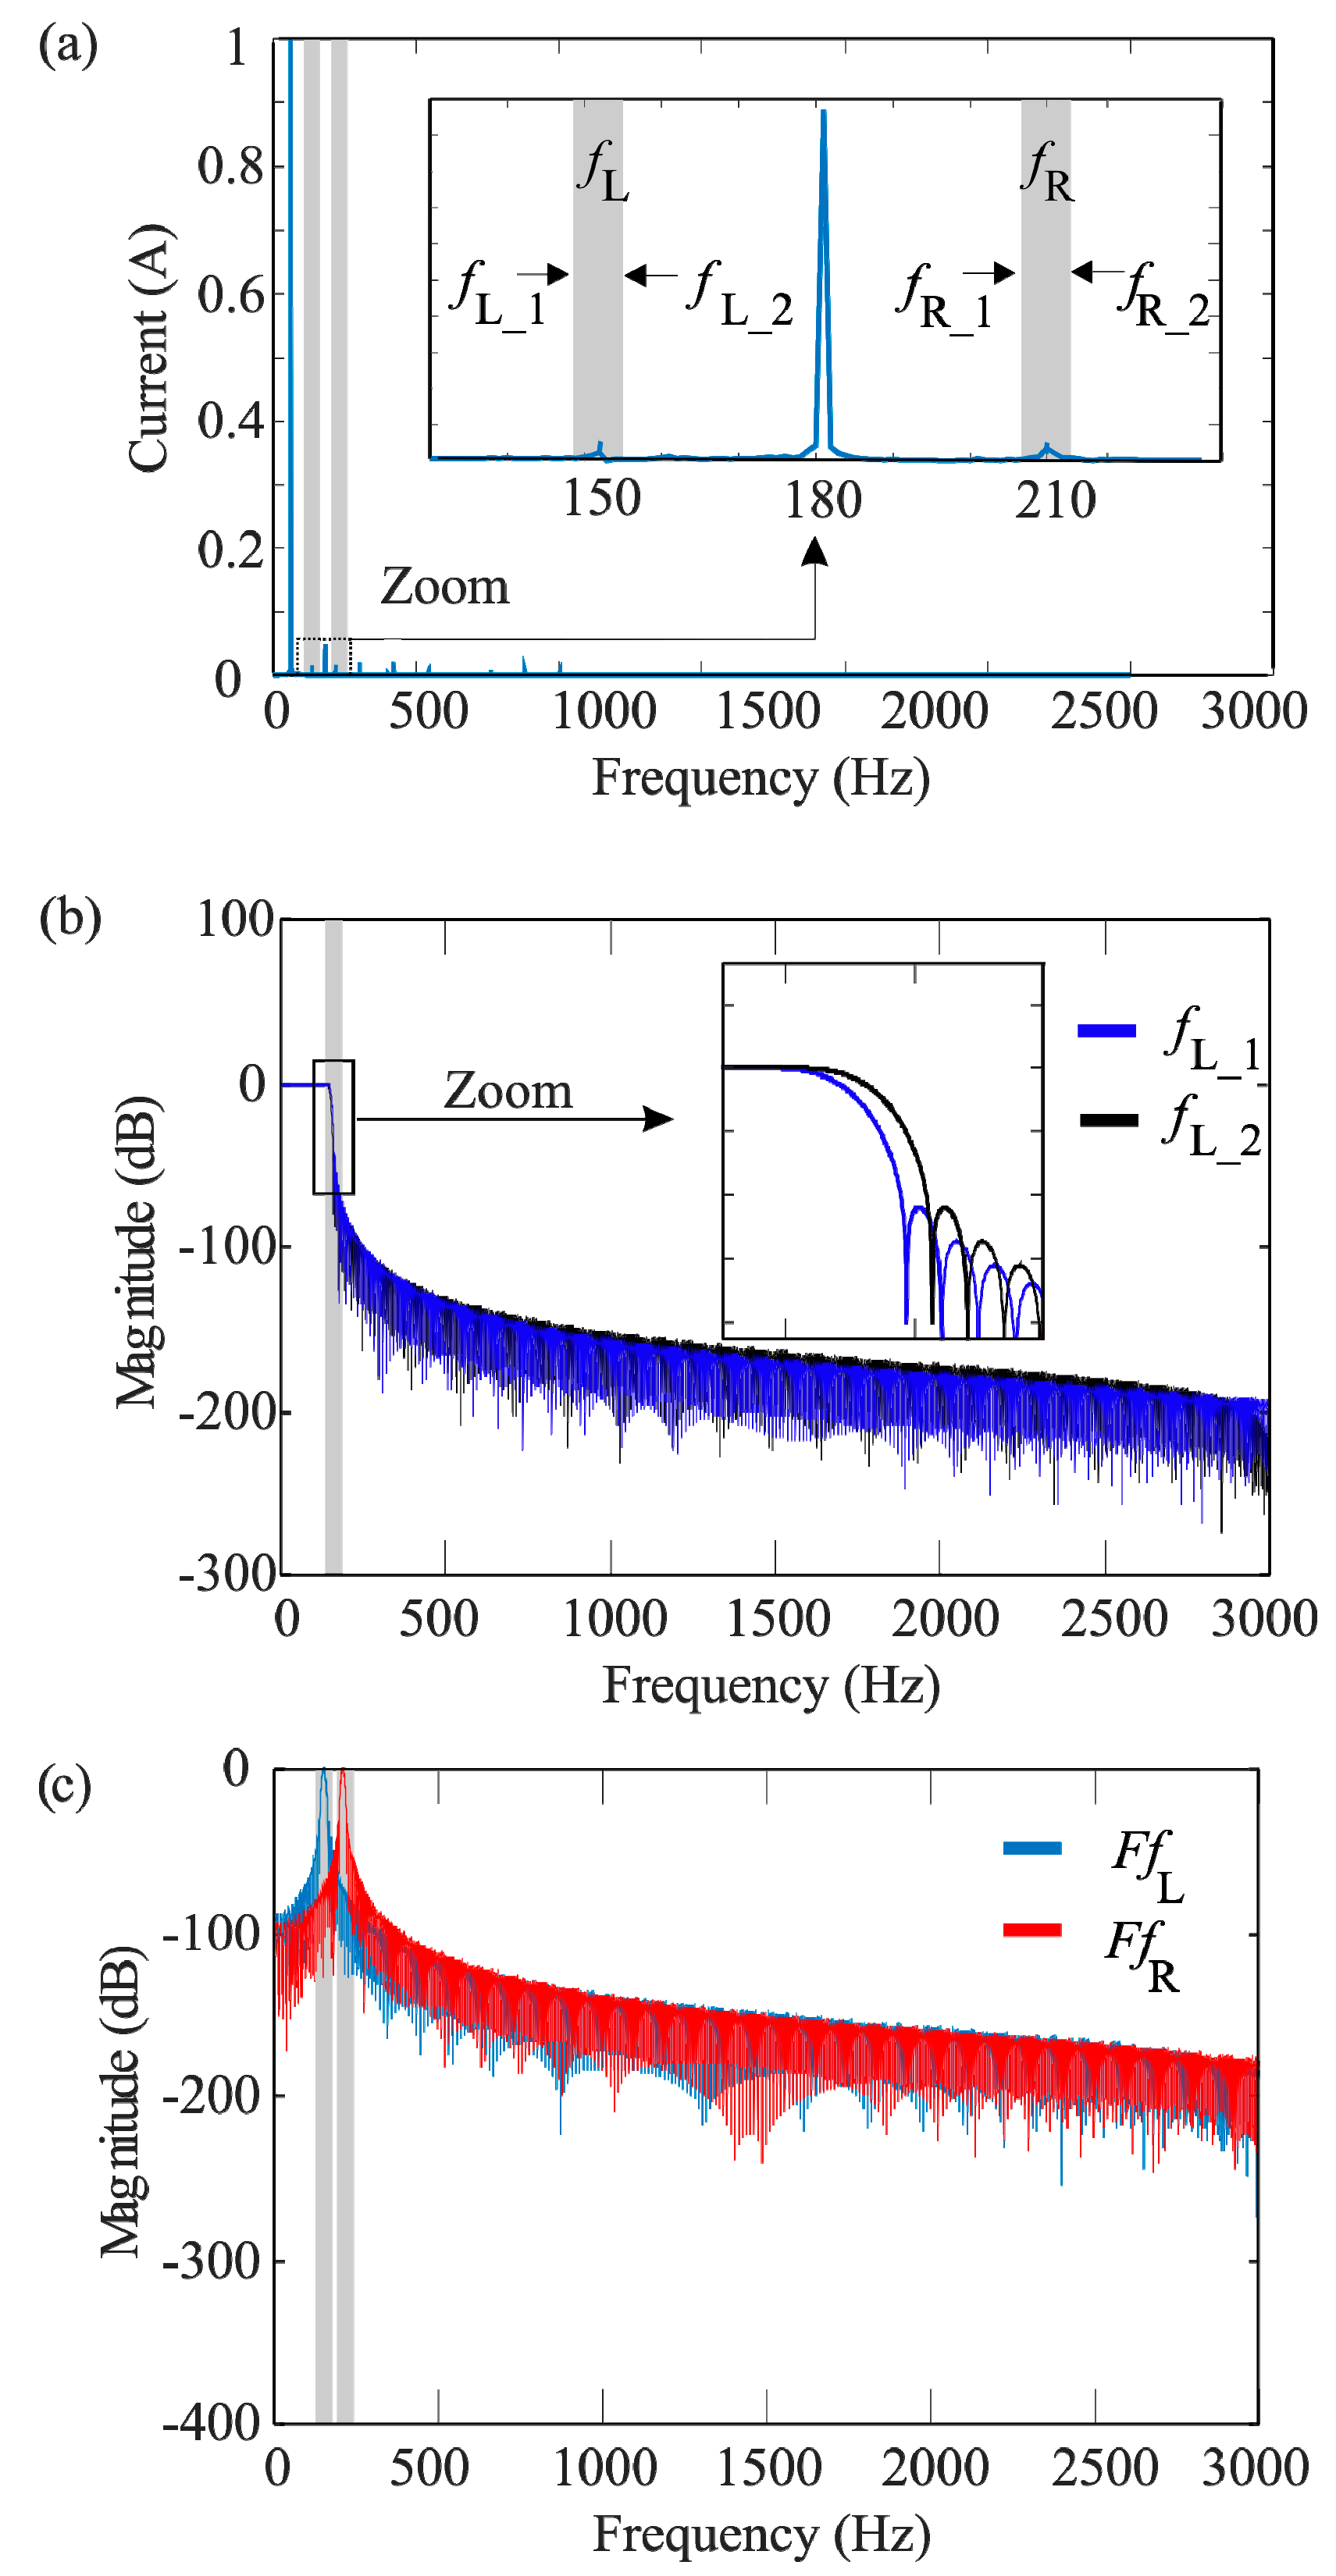
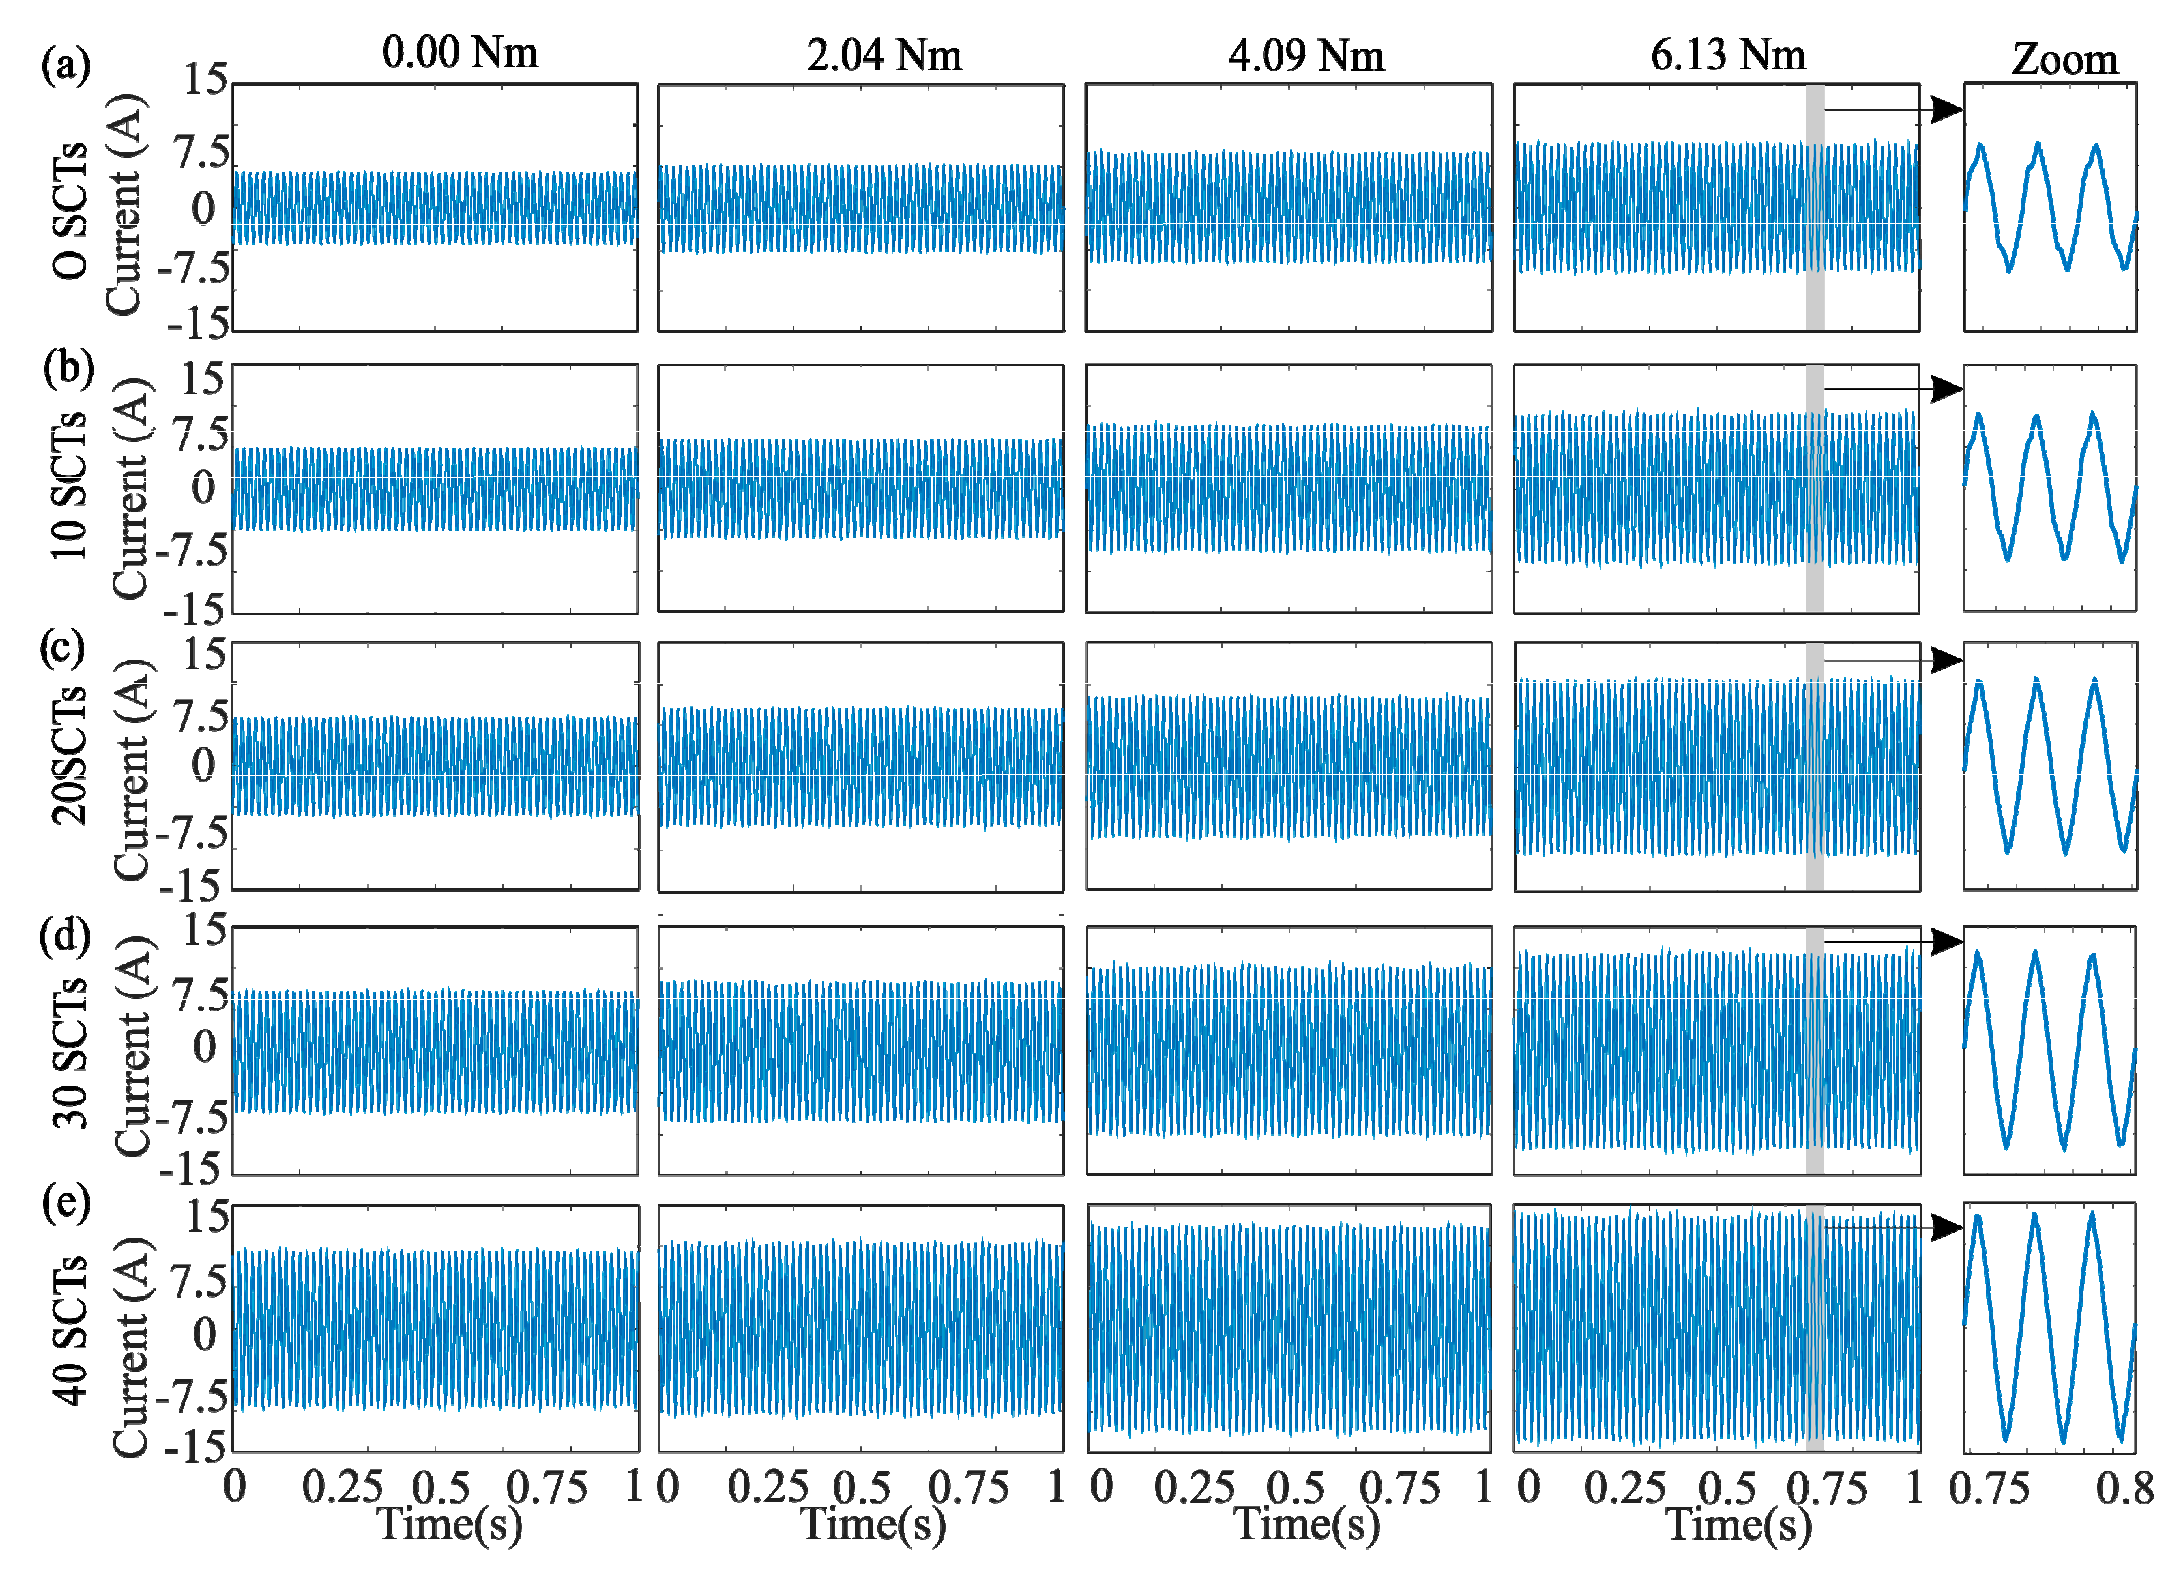
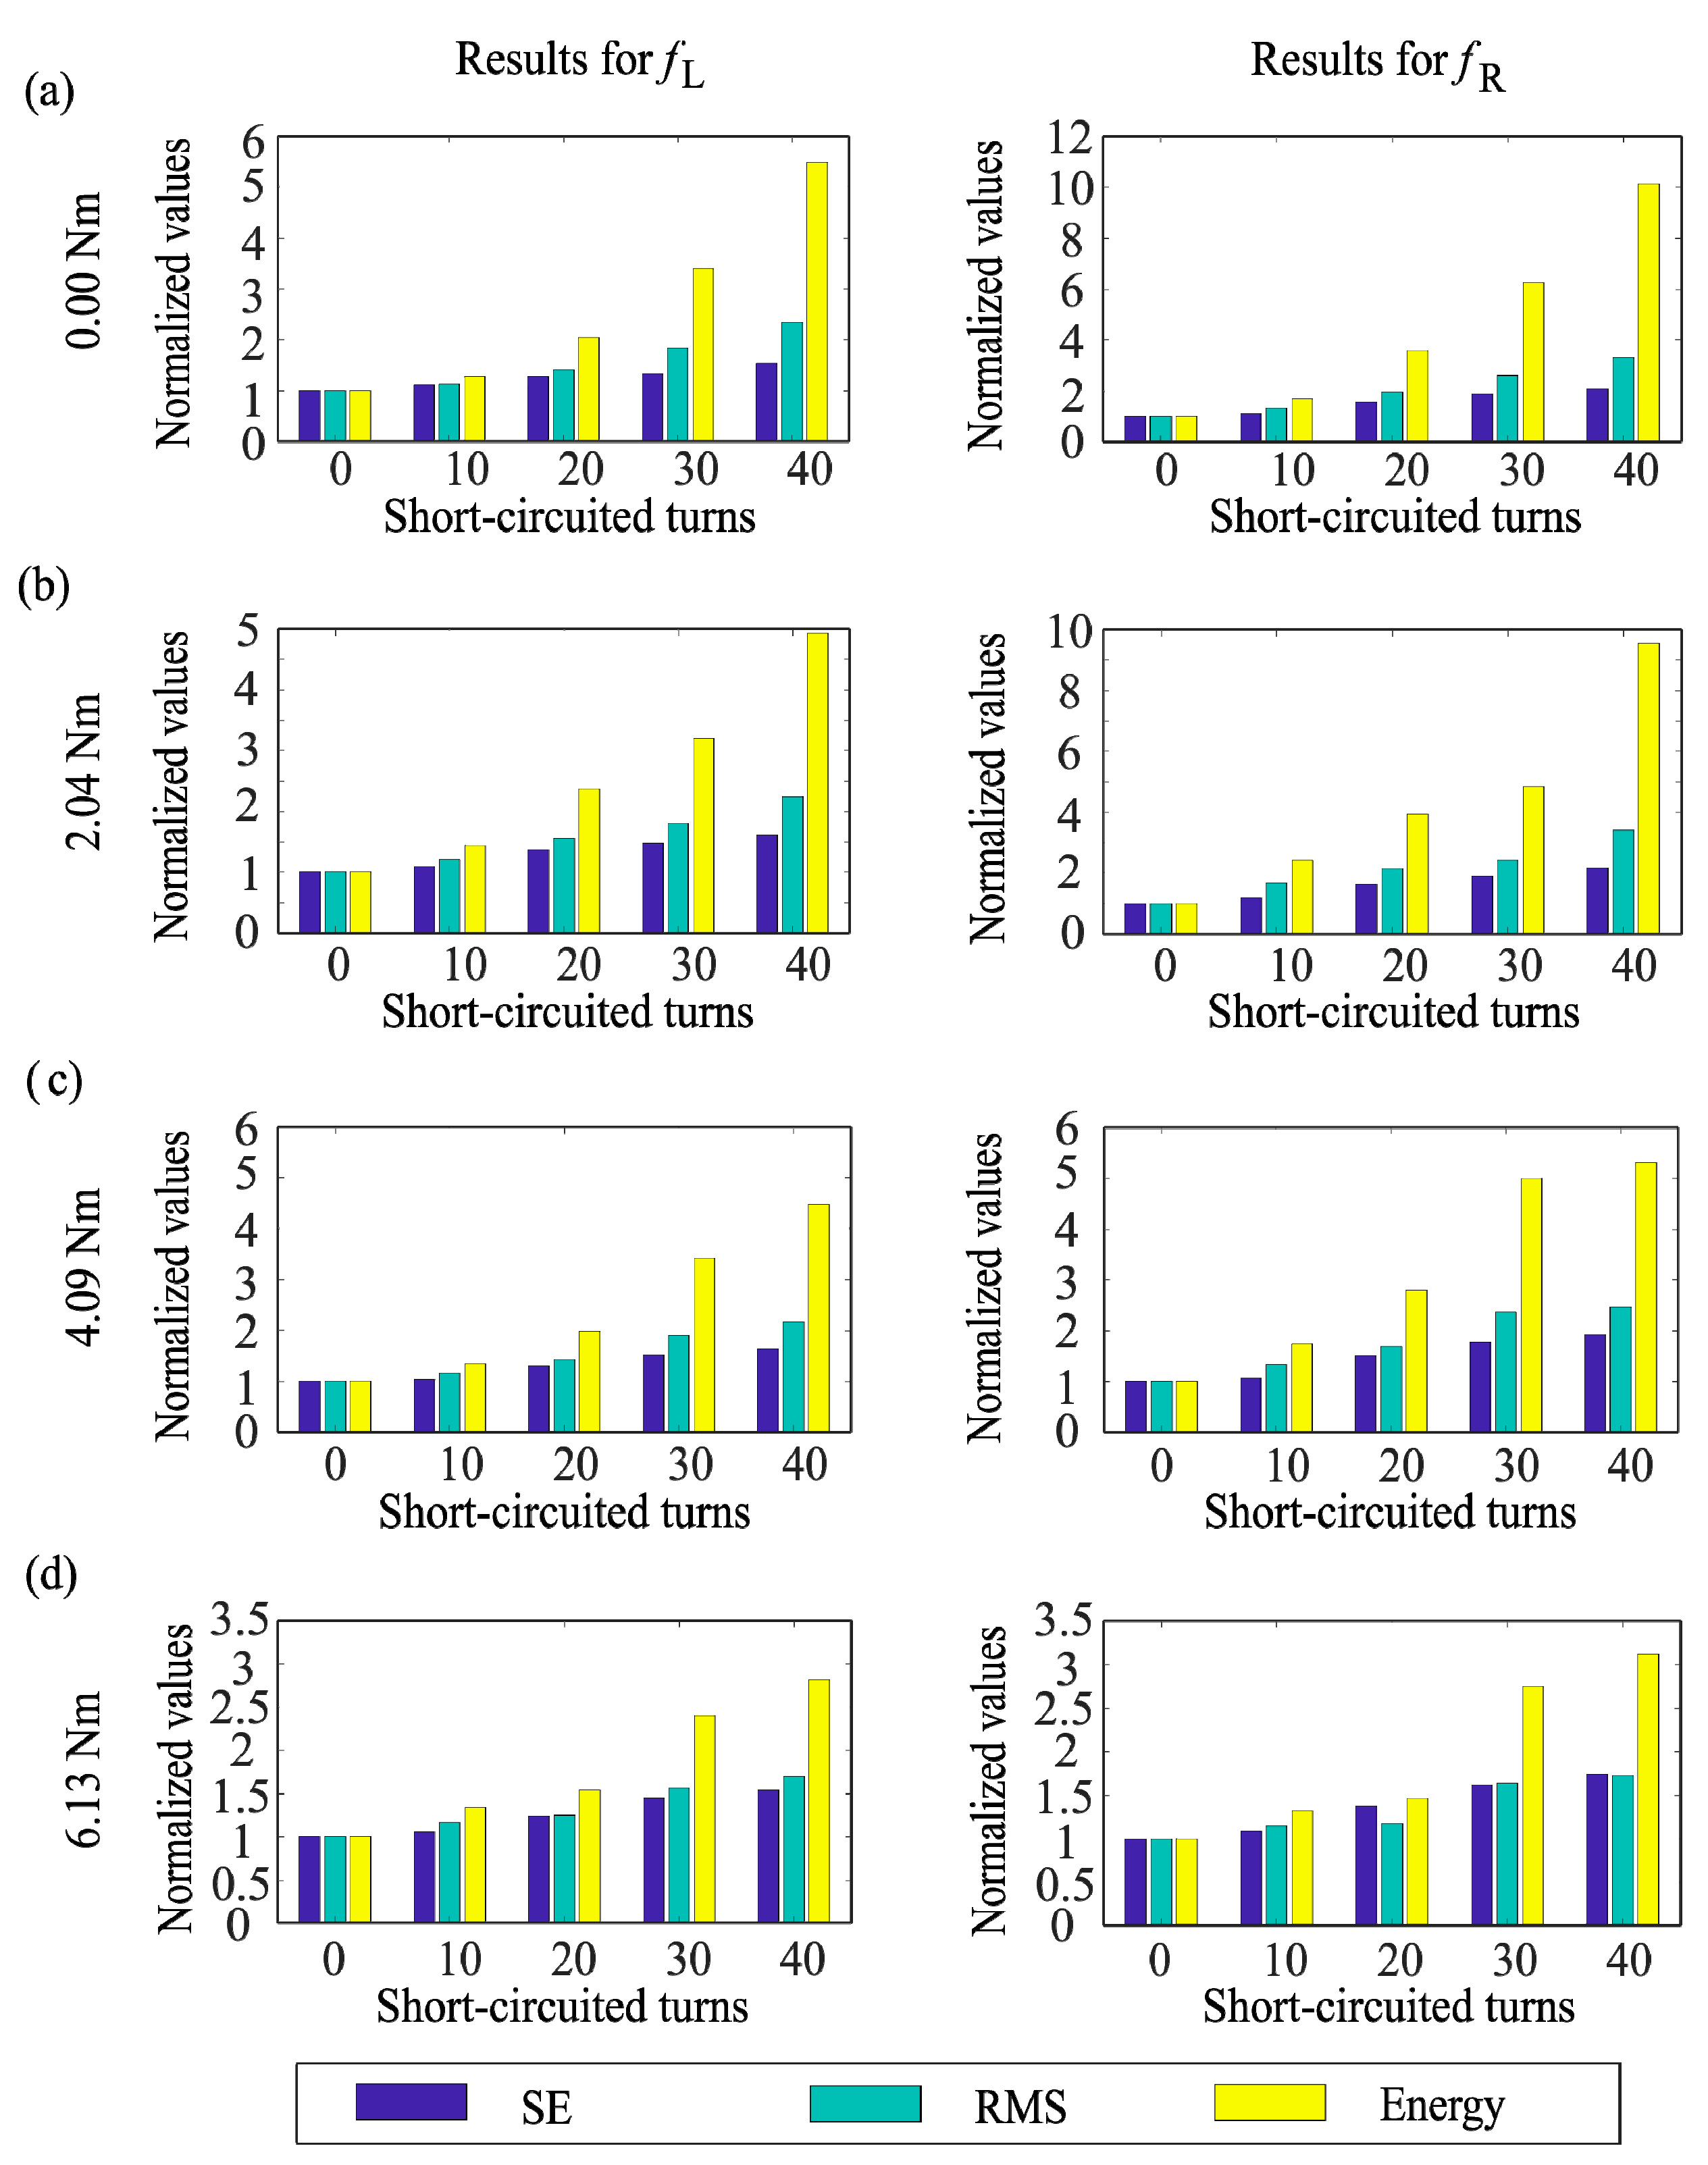
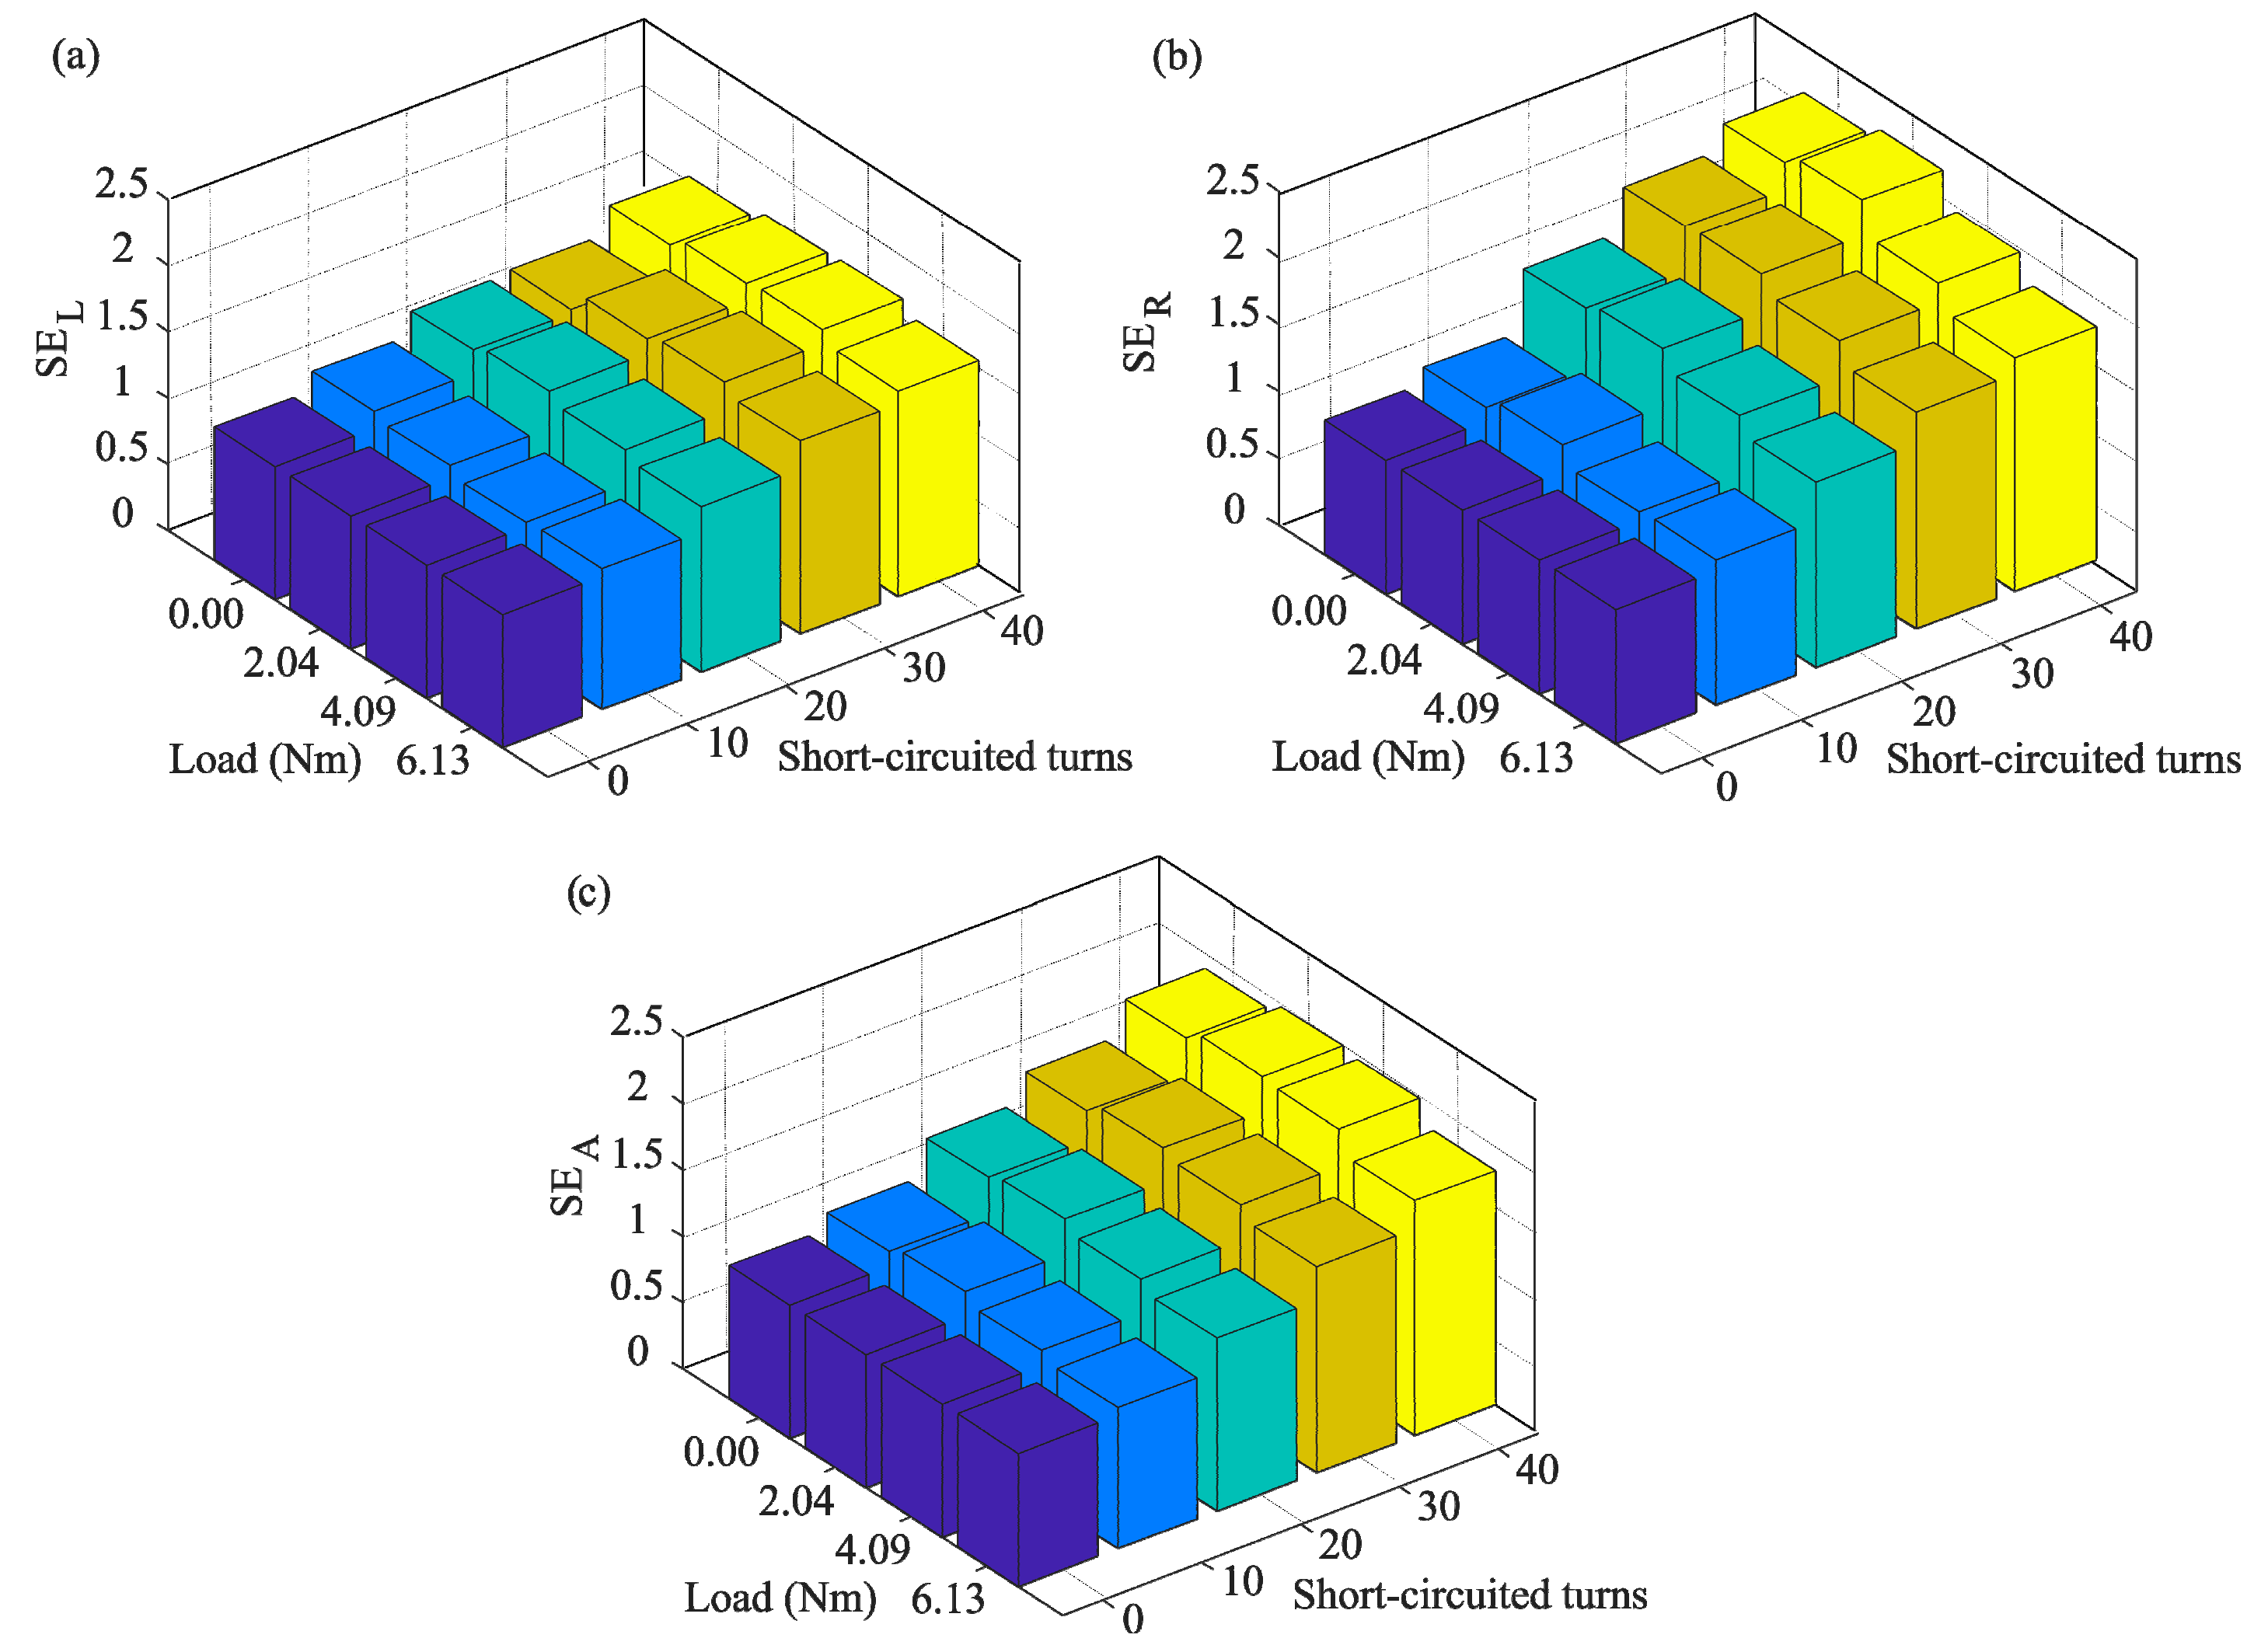
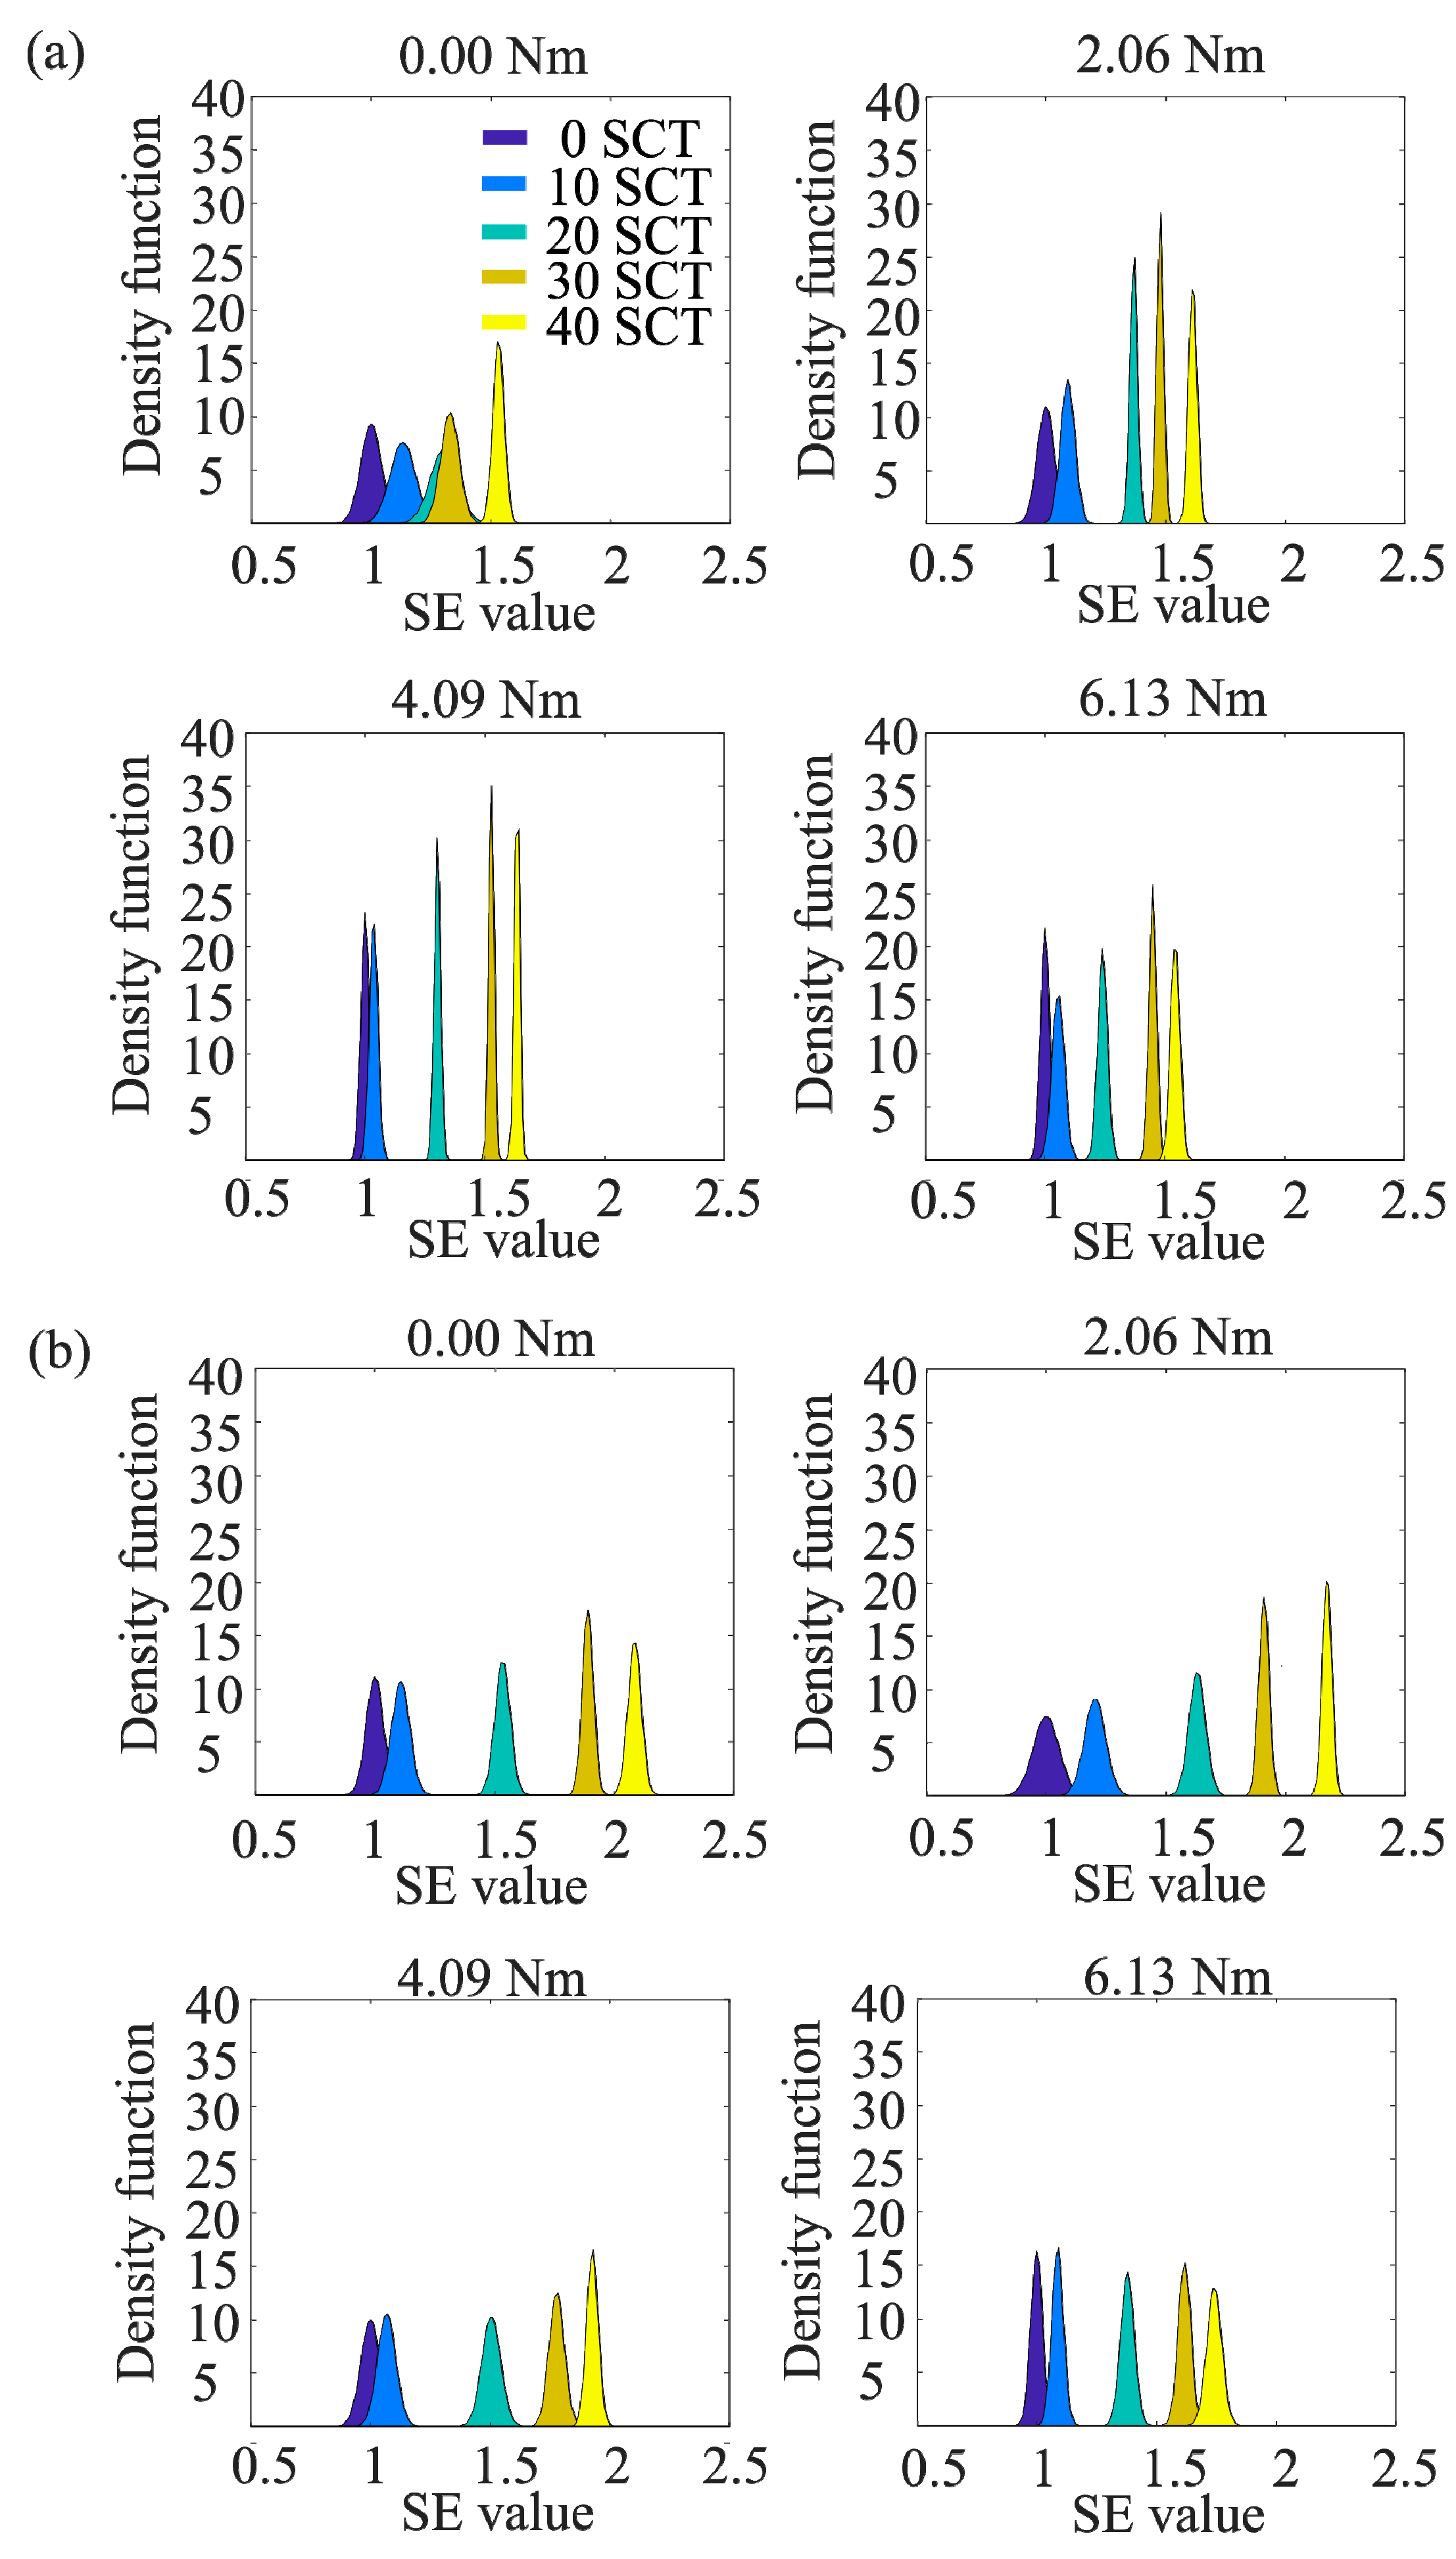
4.2. Results for Real Signals

Following the proposed methodology, the current signals in steady state were filtered using FfL and FfR. After the filtering stage, the SE, RMS and energy indices were computed for the output signals given by fL and fR (see Figure 2). In order to have a common reference to quantify the fault severity, the results of the indices were normalized using the numerical value as a normalization factor for the healthy condition (0 SCTs); thus, these indices will have a value of 1 for 0 SCTs, indicating a healthy condition. Figure 6 depicts the obtained results for the analyzed indices. At the left side of this figure, the results for fL under both different fault severities and different load conditions are shown, whereas the results for fR are shown at the right side.
The results presented in Figure 6 show that the values of the indices increased with the fault severity, which was useful for quantification purposes; however, the change rate in some indices was different for different load conditions, which can compromise the diagnosis. For instance, the energy in fL for 30 SCTs under a load of 2.04 Nm was approximately 3, which can be confused with the energy in fL for 40 SCTs under a load of 6.13 Nm, since it was also approximately 3. In the RMS index, a similar behavior was observed; for instance, the RMS in fR for 20 SCTs under a load of 0.00 Nm was approximately 2, which can be confused with the RMS in fR for 30 SCTs under a load of 4.09 Nm, since it was also approximately 2. From these observations and by analyzing the SE behavior, it was found that the SE index provides the most uniform rate of change regardless of the load conditions, making it the most appropriate index to diagnose and quantify the severity of the SWSC fault. For clarity purposes, Figure 7 shows a three-dimensional bar chart of the SE values (SEL value for fL and SER value for fR), where a behavior almost constant for different loads levels and a constant increment according to the fault severity are both observed. This behavior demonstrates that the SE index can diagnose the fault severity in a proper way, regardless of the mechanical load. In order to provide a single fault index, SEL and SER were averaged, where the result, SEA, was used as indicator for quantifying the fault severity (see Figure 7c).
Table 1 presents the mean (μ) and the standard deviation (σ) for the SE values of the twenty tests of each IM condition (0, 10, 20, 30 and 40 SCTs). Figure 8 shows the results of Table 1 as Gaussian distribution functions, where μ and σ are considered. From this figure, it is evident that, in all the cases, the higher the fault severity, the higher the index value, which applies to both SEL and SER. Although the SE index allows for quantification of the fault severity, the classification of the IM condition (0, 10, 20, 30 and 40 SCTs) cannot be directly achieved, since there are small overlaps between some conditions; for instance, there is an overlap between the 0 SCTs condition (dark blue) and the 10 SCTs condition (light blue) in Figure 8a at the different loads. In this regard, a FL system with SEL and SER as inputs was used to provide the automatic classification. It is important to mention that a FL system was used as classifier in this work, since the information presented in Figure 8 (Gaussian distribution functions) can be seized to generate the Gaussian membership functions.

4.3. Fuzzy Logic System Results

The proposed FL system is a Mamdani-type fuzzy inference system with two inputs, one output and 25 rules. As mentioned previously, the inputs were SEL and SER, while the output was the IM condition. For the fuzzification stage, both inputs were portioned into five Gaussian membership functions, as shown in Figure 9a. These functions were labeled as follows: Very small value (VSV), small value (SV), normal value (NV), high value (HV) and very high value (VHV). The crisp output of the proposed FL system assumes values between 0.5 and 5.5, as shown in Figure 9b; in this figure, 0 SCTs are 1, 10 SCTs are 2, 20 SCTs are 3, 30 SCTs are 4 and 40 SCTs are 5. On the other hand, the 25 functions are presented in Table 2, where one rule can be read as follows: If SEL is VSV and SER is VSV, then the IM condition is 0 SCTs. The minimum composition was used for quantifying the output of the rules and the center-of-gravity method was used for defuzzification [44]. Table 3 shows the classification results for the performed tests. As can be observed, most cases present an effectiveness of 100%; however, two cases present an effectiveness of 95%, implying a general effectiveness of 98%. These cases correspond to 0 SCTs and 10 SCTs. This result can be somehow expected, since the existing overlaps in the Gaussian distribution functions shown in Figure 8 indicate that, in probabilistic terms, there is not a complete separation between cases.

4.4. Discussion

Table 4 summarizes a comparison between the proposal and other recent methodologies presented in the literature, where the methods or algorithms applied to diagnose the SWSC fault in the IM and the features or operating conditions that are considered in the experimentation are shown.
From Table 4, it can be observed that the proposed methodology presents an effectiveness percentage of 98% for detecting the SWSC fault, considering both different severity levels (10, 20, 30 and 40 short-circuited turns) and different mechanical load levels (0%, 33%, 66% and 100%), unlike other works reviewed in the literature [12,19,24], which present mainly the analysis of either a level of damage and different operating conditions or different levels of damage and a constant load operating condition.
In the proposal, the obtained effectiveness (98%) is mainly due to the SE index, which allows for both quantifying the severity of damage regardless of the torque load applied to the IM and classifying the SWSC fault using the proposed FL system for an automatic diagnosis. In qualitative terms, it is important to mention that a low computational burden is achieved by the proposal, since a space transformation of the measured signal is not required, allowing for a low complexity implementation, unlike the other introduced proposals, where a signal transformation and several nonlinear indices is required, along with an expert to interpret the obtained results [12,19,23]. It should be pointed out that the expert role is to interpret the results obtained by the analysis of several characteristics, such as: The location of peaks, the spectrum, among other characteristics; in this regard, the aforementioned analyses are performed qualitatively. Yet, the automatic detection of the motor condition can drastically reduce time taken and allow for continuous and online monitoring. In Reference [8], similar features and operating conditions with the proposal can be observed; however, results about the fault indictor as an independent parameter of the mechanical load are not presented. On the contrary, the proposed SE index demonstrates to be an efficient and insensitive fault indicator to the mechanical load, allowing for consistent diagnosis in different industry applications.

5. Conclusions

Winding faults are one of the most common faults in IM. In this work, a new method based on filters, fault indices and a FL system for the assessment of SWSC faults in IMs was presented. The SE, RMS and energy indices were tested. These indices evaluated the information that was extracted by the brick-wall band-pass filters from the steady-state current signal. Our results indicated that the SE was the most suitable index for the assessment of SWSC faults. For the analyzed cases, i.e., 10, 20, 30 and 40 SCTs under different load torque conditions (0, 2.04, 4.09 and 6.13 Nm), this index has been demonstrated to be sensitive to fault severity and insensitive to mechanical load, i.e., the SE index can properly assess the fault severity regardless of the mechanical load, which is very important, as the mechanical load can change or be different for different industrial applications. On the other hand, the proposed FL system uses the SE values to classify the IM condition in an automatic way. The obtained results indicate that the proposed FL system provides a general effectiveness of 98%.
In a future work, the proposal will be tested under an unbalanced power supply voltage condition (a common electrical condition in industry) in order to increase its robustness and applicability. Furthermore, as the proposal is based on low complexity algorithms (filters and indices based on time-domain formulas), it may be implemented into an embedded system in order to provide an online condition monitoring system. On the other hand, it is important to mention that at this stage of research, the proposal is focused on the diagnosis of SWSC faults in steady state conditions; however, adaptive filters and time-frequency techniques will be also explored in order to provide a solution for transient operating conditions.

Author Contributions

Conceptualization, A.M.-B. and M.V.-R.; Data curation and formal analysis, A.M.-B; Funding acquisition, J.J.d.S.-P., D.G.-L. and J.P.A.-S.; Methodology, A.M.-B. and M.V.-R.; Investigation, Resources and Visualization, J.J.d.S.-P., D.G.-L. and J.P.A.-S.; Writing—original draft, review & editing, all the Authors.

Funding

This research was funded by the “Consejo Nacional de Ciencia y Tecnología (CONACYT)” under the scholarship 296868.

Conflicts of Interest

The authors declare no conflict of interest.

References

  1. Glowacz, A. Acoustic-based fault diagnosis of commutator motor. Electronics 2018, 7, 299. [Google Scholar] [CrossRef]
  2. Singh, A.; Grant, B.; DeFour, R.; Sharma, C.; Bahadoorsingh, S. A review of induction motor fault modeling. Electr. Power Syst. Res. 2016, 133, 191–197. [Google Scholar] [CrossRef]
  3. Mrizalde, Y.; Hernandez-Callejo, L.; Duque-Perez, O. State of the art and trends in the monitoring, detection and diagnosis of failures in electric induction motors. Energies 2017, 10, 1056. [Google Scholar] [CrossRef]
  4. Rangari, S.; Suryawanshi, H.; Renge, M. New fault-tolerant control strategy of five-phase induction motor with four-phase and three-phase modes of operation. Electronics 2018, 7, 159. [Google Scholar] [CrossRef]
  5. Amezquita-Sanchez, J.P.; Valtierra-Rodriguez, M.; Perez-Ramirez, C.A.; Camarena-Martinez, D.; Garcia-Perez, A.; Romero-Troncoso, R.J. Fractal dimension and fuzzy logic systems for broken rotor bar detection in induction motors at start-up and steady-state regimes. Meas. Sci. Technol. 2017, 28, 075001. [Google Scholar] [CrossRef]
  6. Gyftakis, K.N.; Spyropoulos, D.V.; Kappatou, J.C.; Mitronikas, E.D. A novel approach for broken bar fault diagnosis in induction motors through torque monitoring. IEEE Trans. Energy Convers. 2013, 28, 267–277. [Google Scholar] [CrossRef]
  7. Florkowski, M.; Furgał, J. Detection of winding faults in electrical machines using the frequency response analysis method. Meas. Sci. Technol. 2004, 15, 2067. [Google Scholar] [CrossRef]
  8. Bazan, G.H.; Scalassara, P.R.; Endo, W.; Goedtel, A.; Godoy, W.F.; Palácios, R.H.C. Stator fault analysis of three-phase induction motors using information measures and artificial neural networks. Electr. Power Syst. Res. 2017, 143, 347–356. [Google Scholar] [CrossRef]
  9. Thomson, W.T.; Fenger, M. Current signature analysis to detect induction motor faults. IEEE Ind. Appl. Mag. 2001, 7, 26–34. [Google Scholar] [CrossRef]
  10. Arthur, N.; Penman, J. Induction machine condition monitoring with higher order spectra. IEEE Trans. Ind. Electron. 2000, 47, 1031–1041. [Google Scholar] [CrossRef]
  11. Ballal, M.S.; Khan, Z.J.; Suryawanshi, H.M.; Sonolikar, R.L. Adaptive neural fuzzy inference system for the detection of inter-turn insulation and bearing wear faults in induction motor. IEEE Trans. Ind. Electron. 2007, 54, 250–258. [Google Scholar] [CrossRef]
  12. Ukil, A.; Chen, S.; Andenna, A. Detection of stator short circuit faults in three-phase induction motors using motor current zero crossing instants. Electr. Power Syst. Res. 2011, 81, 1036–1044. [Google Scholar] [CrossRef]
  13. Drif, M.H.; Cardoso, A.J.M. Stator fault diagnostics in squirrel cage three-phase induction motor drives using the instantaneous active and reactive power signature analyses. IEEE Trans. Ind. Inform. 2014, 10, 1348–1360. [Google Scholar] [CrossRef]
  14. Glowacz, A.; Glowacz, W.; Glowacz, Z.; Kozik, J. Early fault diagnosis of bearing and stator faults of the single-phase induction motor using acoustic signals. Measurement 2018, 113, 1–9. [Google Scholar] [CrossRef]
  15. Thomson, W.T. On-line MCSA to diagnose shorted turns in low voltage stator windings of 3-phase induction motors prior to failure. In Proceedings of the Electric Machines and Drives Conference (IEMDC 2001), Cambridge, MA, USA, 17–20 June 2001; pp. 891–898. [Google Scholar]
  16. Bouzid, M.B.K.; Champenois, G. New expressions of symmetrical components of the induction motor under stator faults. IEEE Trans. Ind. Electron. 2013, 60, 4093–4102. [Google Scholar] [CrossRef]
  17. Surya, G.N.; Khan, Z.J.; Ballal, M.S.; Suryawanshi, H.M. A simplified frequency-domain detection of stator turn fault in squirrel-cage induction motors using an observer coil technique. IEEE Trans. Ind. Electron. 2017, 64, 1495–1506. [Google Scholar] [CrossRef]
  18. Asfani, D.A.; Muhammad, A.K.; Purnomo, M.H.; Hiyama, T. Temporary short circuit detection in induction motor winding using combination of wavelet transform and neural network. Expert Syst. Appl. 2012, 39, 5367–5375. [Google Scholar] [CrossRef] [Green Version]
  19. Devi, N.R.; Sarma, D.V.S.; Rao, P.V.R. Detection of stator incipient faults and identification of faulty phase in three-phase induction motor–simulation and experimental verification. IET Electr. Power Appl. 2015, 9, 540–548. [Google Scholar] [CrossRef]
  20. Lee, S.H.; Kim, S.; Kim, J.M.; Choi, C.; Kim, J.; Lee, S.; Oh, Y. Extraction of induction motor fault characteristics in frequency domain and fuzzy entropy. In Proceedings of the IEEE International Conference on Electric Machines and Drives, San Antonio, TX, USA, 15 May 2005; pp. 35–40. [Google Scholar]
  21. Li, J.; Yu, H.; Zhang, L. Application of ensemble empirical mode decomposition on stator inter-turn short-circuit fault in doubly fed induction generators. In Proceedings of the Second International Conference on Mechatronics and Automatic Control, Beijing, China, 20–21 September 2014; pp. 73–83. [Google Scholar]
  22. Rosero, J.A.; Romeral, L.; Ortega, J.A.; Rosero, E. Short-circuit detection by means of empirical mode decomposition and Wigner–Ville distribution for PMSM running under dynamic condition. IEEE Trans. Ind. Electron. 2015, 56, 4534–4547. [Google Scholar] [CrossRef]
  23. Sahraoui, M.; Ghoggal, A.; Guedidi, S.; Zouzou, S.E. Detection of inter-turn short-circuit in induction motors using Park–Hilbert method. Int. J. Syst. Assur. Eng. Manag. 2014, 5, 337–351. [Google Scholar] [CrossRef]
  24. Garcia-Guevara, F.M.; Villalobos-Piña, F.J.; Alvarez-Salas, R.; Cabal-Yepez, E.; Gonzalez-Garcia, M.A. Stator fault detection in induction motors by autoregressive modeling. Math. Probl. Eng. 2016, 2016, 1–7. [Google Scholar] [CrossRef]
  25. Ghate, V.N.; Dudul, S.V. Optimal MLP neural network classifier for fault detection of three phase induction motor. Expert Syst. Appl. 2010, 37, 3468–3481. [Google Scholar] [CrossRef]
  26. Valtierra-Rodriguez, M.; Granados-Lieberman, D.; Torres-Fernandez, J.E.; Rodríguez-Rodríguez, J.R.; Gómez-Aguilar, J.F. A new methodology for tracking and instantaneous characterization of voltage variations. IEEE Trans. Instrum. Meas. 2016, 65, 1596–1604. [Google Scholar] [CrossRef]
  27. Antonino-Daviu, J.A.; Riera-Guasp, M.; Pineda-Sanchez, M.; Pérez, R.B. A critical comparison between DWT and Hilbert–Huang-based methods for the diagnosis of rotor bar failures in induction machines. IEEE Trans. Ind. Appl. 2009, 45, 1794–1803. [Google Scholar] [CrossRef]
  28. Torres, M.E.; Colominas, M.A.; Schlotthauer, G.; Flandrin, P. A complete ensemble empirical mode decomposition with adaptive noise. In Proceedings of the IEEE International Conference on Acoustics, Speech and Signal Processing (ICASSP 2011), Prague, Czech Republic, 22–27 May 2011; pp. 4144–4147. [Google Scholar]
  29. Elbouchikhi, E.; Choqueuse, V.; Amirat, Y.; Benbouzid, M.E.H.; Turri, S. An efficient Hilbert–Huang transform-based bearing faults detection in induction machines. IEEE Trans. Energy Convers. 2017, 32, 401–413. [Google Scholar] [CrossRef]
  30. Boashash, B.; Khan, N.A.; Ben-Jabeur, T. Time–frequency features for pattern recognition using high-resolution TFDs: A tutorial review. Digit. Signal Process. 2015, 40, 1–30. [Google Scholar] [CrossRef]
  31. Adeli, H.; Jiang, X. Dynamic fuzzy wavelet neural network model for structural system identification. J. Struct. Eng. 2006, 132, 102–111. [Google Scholar] [CrossRef]
  32. Amezquita-Sanchez, J.P.; Adeli, H. Synchrosqueezed wavelet transform-fractality model for locating, detecting, and quantifying damage in smart highrise building structures. Smart Mater. Struct. 2015, 24, 065034. [Google Scholar] [CrossRef]
  33. Jung, J.H.; Lee, J.J.; Kwon, B.H. Online diagnosis of induction motors using MCSA. IEEE Trans. Ind. Electron. 2006, 53, 1842–1852. [Google Scholar] [CrossRef]
  34. Roscoe, A.J.; Abdulhadi, I.F.; Burt, G.M. Filters for M class phasor measurement units. In Proceedings of the IEEE International Workshop on Applied Measurements for Power Systems (AMPS 2012), Aachen, Germany, 26–28 September 2012; pp. 1–6. [Google Scholar]
  35. Ramstad, T. Digital methods for conversion between arbitrary sampling frequencies. IEEE Trans. Acoust. Speech Signal Process. 1984, 32, 577–591. [Google Scholar] [CrossRef]
  36. Cabal-Yepez, E.; Valtierra-Rodriguez, M.; Romero-Troncoso, R.J.; Garcia-Perez, A.; Osornio-Rios, R.A.; Miranda-Vidales, H.; Alvarez-Salas, R. FPGA-based entropy neural processor for online detection of multiple combined faults on induction motors. Mech. Syst. Signal Process. 2012, 30, 123–130. [Google Scholar] [CrossRef]
  37. Mejia-Barron, A.; Valtierra-Rodriguez, M.; Granados-Lieberman, D.; Olivares-Galvan, J.C.; Escarela-Perez, R. The application of EMD-based methods for diagnosis of winding faults in a transformer using transient and steady state currents. Measurement 2018, 117, 371–379. [Google Scholar] [CrossRef]
  38. Bafroui, H.H.; Ohadi, A. Application of wavelet energy and Shannon entropy for feature extraction in gearbox fault detection under varying speed conditions. Neurocomputing 2014, 133, 437–445. [Google Scholar] [CrossRef]
  39. Seryasat, O.R.; Honarvar, F.; Rahmani, A. Multi-fault diagnosis of ball bearing using FFT, wavelet energy entropy mean and root mean square (RMS). In Proceedings of the IEEE International Conference on Systems Man and Cybernetics (SMC 2010), Istanbul, Turkey, 10–13 October 2010; pp. 4295–4299. [Google Scholar]
  40. Kamalapathi, K.; Priyadarshi, N.; Padmanaban, S.; Holm-Nielsen, J.; Azam, F.; Umayal, C.; Ramachandaramurthy, V. A hybrid moth-flame fuzzy logic controller based integrated cuk converter fed brushless DC motor for power factor correction. Electronics 2018, 7, 288. [Google Scholar] [CrossRef]
  41. Fink, A.; Töpfer, S.; Isermann, R. Nonlinear model-based control with local linear neuro-fuzzy models. Arch. Appl. Mech. 2003, 72, 911–922. [Google Scholar] [CrossRef]
  42. Nentwig, M.; Mercorelli, P. Throttle valve control using an inverse local linear model tree based on a Fuzzy neural network. In Proceedings of the 7th IEEE International Conference on Cybernetic Intelligent Systems, London, UK, 9–10 September 2008. [Google Scholar] [CrossRef]
  43. De Silva, C.W. Intelligent Control: Fuzzy Logic Applications; CRC Press: Boca Raton, FL, USA, 2018. [Google Scholar]
  44. Passino, K.M.; Yurkovich, S.; Reinfrank, M. Fuzzy Control; Addison-Wesley: Menlo Park, CA, USA, 1998; ISBN 0-201-18074-X. [Google Scholar]
Figure 1. General diagram of a fuzzy logic (FL) system.
Electronics 08 00090 g001
Figure 2. Proposed methodology.
Electronics 08 00090 g002
Figure 3. Filter design: (a) Frequencies of interest, (b) brick-wall low-pass filters and (c) brick-wall band-pass filters.
Electronics 08 00090 g003
Figure 4. Experimental setup.
Electronics 08 00090 g004
Figure 5. Current signals for (a) 0 SCTs, (b) 10 SCTs, (c) 20 SCTs, (d) 30 SCTs and (e) 40 SCTs at different loads (0.00, 2.04, 4.09 and 6.13 Nm).
Electronics 08 00090 g005
Figure 6. Results for the Shannon entropy (SE), root mean square (RMS), and energy indices at (a) 0.00 Nm, (b) 2.04 Nm, (c) 4.09 Nm and (d) 6.13 Nm (left side for fL and right side for fR).
Electronics 08 00090 g006
Figure 7. SE values for (a) fL, (b) fR, and (c) SEA at both different loads and different fault severities.
Electronics 08 00090 g007
Figure 8. Gaussian distribution functions for (a) SEL and (b) SER at both different loads and different fault severities.
Electronics 08 00090 g008
Figure 9. Membership functions for (a) SEL and (b) SER and (c) FL outputs.
Electronics 08 00090 g009
Table 1. μ and σ for SE values.
fL
Number of Short-Circuited Turns (μ and σ for SE Values)
Load010203040
0.001, 0.12291.1326, 0.15781.3051, 0.17201.3297, 0.11601.5324, 0.0699
2.041, 0.10971.0916, 0.08901.3673, 0.04831.4781, 0.04131.6144, 0.0533
4.091, 0.05161.0358, 0.05301.3025, 0.03951.5279, 0.03351.6354, 0.0359
6.131, 0.05581.0559, 0.07711.2410, 0.06131.4507, 0.04771.5444, 0.0591
fR
Number of Short-Circuited Turns (μ and σ for SE Values)
Load010203040
0.001, 0.10821.1082, 0.11211.5639, 0.09511.8904, 0.06962.0860, 0.0830
2.041, 0.16141.2044, 0.13151.6318, 0.10351.9104, 0.06472.1743, 0.0580
4.091, 0.12041.0683, 0.11351.5052, 0.11661.7788, 0.09601.9281, 0.0727
6.130.0738331.0878, 0.07201.3794, 0.08381.6181, 0.07861.7425, 0.0932
Table 2. Rules for the proposed FL system.
InputsSER
SELVSVSVNVHVVHV
VSV0 SCTs0 SCTs10 SCTs20 SCTs20 SCTs
SV0 SCTs10 SCTs20 SCTs20 SCTs20 SCTs
NV10 SCTs20 SCTs20 SCTs20 SCTs30 SCTs
HV20 SCTs20 SCTs20 SCTs30 SCTs40 SCTs
VHV20 SCTs20 SCTs30 SCTs40 SCTs40 SCTs
Table 3. Classification results (confusion matrix).
IM Condition0 SCTs10 SCTs20 SCTs30 SCTs40 SCTsEP (%)
0 SCTs19100095
10 SCTs11900095
20 SCTs002000100
30 SCTs000200100
40 SCTs000020100
Effectiveness98%
EP: Effectiveness percentage.
Table 4. Comparison summary between the proposed methodology and works reporting stator winding short-circuit (SWSC) fault diagnosis.
WorkApplied MethodsDomainAccuracyVariable LoadDifferent Fault Severities
[8]
  • Compute the mutual information among current signals.
  • Normalize data.
  • Pattern recognition by means of artificial neural networks (ANN).
Time>93%YesYes
[12]
  • Estimate Zero crossing time (ZCT).
  • Compute frequency spectrum of ZCT signal by means of discrete Fourier transform.
  • Locate peaks related to inter-turn fault.
FrequencyNRYesNo
[19]
  • Decompose current signal using stationary Wavelet transform (SWT).
  • Obtain fault residues using reconstructed currents.
  • Obtain coefficients by decomposing the residues with discrete Wavelet transform (DWT).
  • Estimate the fault index and compare with an adaptive threshold.
Time-FrequencyNRNoYes
[23]
  • Obtain an analytical signal by means of extended Park’s vector approach and Hilbert transform (P-H).
  • Estimate frequency domain of the analytical signal via fast Fourier transform (FFT).
  • Calculate the amplitudes and frequencies corresponding to harmonics associated with the fault.
  • Compute the partial relative indexes (PRI) for fault detection.
FrequencyNRYesYes
[24]
  • Map into the α-β stator-fixed reference frame the stator currents.
  • Compute the instantaneous space phasor (ISP) module.
  • Evaluate the final prediction criterion (FPE) for the proposed ISP autoregressive model by the different operation condition.
Time95%NoYes
This work
  • Brick-wall band-pass FIR filters for extraction of frequency components.
  • Compute the SE index as fault indicator.
  • FL system for automatic classification
Time98%YesYes

