Bird Functional Traits Respond to Forest Structure in Riparian Areas Undergoing Active Restoration


1
Graduate Program in Environmental Sciences, Federal University of São Carlos, Rod. Washington Luiz km 235, 13565-905 São Carlos, SP, Brazil
2
Department of Environmental Sciences, Federal University of São Carlos, Rod. Washington Luiz km 235, 13565-905 São Carlos, SP, Brazil
*
Author to whom correspondence should be addressed.
Diversity 2018, 10(3), 90; https://doi.org/10.3390/d10030090
Submission received: 5 July 2018
/
Revised: 3 August 2018
/
Accepted: 8 August 2018
/
Published: 14 August 2018
(This article belongs to the Special Issue Feature Papers for Celebrating the tenth Founding Year of Diversity)
Abstract
:Monitoring wildlife responses is essential to assess restoration projects. Birds are widely used as bioindicators of ecosystem restoration, but most studies use only taxonomic descriptors to compare categories of reference and restoring sites. Here, we used forest structure as a continuous predictor variable to evaluate avifaunal taxonomic and functional indicators in riparian forest reference and restoration sites on southeastern Brazil. Reference sites were riparian forest remnants, and restoration sites were pasture before seedling reintroduction. Forest structure variables (mean tree height, canopy depth, mean diameter at breast height, basal area, tree layering, tree density, and grass cover) were reduced into two axes using a Principal Component Analysis (PCA), Forest Axis 1 (tree biomass vs. grass cover) and Forest Axis 2 (canopy depth vs. tree density). Bird species were classified in relation to five functional categories (i.e., diet, foraging stratum, nest height, cavity dependence for nesting, and forest dependence). Forest Axis 1 influenced the functional diversity of bird assemblages and the relative abundance within levels of each functional category (except for nest height). The relative abundance of all functional categories combined was also affected by Forest Axis 2. Therefore, forest structure affected the predominant functional traits of bird species in riparian sites under restoration. Sites with higher tree biomass were the richest, with canopy birds that were insectivores and frugivores of high forest dependence, whereas more open sites were associated with birds of low forest dependence and ground-foraging insectivores. Forest structures of similar-aged sites were strongly variable, due to natural and anthropic disturbances, so restoration age was a poor indicator of forest development. These unpredictable disturbances can change the development of sites under restoration, so that forest structure can be a better descriptor of the trajectory of these ecosystems.
1. Introduction
Riparian forests are dynamic and heterogeneous ecosystems that concentrate high species diversity at both local and regional scales [1,2]. These forests shelter not only specialized species that live in riparian areas, but also species of adjacent habitats, being important corridors for the dispersal of animals and plants at the landscape level [3,4,5]. Therefore, deforestation and degradation of riparian forests result in severe loss of biodiversity and ecosystem functions [2,6,7]. The importance of riparian forest restoration to recover ecosystem functions and services, and for the conservation of biodiversity, is recognized by worldwide public policies [2,8,9,10,11]. The vegetation development of restoration areas should lead them to a growing similarity with reference forest sites [12,13]. However, the trajectory of forest development may vary among restoration sites independently of time since restoration was implemented. Seedling survival and growth response to microhabitat biotic and abiotic factors, such as existing vegetation (e.g., exotic grass), microclimate, water stress and fire, soil physical and chemical characteristics, frost, and herbivory, which all vary spatially and temporally [14]. The effects of these factors, together with differences in the management of restored sites, can result in large variations in forest structure among restoration sites of similar ages [13]. In this sense, monitoring biodiversity responses is an essential part of restoration efforts, to evaluate the trajectory of restoring ecosystems and determining the need for additional management actions [15].
Birds are widely used as bioindicators for the monitoring of ecosystems under restoration, as they commonly present fast responses to forest development [16,17,18] and perform important ecological functions such as pollination, seed dispersal, and predation [19,20,21]. Bird assemblages can show large shifts in their composition according to the vegetation successional stage [22,23,24,25]. In accordance, descriptors related to forest structure such as vegetation height, total basal area or canopy depth can explain the richness and composition of bird species in restored sites [26].
Many bird species can be highly dependent on forests [4,27]. These species occur exclusively or preferentially in the forest interior, suggesting that their performance is directly related to tree size and density [4]. However, studies evaluating the responses of bird assemblages to forest restoration generally compare areas in restored vs remnant reference forests [28,29], classify areas in age classes [26,30], or use time since restoration as a continuous predictor variable [31,32]. Although these studies recognize the importance of vegetation structure on bird assemblages, few studies explicitly used the development of forest structure as a predictor variable.
Most studies on responses of bird assemblages to forest restoration focuses on feeding functional groups or trophic guilds. Birds use a wide range of food resources that are directly related with forest structure. However, they also use forest resources for shelter and breeding, so that habitat quality may influence not only the diversity of bird assemblages but also habitat usage by distinct bird functional groups. In fact, differences in the structure of restored forests can directly affect both the taxonomic and functional composition of bird assemblages.
Open restored sites have less trophic guilds, with predominance of granivorous species [33,34] that nest in the lower vegetation layer [33] and have low forest dependence [23,34]. As forests develop, functional group composition may change, with increasing abundances of forest-dependent and cavity-nesting species [23,33,34]. For example, Santos-Júnior et al. [28] found that the composition of bird functional groups in restored sites (<10 years) was similar to that of nearby small forest reference remnants but differed from that of a large forest reference site, likely due to greater environmental complexity and differential resource availability. Cosset and Edwards [29] found that the restoration of logged tropical forests had negative effects on both phylogenetic and functional diversity of birds due to the reduction of environmental complexity resulting from vegetation management. Intermediate stages of forest succession include birds from both open and forested sites, with dominance of generalist species [34]. The abundance of functional groups can vary widely among restored and reference sites even when they have similar levels of abundance and species richness [15,23,35]. However, few studies evaluated the responses of other habitat-related functional groups such as nesting habits and forest dependency. Moreover, the recovery of taxonomic diversity does not necessarily imply in the recovery of important ecosystem functions, since taxonomic indicators consider all species as equivalent despite their differences in ecological traits [36]. The assessment of functional diversity and recovery of functional groups is fundamental to evaluate ecosystem restoration, since they provide direct links to ecosystem processes [29,37].
Here, we assessed the effects of forest structure on bird taxonomic and functional diversity, and composition of functional groups in riparian forests undergoing restoration and nearby reference forest sites in southeastern Brazil. We hypothesized that the structure of riparian forests should influence (a) bird abundance, species richness and functional diversity, and (b) the composition of bird functional groups classified in relation to their forest dependence, diet, foraging and nesting stratum, and dependence of cavities for nesting. Additionally, we hypothesized that (c) the levels of forest dependence are related to other functional categories, providing a mechanistic explanation to the observed patterns of functional diversity through the forest structure gradient.
2. Materials and Methods
2.1. Study Area
We conducted the study at sites located within the Ribeirão do Feijão basin, a major water supply watershed for the city of São Carlos, São Paulo State, Southeastern Brazil (22°00′–22°10′ S 47°45′–47°50′ W). The climate is wet subtropical with dry winters and hot summers, with mean monthly temperatures between 16.2 °C and 22.4 °C, and annual rainfall around 1500 mm [38]. The original vegetation was seasonal semideciduous forest [39], currently replaced mostly by pasture and Eucaliptus spp. forestry [40]. In the study area, the southern margin of Ribeirão do Feijão is composed by a continuous strip of relatively preserved riparian forest around 40 m wide. The northern margin was pasture before the restoration efforts, which were conducted in different sites of its length. The active restoration efforts was carried out by a nongovernmental organization (Iniciativa Verde, www.iniciativaverde.org.br), which reintroduced greenhouse-raised seedlings (20–30 cm height) of 72 native tree species (Table A1) with 3 × 2 m spacing.
We established eight 100 × 30 m plots, two in the original riparian forest (C1 and C2) and six in restoration sites (R1 through R6), distant 60–140 m from each other. The proximity of reference and restoration sites provided an advantage to evaluate the effects of forest structure development, since bird dispersal from reference sites was not limited by distance. Restored sites had seedlings reintroduced in 2006 (R1), 2007 (R2 and R3), and 2012 (R4, R5 and R6), so that they were 9, 8, and 3 years old when the study was carried out (January–March 2015). More than the age, the disturbance trajectory of each restored site varied greatly in relation to survival of reintroduced plants, grazing intensity and management of exotic grasses, which led to areas with large variation in forest structure.
2.2. Forest Structure
We assessed forest structure from two 10 × 10 m subplots located in the center of each plot, 10 m distant from each other, which represented 25% of the core of the plot, considering an edge effect of 10 m. We considered that the sampled area was representative due to the homogeneity of the forest structure within plots since the trees were reintroduced in uniform way following the same restoration planning in all plots. All trees taller than 1.5 m were measured for height (cm), canopy depth (the vertical distance between lowest and highest branches with leaves), and diameter at breast height (dbh) (cm) from which we calculated tree basal area. We pooled the replicate pairs to estimate eight variables for each study plot: total basal area (m²/ha), mean and maximum tree height (m), mean canopy depth (m), mean dbh (cm), tree density (number of individuals per hectare), tree layering (coefficient of variation of tree heights, following Souza et al. [41]) and grass cover, which was visually classified in four categories, 0–25%, 26–50%, 51–75% or 76–100%.
2.3. Bird Survey and Functional Traits
We surveyed birds in sunny mornings (07:00–10:00 h) in the breeding season, from January to February 2015. To maximize the detection of bird species, we employed two survey methods: a fixed-point count (15 m radius) at the center of each study plot [42] and active search on the plots [23,43]. Both methods had three replicates of 10 min duration in each study plot, when we recorded all bird species that could be seen or heard. Birds that flew above the study area were not recorded because we were interested primarily in the responses of birds to restoration at a within-plot spatial scale. Each study plot was surveyed only once a day. The most representative species present at a site are likely to be detected within six survey days [44]. The order of plot sampling was changed in each sampling day, and bird species were qualitatively recorded during surveys. So, we used the number of surveys in which a given species was recorded at each plot as a proxy for its relative abundance [24].
We classified bird species in relation to six bird functional traits (Table A2): body mass (g), diet (frugivores, granivores, nectarivores, insectivores, insectivores/frugivores, insectivores/granivores, omnivores), foraging stratum (ground, understory, canopy, mixed), nesting height (ground, understory, canopy), cavity dependence for nesting (constructors, exploiters-secondary cavity nesters, non-dependent), and forest dependence (high, intermediate, low). Classification followed mostly Sick [45] and field observations. Diet classification followed previous studies [46,47], but some reclassification on diets are detailed in the supplementary file (Table A2).
2.4. Statistical Analysis
To reduce the dimensionality of forest structure variables, we used a Principal Component Analysis (PCA) on standardized variables. Tree density was log-transformed to achieve normality. The resultant axes (hereafter referred to as Forest Axis 1 and Forest Axis 2) were used as independent variables to analyze the structure and composition of bird assemblages. The following variables were used to describe the bird assemblages: total relative abundance (number of records), species richness, and two measures of functional diversity, functional dispersion (FDis) [48] and Rao’s quadratic entropy (Rao’s Q) [49]. Both FDis and Rao’s Q are distance-based methods for measuring the functional diversity considering the dispersion of species in a multidimensional niche space. Functional dispersion (FDis) provides the mean distance of individual species to the centroid of all species, whereas Rao’s Q returns the mean distance between each pair of these species. We choose FDis and Rao’s Q because both are correlated, allow including qualitative traits, and are weighed by species abundances, and they are not correlated with species richness [48].
Multiple regression models were used to test whether forest structure (Forest Axes 1 and 2) influenced taxonomic and functional descriptors of the avian assemblage, with selection of the explanatory variables by the stepwise forward method. To assess whether forest structure influenced the composition of functional traits, we used canonical correspondence analysis (CCA) [50] because we assumed that relative abundance of each functional trait would present a unimodal distribution throughout the vegetation development. Separate CCAs were carried out to evaluate the composition of each functional category, weighted by species abundances. After determining which functional traits were related to the explanatory variables, we carried out a final CCA on the combined values of the functional traits (i.e., each possible combination of functional categories), also weighted by species abundances. The selection of explanatory variables (Forest Axes 1 and 2) was carried out with the stepwise forward method using the Monte–Carlo test (999 permutations). We conducted the analyses in the software R (R Development Core Team, Vienna, Austria) [51], using the packages “vegan” [52] and “FD” [53]. To test whether the levels of forest dependence are related to other functional categories, we determined if the number of species found in each combination of levels are independent of forest dependence using exact chi-square tests adjusted for small samples following Agresti [54] with the software StatXact ® 11 (Cytel Inc., Cambridge, MA, USA). Level of significance was α = 0.05 for all statistical tests.
3. Results
3.1. Forest Structure
Forest structure showed great variation among sites under restoration (Table 1). Reference sites had the tallest trees, and site R1 had the largest trees among the restoring sites. Some restored sites such as R2, R3 and R5 had low tree densities because of high tree mortalities, due to severe winters soon after seedling reintroduction, and constant grazing impact.
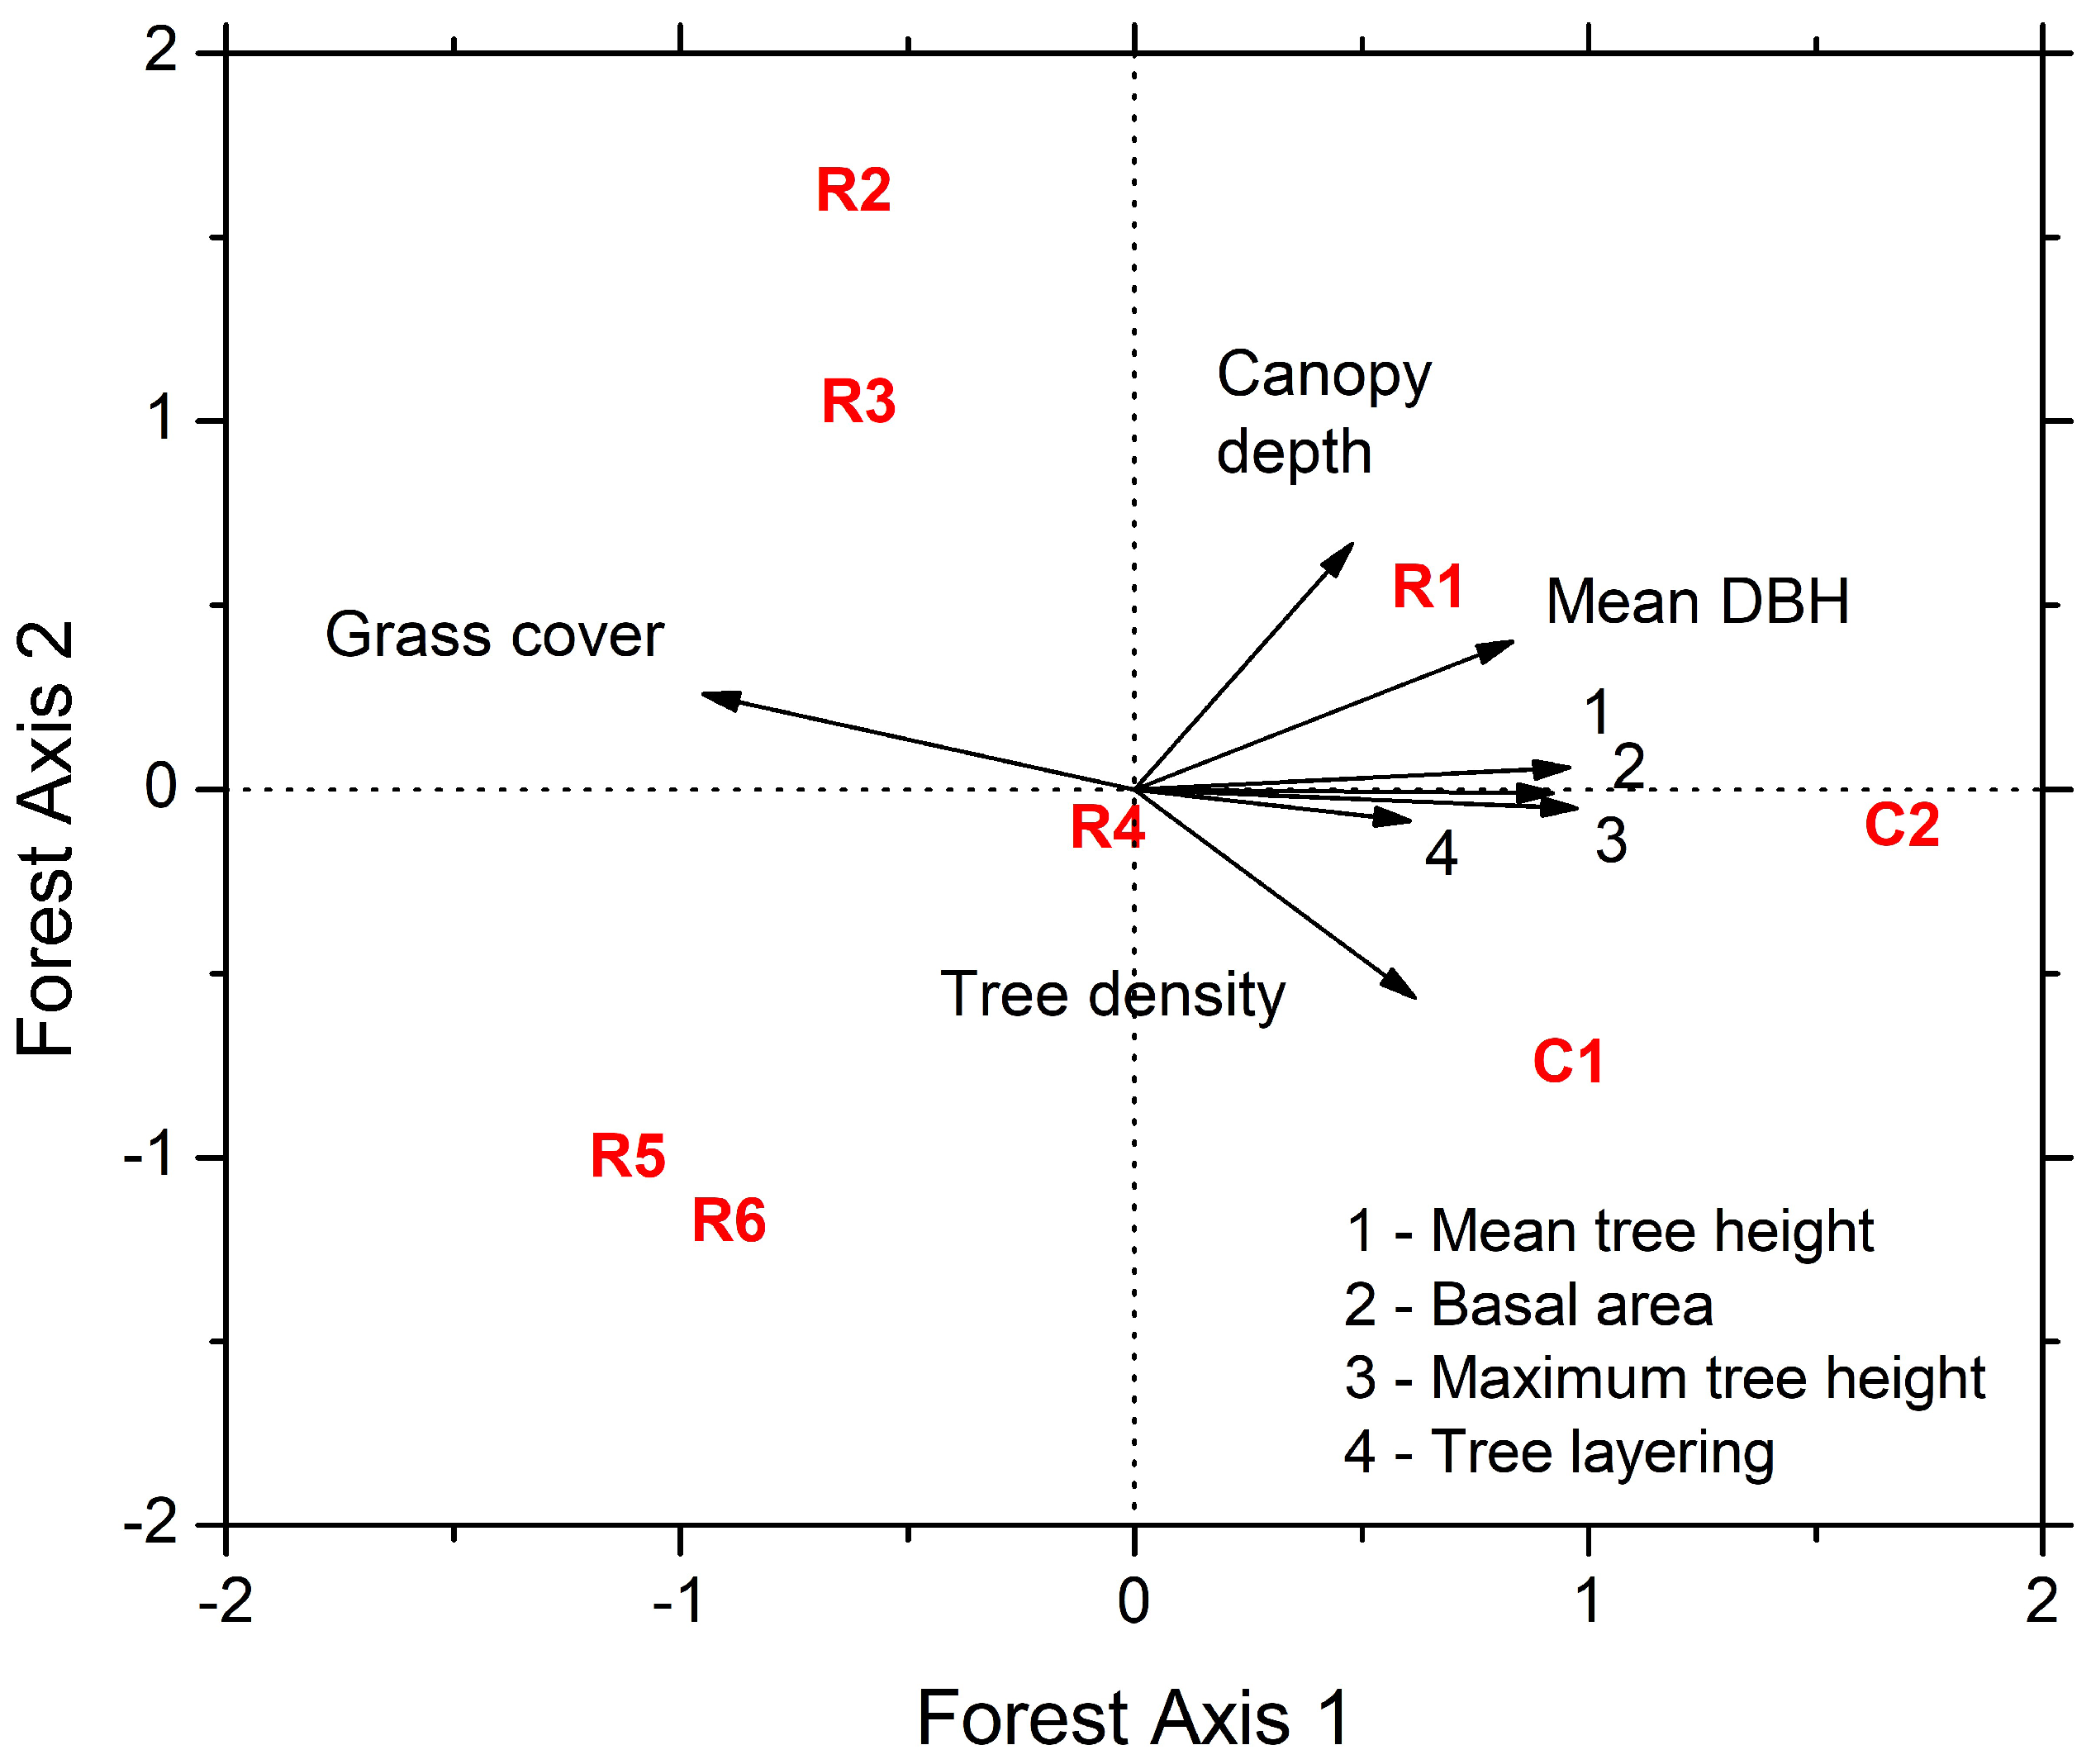
The first axis of the PCA (Forest Axis 1) based on forest structure variables explained 66.1% of the variation and was positively correlated to mean tree height, basal area, maximum tree height, and tree layering (Figure 1), whereas grass cover was negatively correlated to this axis. Mean tree height, maximum tree height, total basal area, and tree layering were strongly correlated amongst them and negatively correlated with grass cover. These variables form a gradient of forest structure where reference sites are related with more and larger trees, whereas sites R5 and R6 are in the opposite position, and are composed by few and smaller trees and more grass cover (Figure 1). The other sites are in intermediate positions; R1 is more similar to reference sites than to other restored sites. The second axis (Forest Axis 2) explained 12.6% of the variation and was positively correlated to canopy depth and negatively correlated to tree density (Figure 1). This axis separated mainly sites R2 and R3, which had saplings about 4 m high but with low tree densities, whereas R5 and R6 had higher tree densities but smaller canopies (Figure 1, Table 1).
3.2. Effect of Forest Structure on Bird Assemblage
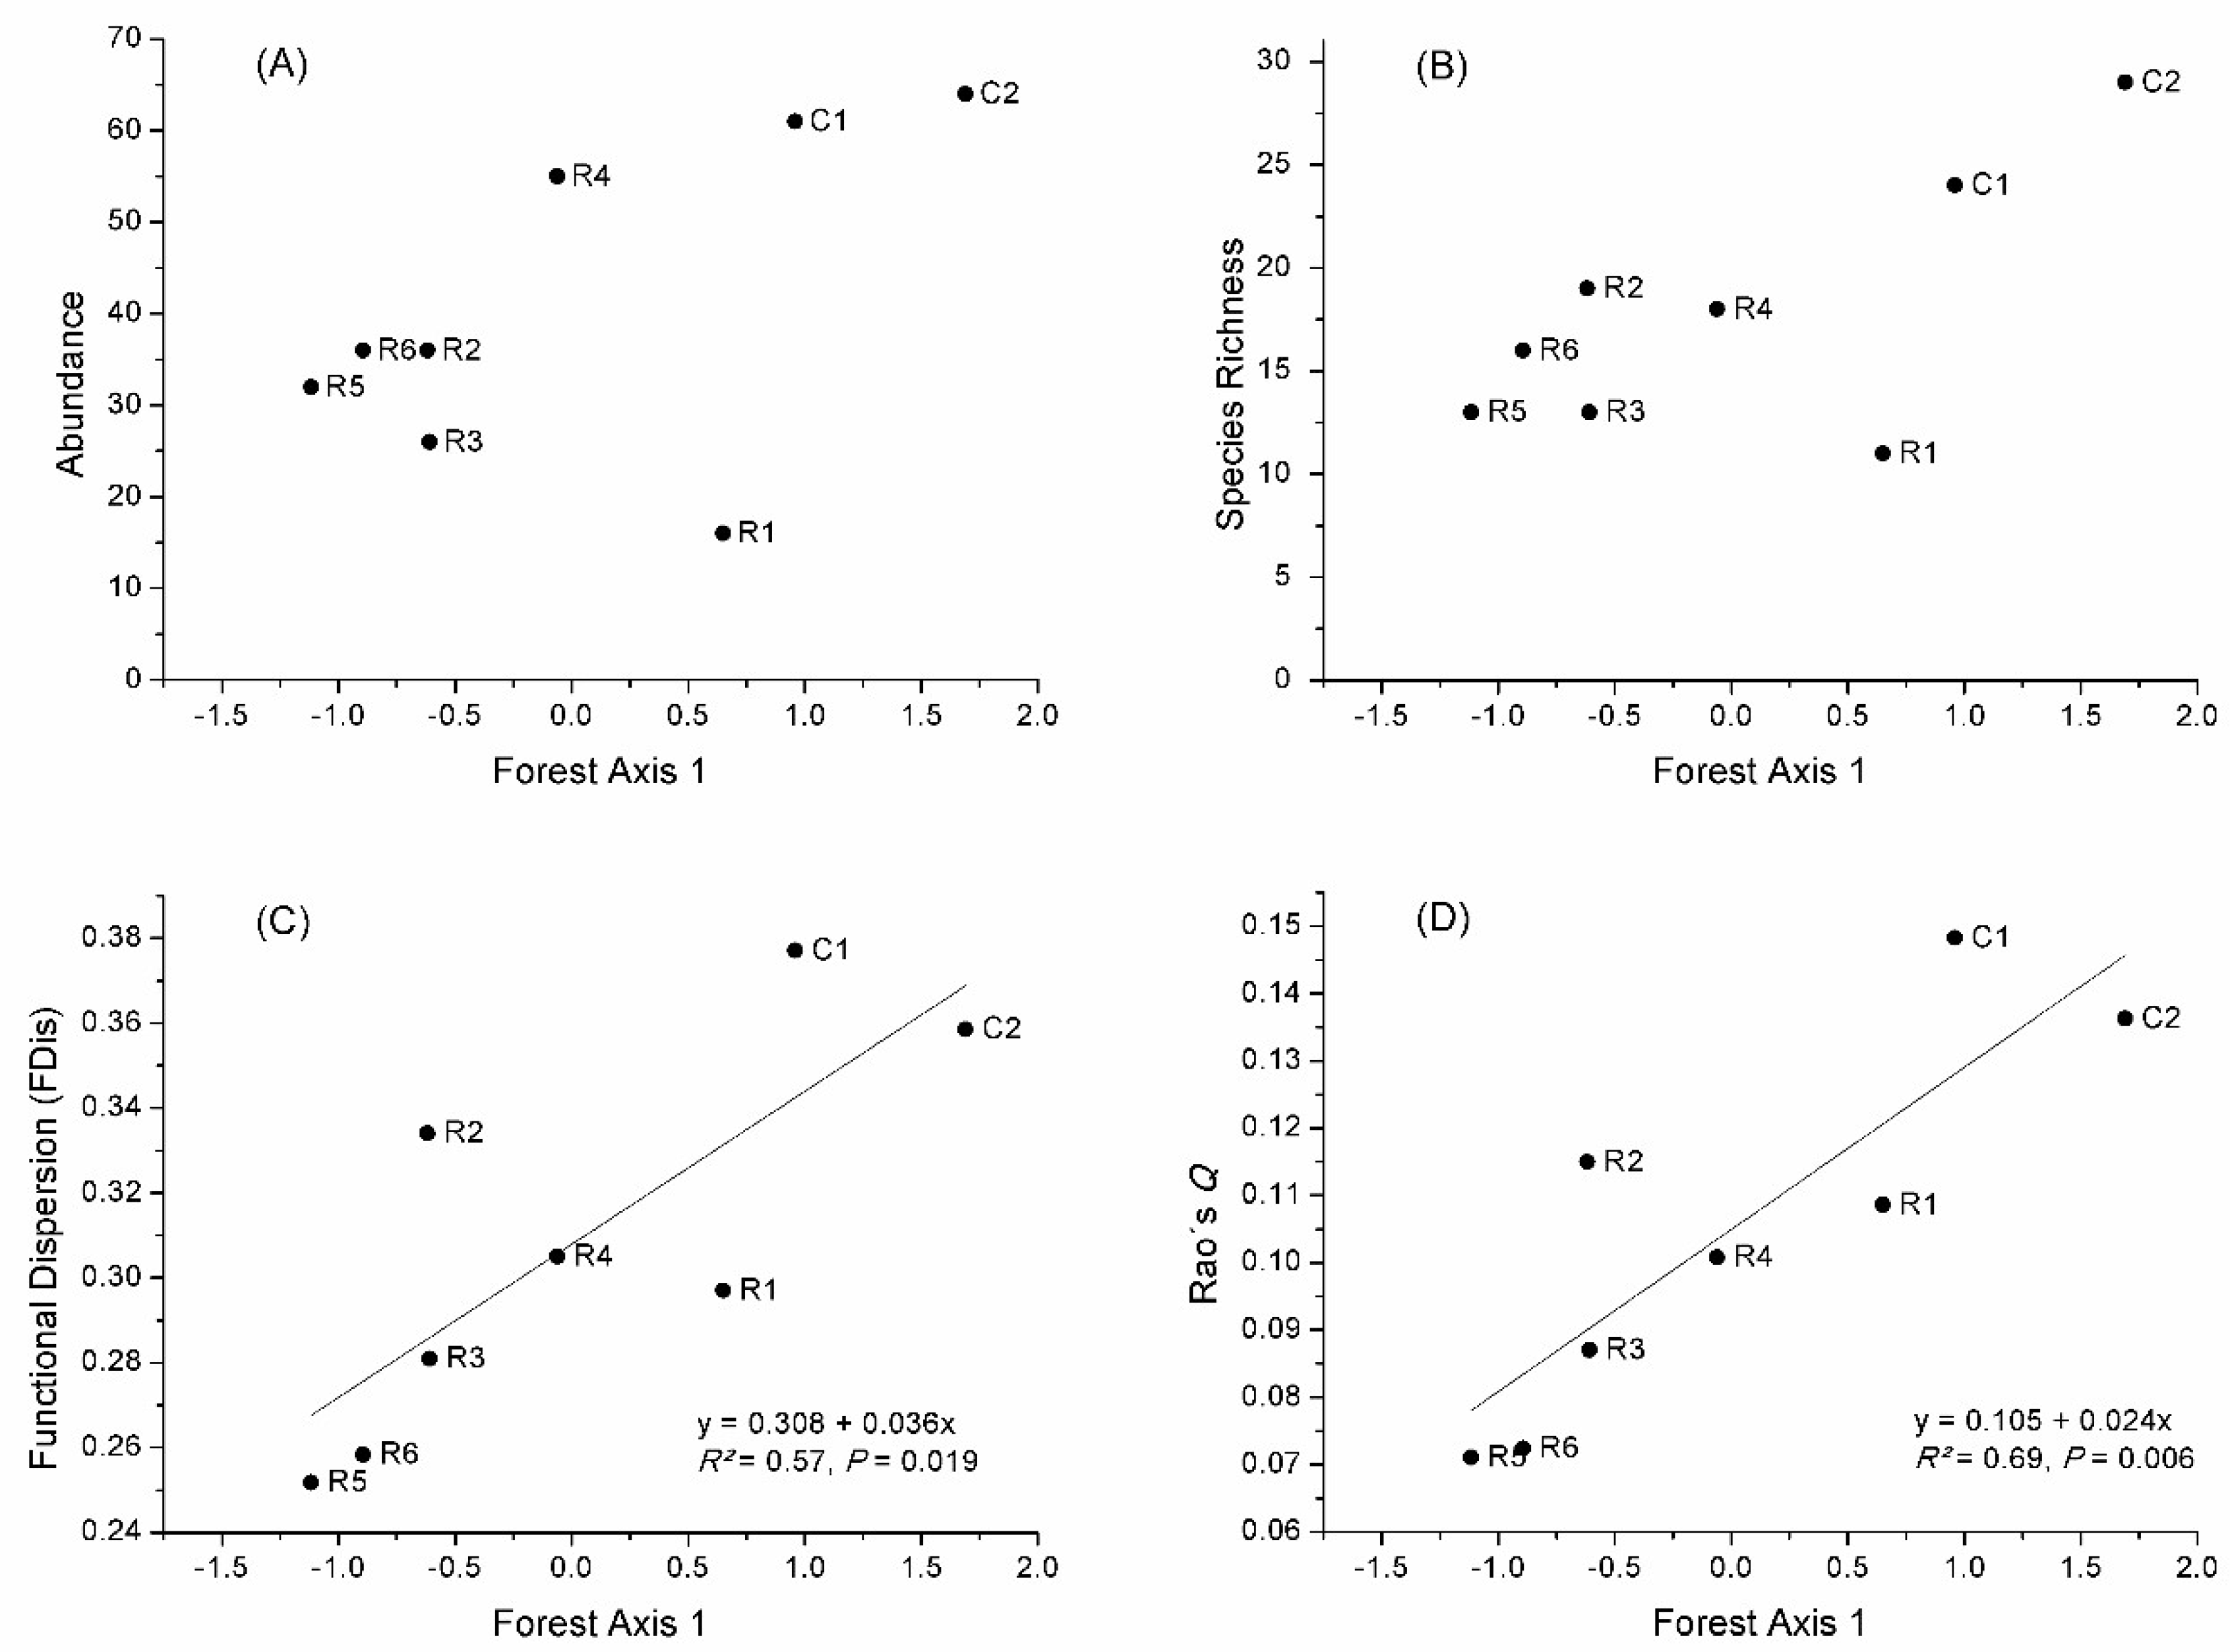
Reference sites had higher abundance and species richness than all the restored sites (Figure 2). Forest Axis 1 did not influence significantly bird abundance (p = 0.180) and species richness (p = 0.077), because R1 had lower values for both variables. On the other hand, functional diversity indices (FDis and Rao’s Q) were strongly related to Forest Axis 1 (Figure 2). Only 17% of the species recorded at all sites were highly dependent on forest, whereas an intermediate dependence on forest was observed for most (45.3%) species (Table A2). Further, most recorded species (60.4%) include insects in their diet, with 35.8% of the total being exclusively insectivores. Most species forage (37.7%) or build their nests (49.1%) in the canopy, whereas 24.5% forage and 39.6% build their nests in the understory (Table A2).
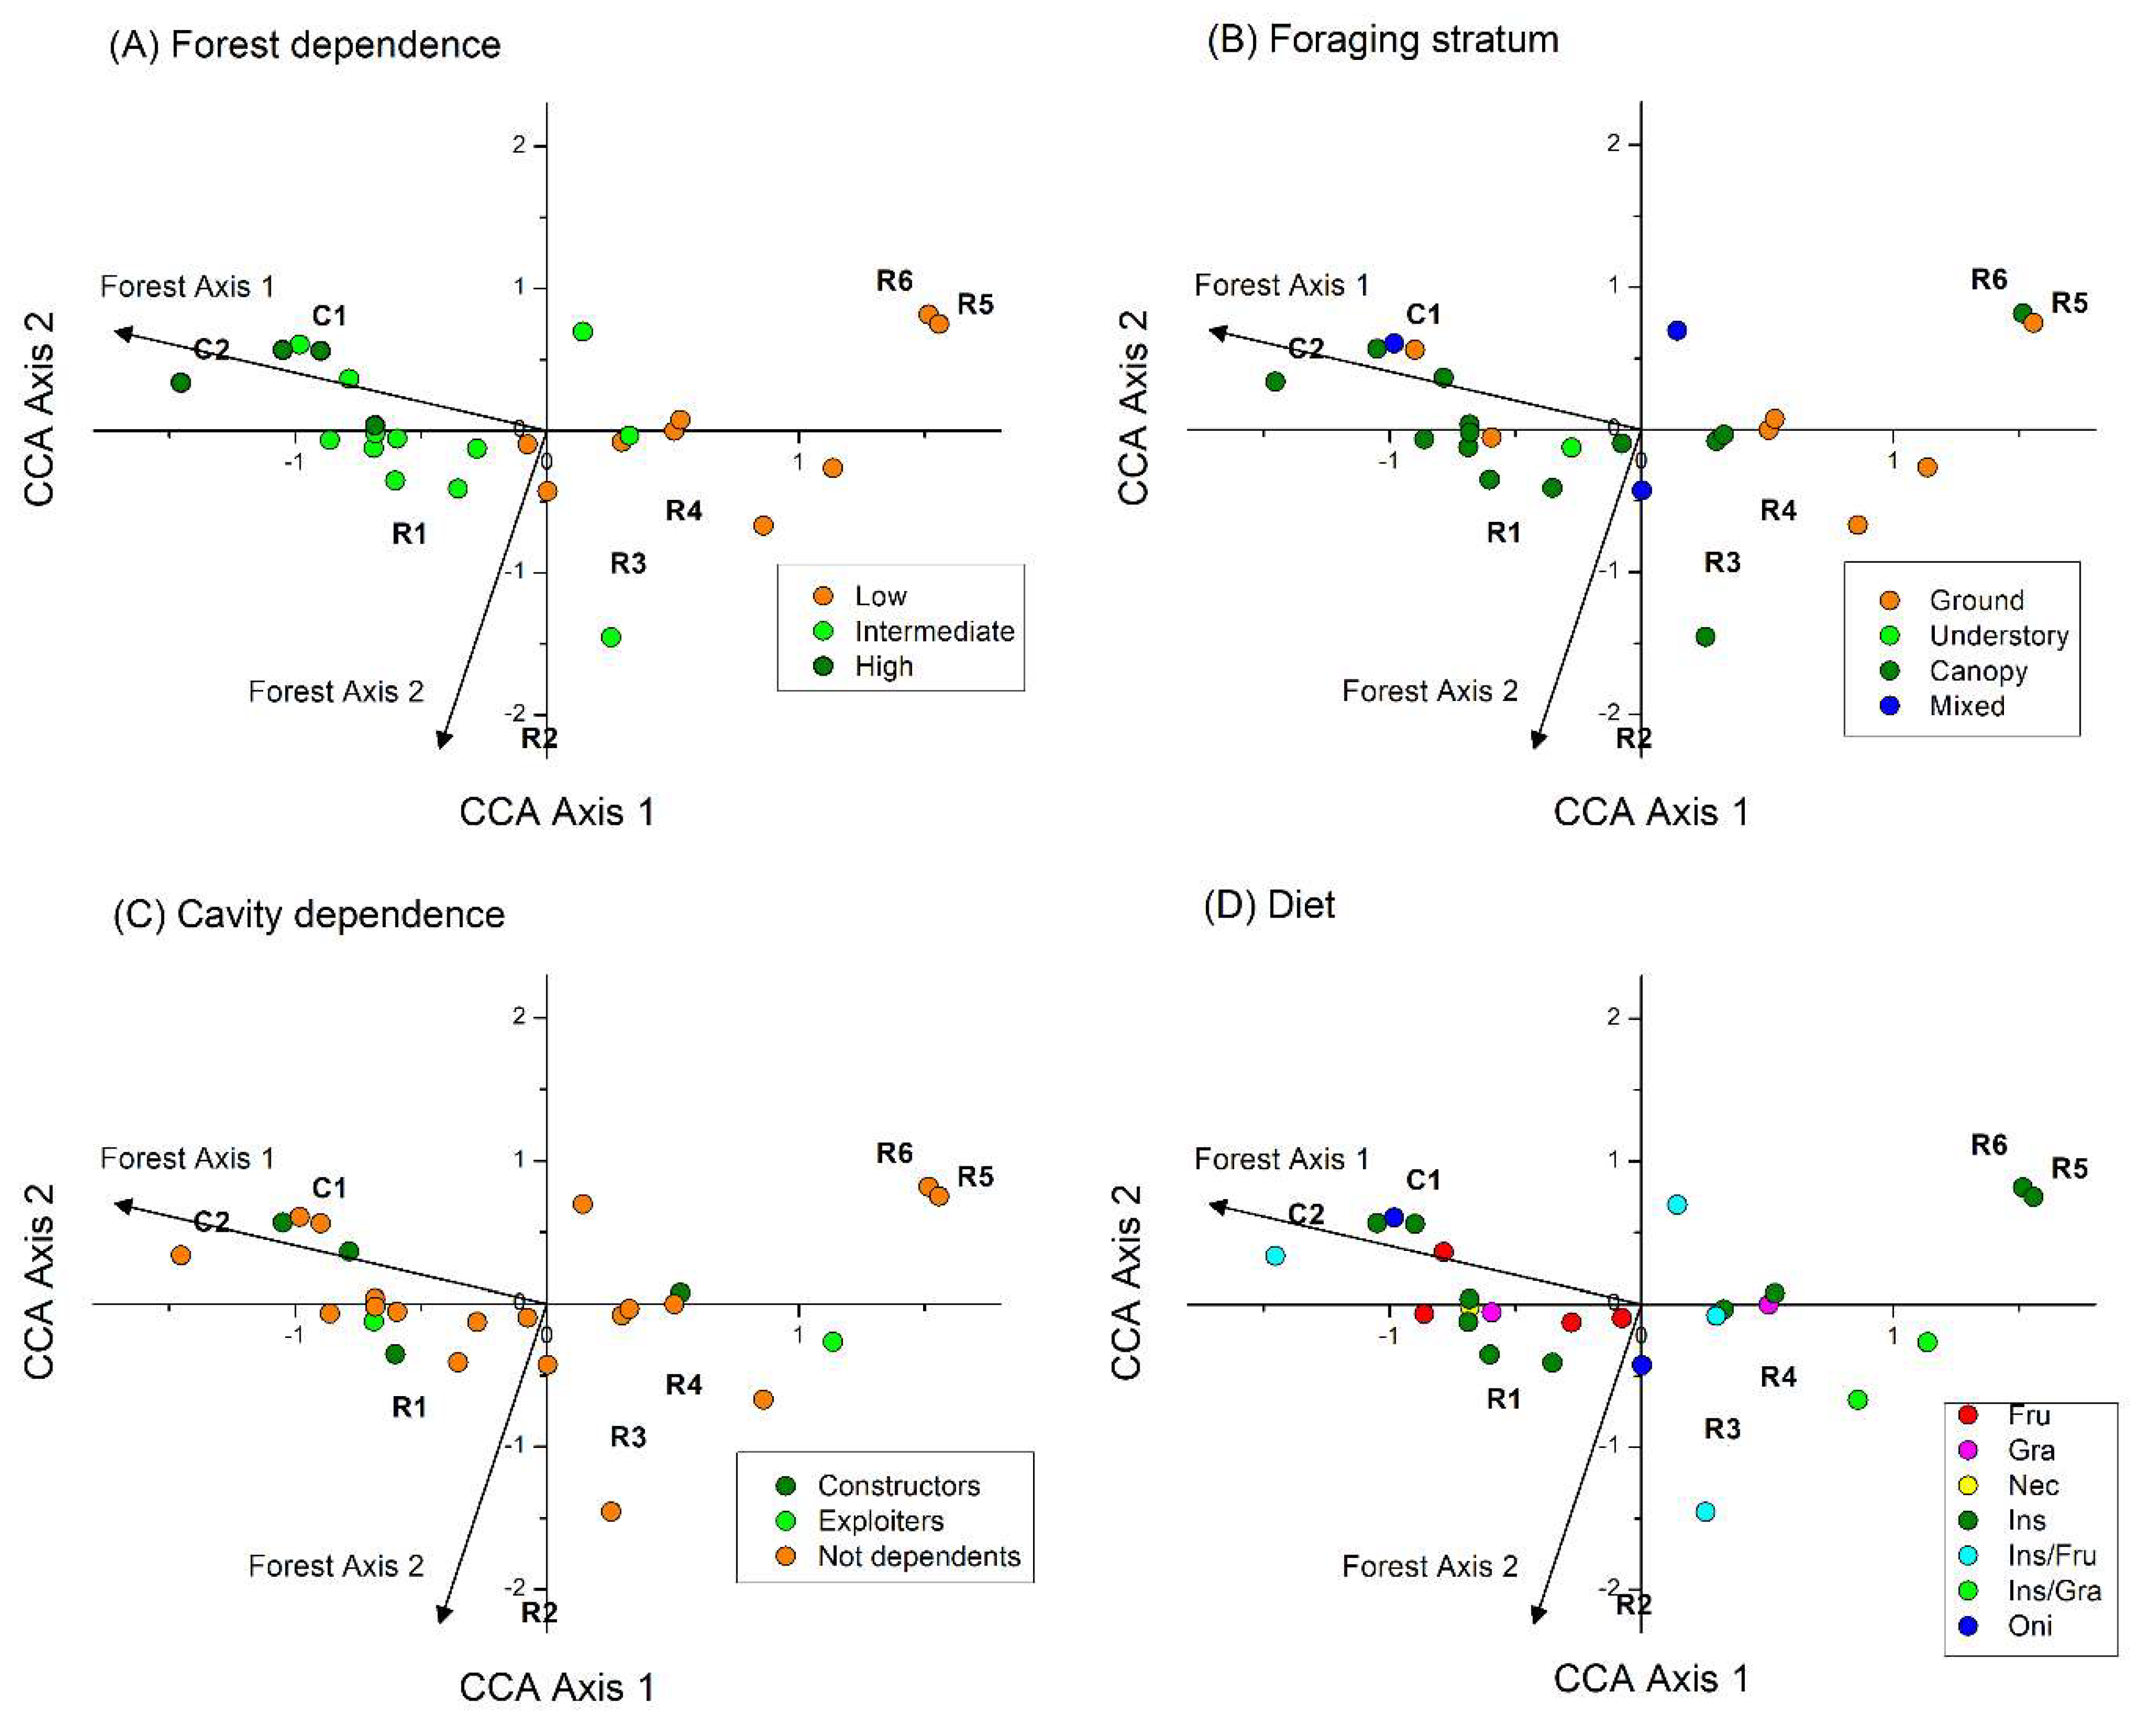
The CCA analyses by functional category showed that only Forest Axis 1 significantly influenced the abundances per sites within levels of functional categories for forest dependence (82.3% of the variance explained), foraging strata (51.9%), diet (49.1%), and cavity dependence for nesting (49.5%). Nest height groups were not influenced by any forest axes (p > 0.05). Recorded bird species represented 28 combinations of forest dependence, foraging stratum, diet, and cavity dependence for nesting. We excluded nest height from these combinations since it was not influenced by any forest axes. The CCA showed that the relative abundance of these combinations was influenced by both Forest Axis 1 (p = 0.005) and Forest Axis 2 (p = 0.040), and together they explained 56.9% of the total variation. The first CCA axis explained 76.4% of the explained variation in the relative abundance of combined functional traits, while the second axis explained 23.6% of this variation.
The CCA displayed a forest dependency gradient with low forest-dependent birds occurring at sites with smaller trees and higher grass cover, and high forest-dependent birds at sites with more developed forests and taller trees, representing higher tree biomass (Figure 3A). Therefore, sites with more tree biomass attracted predominantly species with high and intermediate forest dependence, which foraged in the canopy and understory, were mainly nectarivores, frugivores and insectivore specialists, and included species that constructed cavities for their nests (Figure 3A–D). In the sites with smaller trees we recorded species that combined traits that included not only low forest dependency, but they also foraged mostly on the ground, were consumers of insects (specialized or associated with seeds) and presented no cavity dependency for nesting.
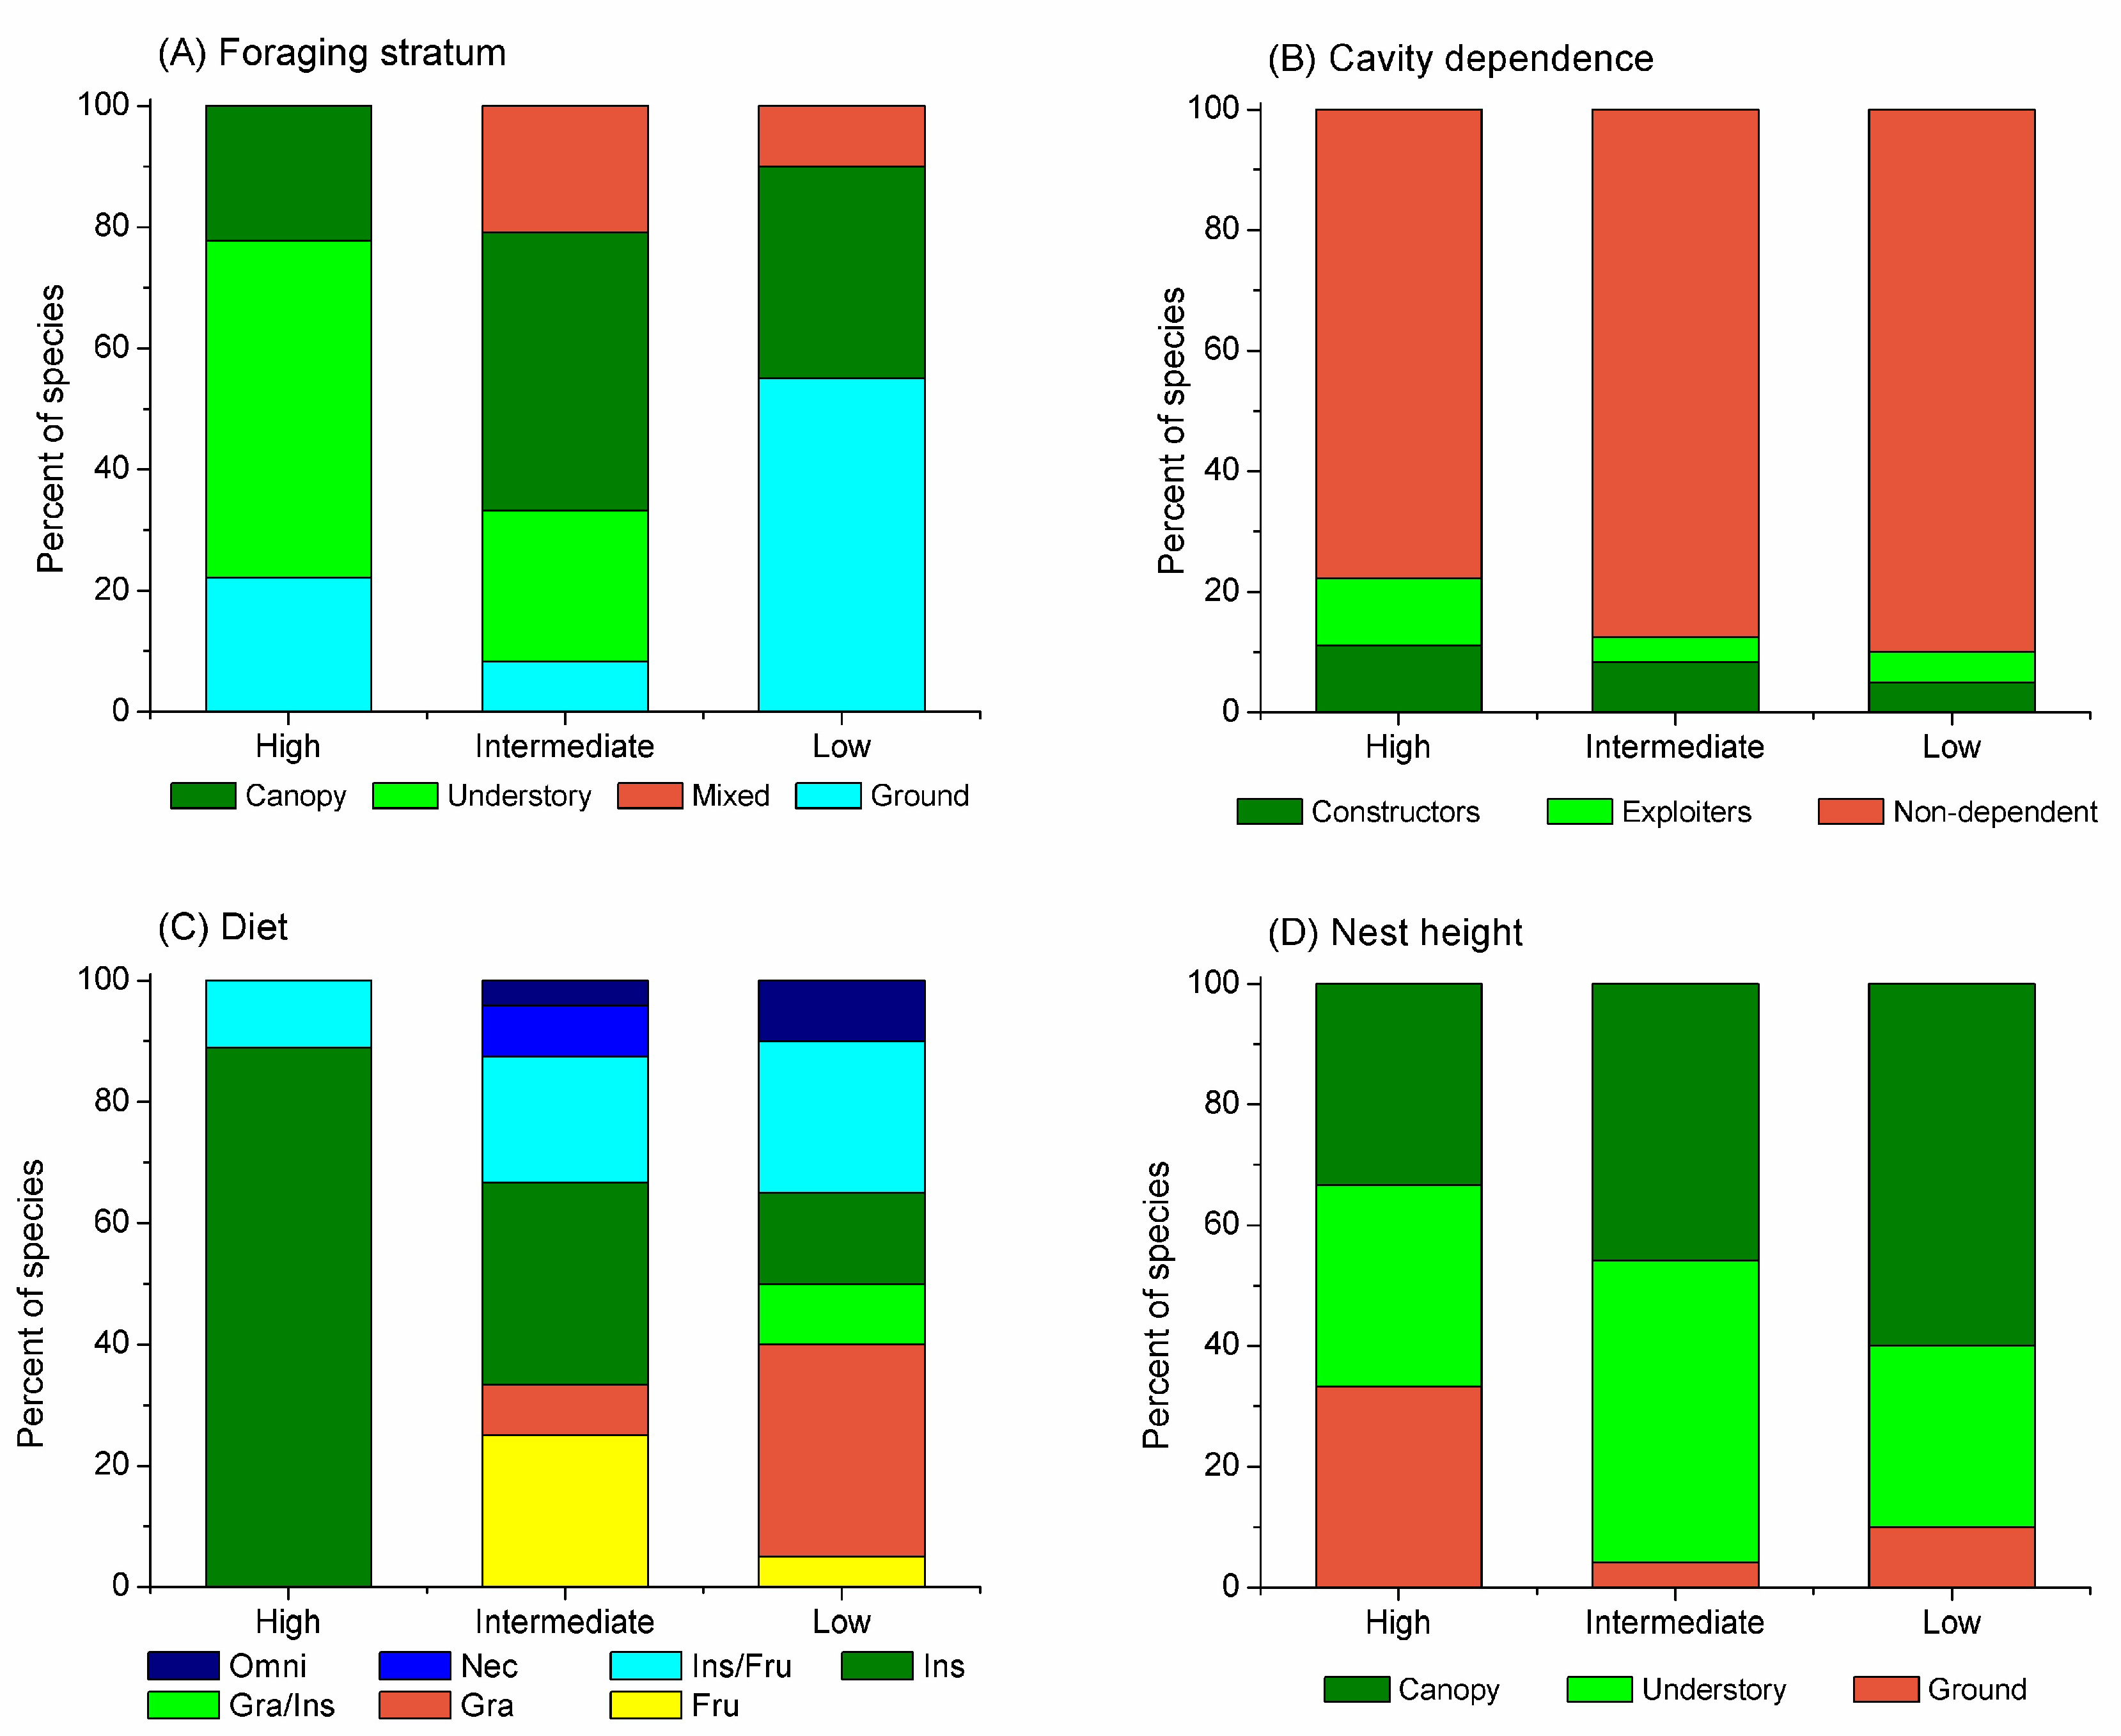
Species that differed in forest dependence also foraged in different strata (χ² = 19.9, gl = 6, p = 0.002). Most species with high forest dependence foraged in the understory (Figure 4A). Most recorded species did not depend on cavities for nesting (χ² = 1.035, gl = 4, p = 1.0), but species that were highly and intermediately dependent on forests included cavity constructors and exploiters (Figure 4B). Species that differed in relation to forest dependence also differed largely about their diets (χ² = 28.2, gl = 12, p = 0.003; Figure 4C). Most of the species highly dependent on forest were mainly exclusively insectivores, and only the Streaked Flycatcher (Myodinastes maculatus) was an insectivore that also included fruits in the diet. Finally, species with high forest dependence presented the same number of species building nests on the ground, in the understory and in the canopy, whereas those with low forest dependence built nests mainly in the canopy (Figure 4D); however, these differences were not significant (χ² = 7.17, gl = 4, p = 0.129).
4. Discussion
The age of the riparian forests under restoration was weakly related with forest structure, presumably in consequence of stressors and natural disturbances after seedling reintroduction. Other studies also found variation in forest structure variables when comparing similar-aged restored sites in tropical systems [13,55]. Forest structure showed large variation among sites, even among those of the same age. For example, R4, R5 and R6 are of the same age, and the management for the reintroduction of the seedlings was carried out in the same way. However, cattle still accessed frequently sites R5 and R6 at the time of the study, but this did not occur at site R4, which was totally isolated from cattle. Cattle trampling affected negatively the growth and survival of both reintroduced trees and immigrant plants, resulting in less trees, which were shorter in R5 and R6 than in R4. Accordingly, we observed that understory foraging bird species were less abundant in R5 and R6. Also, a frost in the second year after seedling planting killed many reintroduced trees in R2 and R3, but caused few deaths in the individuals of R1, which was established one year before R2 and R3. Most studied sites under restoration still had high grass cover (except R1 and R4), which can be related to the high mortality and low growth rates of reintroduced tree seedlings. Low tree density hinders the formation of a dense canopy that would reduce light incidence, thereby controlling grass cover.
Seedling reintroduction in restoration projects aims to promote a growing similarity between reference and restoring sites by recovering forest attributes, such as canopy height and tree density. However, other vegetation structural aspects, such as large-diameter trees, understory richness and density, large debris, dead branches, fallen trunks and the native herbaceous layer are only partially recovered [56,57]. For example, tree species richness and flower functional diversity in Atlantic Forest sites under restoration became similar to reference sites in about two decades, but the same did not occur with understory and herbaceous species [58]. The understory of restored sites starts developing slowly some years after seedling reintroduction [13]. Indeed, forest structure can take more than 30 years to approach those of reference sites depending on the distance of propagule sources (i.e., natural remnants) [59]. Although R1 was in the neighborhood of natural remnants and had low grass cover, the canopy was dense and closed which probably limited the development of the understory. Therefore, there were very few tree and shrub saplings in R1, resulting in the absence of these lower layers below the canopy. César et al. [60] found a similar pattern when monitoring mixed-species tree plantings, second-growth forests, and reference forests in nearby regions; they found that tree plantings that were between 7 and 20 years old had significantly less small trees (1–5 cm dbh) than second-growth forests of the same age, with limited recolonization of native trees and lianas. Therefore, when restored forests grow enough to close the canopies, these conditions may limit the growth of lower vegetation layers, simplifying forest complexity and resulting in low bird abundances.
The time interval necessary for restoration sites to reach the bird species richness similar to reference sites is highly variable, and depends on the development of forest structure complexity, especially the development of understory and lower layers, as found in other systems [15,24,61]. In general, bird species richness varied among restoration sites and was lower than that of reference sites, following the same trend of vegetation structure, suggesting that the study sites are in an early stage of development. Forest structure did not influence bird abundances and species richness due to the simplified forest structure in R1, which resulted in an assemblage with low bird abundances and, consequently, lower species richness. Also, the co-occurrence of birds with low- and high-forest dependence in the intermediate stages of forest development in sites under restoration can produce a cumulative effect, so that bird species richness can temporarily reach that of reference sites [34]. In our study, this accumulation was not enough to produce this effect, due to the low abundance of bird species of intermediate and (mainly) high forest dependence in intermediate areas, such as R4.
When considering functional traits, functional diversity indicators were strongly related to Forest Axis 1. The largest differences between the responses of species richness and functional diversity to the development of forest structural complexity were related to the R1 site (Figure 2). Both FDis and Rao’s Q indices are independent of species richness and consider only the composition of the assemblage, weighted by species abundances [48]. Therefore, although R1 presented low species richness, the recorded species had more diverse traits that responded to the variables of forest structure related to tree biomass (tree height, canopy depth, and basal area), represented by Forest Axis 1. Although lower layers were not present in this area, the presence of large canopies provide high resource diversity and spatial heterogeneity within the canopies for the birds [23,24].
Forest structure influenced trait abundances of four bird functional categories (i.e., diet, foraging stratum, cavity dependence for nesting and forest dependence). The distribution pattern of diet types observed throughout the forest structure gradient was similar to that reported by Becker et al. [34] in restoring sites of Araucaria forest in southern Brazil. We observed a replacement of generalists of low forest dependence by specialist birds such as frugivorous and nectarivorous birds at sites with more complex forest structure. Ground foragers occurred mainly in sites with lower trees, while canopy and understory foragers occurred in sites with taller trees. Most cavity constructor species were associated to higher values of tree biomass represented by Forest Axis 1, presumably due to the presence of adequate substrates (i.e., large trees) for cavity construction. These patterns suggest that the birds were actively selecting restored sites according to their ecological requirements and forest structure, indicating that a wide range of ecosystem functions performed by birds were likely being recovered.
The species more characteristic of open areas were insectivores or insectivore/granivores, which were all of low forest dependence. These combinations of traits were represented, for example, by the canopy forager Fork-tailed Flycatcher (Tyrannus savana), and the ground foragers Rufous Hornero (Furnarius rufus), Cattle Tyrant (Machetornis rixosa), House Wren (Troglodytes musculus), and Rufous-collared Sparrow (Zonotrichia capensis). Some other combinations of traits were common to most studied sites and represent the faunal transition between more open sites and those with more developed forests. Amongst those, predominate the ones that include fruits in their diet, generally associated with insects and small vertebrates (mainly the Chalk-browed Mockingbird Mimus saturninus and species of Tyrannidae and Turdidae), ground-foraging granivores (Picazuro Pigeon Patagioenas picazuro, Eared Dove Zenaida auriculata, seedeaters such as Sporophila spp., and species of Icteridae), as well as some understory insectivores such as the Yellow-chinned Spinetail (Certhiaxis cinnamomeus), the Masked Yellowthroat (Geothlypis aequinoctialis), and the Narrow-billed Woodcreeper (Lepidocolaptes angustiirostris).
Some studies suggest that the avifauna of restored sites does not differ from open areas during the first four or five years of forest growth [15,18]. Contrastingly, Jansen [43] found that bird species of intermediate forest dependence equally occupied restored sites and natural remnants just three years after restoration in an Australian rain forest. However, our results showed that the forest structure had large variation even among sites of the same age (e.g., R4, R5, R6), presumably due to sporadic disturbance events and anthropogenic stressors. In this context, the composition of bird species and functional traits responded better to forest structure than to the age of plantings. Therefore, the present approach can provide a better assessment of the avifaunal response to forest restoration, by considering a direct assessment of forest structure rather than its age, since the time for forest structure recovery may strongly depend on several factors such as soil characteristics, short-term climatic stochasticity, and anthropogenic stressors.
Birds have high mobility at moderate spatial scales [62], so that the small spatial scale of our study enabled to isolate the effect of forest structure from the effects of spatial barriers to bird dispersal to sites under restoration. Forest structure can have strong effects on their avian assemblage composition [17,35]. In fact, the structural complexity of the vegetation can affect bird assemblages more than floristic richness [24], even at local scales [44,63]. We observed higher abundances of high forest-dependent bird species in reference sites than in restored ones. Some studies propose that the occurrence of high forest-dependent species in areas under restoration is closely related to their proximity with source sites, from which these birds could extend their territories over restored sites [15]. However, our results add evidence to the role of forest structure as an ecological filter for more specialized forest-dependent species of the bird assemblages, since our study sites were adjacent or close to strips of remnant riparian forests.
These results show that forest dependency was the major functional trait reflecting the trajectory of the bird assemblages from more degraded areas to restored areas to reference sites. However, forest dependency is also related to other functional traits (Figure 4A–D). In the areas with higher tree biomass, four combinations of traits represent the transition from intermediate to high forest dependence. These combinations include species that contain insects in their diet, whether associated or not to fruits (M. maculatus), and small vertebrates, such as the omnivore Curl-crested Jay (Cyanocorax cristatellus), which only occurred in the reference areas. The insectivores in these areas present high forest dependency and forage at the ground level (the Saffron-billed Sparrow Arremon flavirostris and the Flavescent Warbler Myiothlyps flaveola) and in the canopy (the Rufous-browed Peppershrike Cyclarhis gujanensis). The replacement of species with low forest dependency by those of high forest dependency with the development of the vegetation was also observed in restored areas within Araucaria forest, southern Brazil [34]. However, in our study species that were intermediate in forest dependency increased in restored areas with the forest development and biomass accrual, whereas in their study these species did not respond to forest development.
Our results showed that the forest structure influences the predominant functional traits of bird species in riparian sites under restoration. The restored forests studied were recolonized by bird species of reference sites that are specialists in relation to their diets, foraging stratum, cavity-dependence for nesting and forest dependence. Thus, the recovery of the canopy layer alone can initially result in lower abundance and species richness, but the composition of the bird assemblages, reflected in the functional traits studied, suggests that the restoration trajectory approaches that of reference sites. The evaluation of the trajectory of ecosystems under restoration, the rescue of their functions, and the similarity to reference areas can be influenced by the metrics selected. Forest structural parameters can influence the assemblage that occupy a determined habitat due to the requirement of resources such as perch availability, fallen logs, and microclimate conditions [64]. Species richness and other taxonomic diversity indices are the most used parameters, but the use of functional traits seems more adequate to evaluate the response of bird assemblages to the recovery of the vegetation.
Author Contributions
Conceptualization, A.F.B. and A.L.T.S.; Data curation, A.F.B. and A.L.T.S.; Formal analysis, A.F.B., M.O.T. and A.L.T.S.; Investigation, A.F.B., M.O.T. and A.L.T.S.; Methodology, A.F.B. and A.L.T.S.; Software, A.F.B., M.O.T. and A.L.T.S.; Supervision, A.L.T.S.; Writing—Original draft, A.F.B., M.O.T. and A.L.T.S.; Writing—Review & editing, A.F.B., M.O.T. and A.L.T.S.
Funding
This research received no external funding.
Acknowledgments
We are grateful to CAPES for the fellowship (A.F.B.), to Flávio Marchesin (Escola da Floresta-Sítio São João) for the logistical support, to Danilo Muniz for the help in analyses, and to Janaina Fernandes, Julie Scallopi, Liseth Beltran, Luciana Bachega and Raul Sampaio for field assistance.
Conflicts of Interest
The authors declare no conflict of interest.
Appendix A

Table A1.
Tree seedling species reintroduced in the restoration sites (R1–R6) of the study area.
| Species | Author(s) | Species | Author(s) |
|---|---|---|---|
| Aegiphila integrifolia Alchornea glandulosa Aloysia virgata Amaioua guianensis Aspidosperma cylindrocarpon Aspidosperma parvifolium Aspidosperma polyneuron Aspidosperma ramiflorum Astronium graveolens Bastardiopsis densiflora Bauhinia forficata Calyptranthes clusiifolia Cariniana estrellensis Cariniana legalis Cecropia pachystachya Cedrela fissilis Cedrela odorata Centrolobium tomentosum Chorisia speciosa Citharexylum myrianthum Colubrina glandulosa Cordia ecalyculata Coutarea hexandra Croton floribundus Croton urucurana Dictyoloma vandellianum Diospyros inconstans Enterelobium contorstisilicum Esenbeckia febrifuga Esenbeckia leiocarpa Eugenia brasiliensis Eugenia uniflora Euterpe edulis Gallesia integrifolia Genipa americana Guarea guidonia | (Jacq.) Moldenke Poepp. & Endl. (Ruiz & Pav.) Juss. Aubl. Muell. Arg. A. DC. Muell. Arg. Müll. Arg. Jacq. (Hook. & Arn.) Hassl. Link O. Berg (Raddi) Kuntze (Mart.) Kuntze Trécul Vell. L. Guillen. ex Benth. A. St.-Hil. Cham. Perkins Vell. (Jacq.) K. Schum. Spreng. Baill. A. Juss. Jacq. (Vell.) Morong (A. St. Hil.) A. Juss. ex Mart. Engl. Lam. L. Mart. (Spreng.) Harms L. (L.) Sleumer | Guazuma ulmifolia Handroanthus impetiginosus Handroanthus ochraceus Heliocarpus americanus Inga marginata Inga vera Jacaranda cuspidifolia Lafoensia glyptocarpa Lithraea molleoides Lonchocarpus guilleminianus Maytenus robusta Myrciaria tenella Myroxylon peruiferum Parapiptadenia rigida Patagonula americana Peltophorum dubium Poecilanthe parviflora Prunus myrtifolia Psidium cattleianum Psidium rufum Pterocarpus violaceus Pterogyne nitens Rhamnidium elaeocarpum Schizolobium parahyba Seguieria langsdorffii Tabebuia avellanedae Tabebuia chrysotricha Tabebuia heptaphylla Tabebuia roseoalba Tabebuia umbellata Tabernaemontana catharinensis Talauma ovata Tapiria guianensis Tibouchina granulosa Trema micrantha Zeyheria tuberculosa | Lam. (Mart. ex DC.) Mattos (Cham.) Mattos L. Willd. (DC.) T. D. Penn. Mart. Koehne (Vell.) Engl. (Tul.) Malme Reissek (DC.) O. Berg F. (Benth.) Brenan L. (Spreng.) Taub. Benth. (L.) Urb. Sabine Mart. ex DC. Vog. Tul. Reissek (Vell.) Blake Moq. (Mart. ex DC.) Standl. (Mart. ex A. DC.) Standl. (Vell.) Toledo (Ridl.) Sandwith (Sond.) Sandwith A. DC. St. Hil. Aubl. (Desr.) Cogn. (L.) Blume (Vell.) Bureau ex Verl. |
Table A2.
Functional traits of bird species recorded in study areas. G = granivore, O = omnivore, I = insectivore, F = frugivore, N = nectarivore, I/F = insectivore and frugivore, I/G = insectivore and granivore, ND = not dependent of cavities. * species recorded only in reference sites. ** species recorded only in sites under restoration.
| Family | Species | Diet | Foraging Stratum | Nesting Height | Cavity Dependence | Forest Dependence |
|---|---|---|---|---|---|---|
| Passerellidae | Arremon flavirostris * | I | Ground | Ground | ND | High |
| Furnariidae | Certhiaxis cinnamomeus ** | I | Understory | Understory | ND | Intermediate |
| Corvidae | Cyanocorax cristatellus * | O | Mixed | Canopy | ND | Intermediate |
| Thraupidae | Coereba flaveola | N | Understory | Understory | ND | Intermediate |
| Vireonidae | Cyclarhis gujanensis * | I | Canopy | Canopy | ND | High |
| Troglodytidae | Cantorchilus leucotis * | I | Understory | Understory | ND | High |
| Tyrannidae | Camptostoma obsoletum ** | I/F | Canopy | Canopy | ND | Intermediate |
| Columbidae | Columbina squammata | G | Ground | Understory | ND | Intermediate |
| Columbidae | Columbina talpacoti | G | Ground | Understory | ND | Low |
| Furnariidae | Cranioleuca vulpina | I | Understory | Understory | ND | High |
| Thraupidae | Dacnis cayana * | F | Canopy | Canopy | ND | Intermediate |
| Fringillidae | Euphonia chlorotica * | F | Canopy | Canopy | ND | Intermediate |
| Tyrannidae | Elaenia sp. ** | I/F | Canopy | Understory | ND | Low |
| Tyrannidae | Empidonomus varius ** | I/F | Canopy | Canopy | ND | Intermediate |
| Furnariidae | Furnarius rufus ** | I | Ground | Canopy | Constructor | Low |
| Psittacidae | Forpus xanthopterygius | F | Canopy | Understory | Constructor | Intermediate |
| Parulidae | Geothlypis aequinoctialis | I | Understory | Ground | ND | Intermediate |
| Galbulidae | Galbula ruficauda * | I | Understory | Ground | Constructor | High |
| Icteridae | Icterus pyrrhopterus * | F | Canopy | Canopy | ND | Intermediate |
| Dendrocolaptidae | Lepidocolaptes angustiirostris | I | Understory | Understory | Exploiter | Intermediate |
| Columbidae | Leptotila verreauxi ** | G | Ground | Canopy | ND | Intermediate |
| Tyrannidae | Myiarchus ferox ** | I/F | Canopy | Canopy | ND | Intermediate |
| Parulidae | Myiothlyps flaveola | I | Ground | Ground | ND | High |
| Mimidae | Mimus saturninus ** | O | Mixed | Canopy | ND | Low |
| Tyrannidae | Myiodinastes maculatus * | I/F | Canopy | Canopy | Exploiter | High |
| Tyrannidae | Megarynchus pitangua | I/F | Canopy | Canopy | ND | Low |
| Tyrannidae | Machetornis rixosa ** | I | Ground | Canopy | ND | Low |
| Tyrannidae | Myiozetetes similis ** | I/F | Canopy | Canopy | ND | Low |
| Picidae | Picumnus albosquamatus | I | Canopy | Understory | Constructor | Intermediate |
| Cuculidae | Piaya cayana * | I | Understory | Canopy | ND | High |
| Icteridae | Pseudoleistes guirahuro ** | G | Ground | Understory | ND | Low |
| Columbidae | Patagioenas picazuro | G | Ground | Canopy | ND | Low |
| Trochilidae | Phaethornis pretrei | N | Understory | Understory | ND | Intermediate |
| Tyrannidae | Pitangus sulphuratus | O | Mixed | Canopy | ND | Low |
| Thraupidae | Sporophila caerulescens ** | G | Ground | Understory | ND | Low |
| Furnariidae | Synallaxis frontalis ** | I | Understory | Understory | ND | Intermediate |
| Thraupidae | Sporophila lineola ** | G | Ground | Understory | ND | Low |
| Thraupidae | Sicalis luteola ** | G | Ground | Ground | ND | Low |
| Furnariidae | Synallaxis spixi ** | I | Understory | Understory | ND | Intermediate |
| Tyrannidae | Serpophaga subcristata | I | Canopy | Canopy | ND | Intermediate |
| Tyrannidae | Tyrannus albogularis ** | I/F | Canopy | Canopy | ND | Low |
| Turdidae | Turdus amaurochalinus ** | I/F | Mixed | Understory | ND | Intermediate |
| Thraupidae | Tangara cayana | F | Canopy | Canopy | ND | Intermediate |
| Rhynchocyclidae | Todirostrum cinereum | I | Canopy | Canopy | ND | Intermediate |
| Thraupidae | Tachyphonus coronatus | F | Understory | Understory | ND | Intermediate |
| Thamnophilidae | Tamnophilus caerulescens * | I | Understory | Understory | ND | High |
| Turdidae | Turdus leucomelas * | I/F | Mixed | Understory | ND | Intermediate |
| Tyrannidae | Tyrannus melancholicus | I/F | Canopy | Canopy | ND | Low |
| Troglodytidae | Troglodytes musculus ** | I/G | Ground | Understory | Exploiter | Low |
| Tyrannidae | Tyrannus savana | I | Canopy | Canopy | ND | Low |
| Thraupidae | Tangara sayaca | F | Canopy | Canopy | ND | Low |
| Columbidae | Zenaida auriculata ** | G | Ground | Canopy | ND | Low |
| Emberizidae | Zonotrichia capensis ** | I/G | Ground | Ground | ND | Low |
References
- Naiman, R.J.; Decamps, H.; Mcclain, M.E. Riparia: Ecology, Conservation, and Management of Streamside Communities; Elsevier Academic Press: London, UK, 2005; ISBN 0-126-63315-0. [Google Scholar]
- Mccluney, K.E.; Poff, N.L.; Palmer, M.A.; Thorp, J.H.; Pole, G.C.; Williams, B.S.; Williams, M.R.; Baron, J.S. Riverine macrosystems ecology: Sensitivity, resistance, and resilience of whole river basins with human alterations. Front. Ecol. Environ. 2014, 12, 48–58. [Google Scholar] [CrossRef]
- Lees, A.C.; Peres, C.A. Conservation value of remnant riparian forest corridors of varying quality for Amazonian birds and mammals. Conserv. Biol. 2008, 22, 439–449. [Google Scholar] [CrossRef] [PubMed]
- Seaman, B.S.; Schulze, C.H. The importance of gallery forests in the tropical lowlands of Costa Rica for understorey forest birds. Biol. Conserv. 2010, 143, 391–398. [Google Scholar] [CrossRef]
- Fremier, A.K.; Kiparsky, M.; Gmur, S.; Aycrigg, J.; Craig, R.K.; Svancara, L.K.; Goble, D.D.; Cosens, B.; Davis, F.W.; Scott, J.M. A riparian conservation network for ecological resilience. Biol. Conserv. 2015, 191, 29–37. [Google Scholar] [CrossRef] [Green Version]
- Sweeney, B.W.; Bott, T.L.; Jackson, J.K.; Kaplan, L.A.; Newbold, J.D.; Standley, L.J.; Hession, W.C.; Horwitz, R.J. Riparian deforestation, stream narrowing, and loss of stream ecosystem services. Proc. Natl. Acad. Sci. 2004, 101, 14132–14137. [Google Scholar] [CrossRef] [PubMed] [Green Version]
- Kominoski, J.S.; Shah, J.J.F.; Canhoto, C.; Fischer, D.G.; Giling, D.P.; González, E.; Griffiths, N.A.; Larrañaga, A.; Leroy, C.J.; Mineau, M.M.; et al. Forecasting functional implications of global changes in riparian plant communities. Front. Ecol. Environ. 2013, 11, 423–432. [Google Scholar] [CrossRef]
- SER-Society for Ecological Restoration International Science and Policy Working Group. The SER International Primer on Ecological Restoration; Society for Ecological Restoration International: Tucson, AZ, USA, 2004; Available online: www.ser.org (accessed on 30 March 2018).
- Mansourian, S.; Vallauri, D. Restoring Forest Landscapes: Important Lessons Learnt. Environ. Manag. 2014, 53, 241–251. [Google Scholar] [CrossRef] [PubMed]
- Smith, B.; Clifford, N.J.; Mant, J. The changing nature of river restoration. Wiley Interd. Rev. Water 2014, 1, 249–261. [Google Scholar] [CrossRef]
- Stanturf, J.A.; Palik, B.J.; Dumroese, R.K. Contemporary forest restoration: A review emphasizing function. For. Ecol. Manag. 2014, 331, 292–323. [Google Scholar] [CrossRef]
- Naeem, S. Biodiversity and ecosystem functioning in restored ecosystems: Extracting principles for a synthetic perspective. In Foundations of Restoration Ecology; Palmer, M.A., Zedler, J.B., Falk, D.A., Eds.; Society for Ecological Restoration International and Island Press: Washington, DC, USA, 2006; pp. 210–237. ISBN 9781597260176. [Google Scholar]
- Suganuma, M.S.; Durigan, S. Indicators of restoration success in riparian tropical forests using multiple reference ecosystems. Restor. Ecol. 2015, 23, 238–251. [Google Scholar] [CrossRef]
- Holl, K.D. Tropical moist forest. In Handbook of Ecological Restoration; Perrow, M.R., Davy, A.J., Eds.; Cambridge University Press: Cambridge, UK, 2002; Volume 2, pp. 539–558. ISBN 0521791294. [Google Scholar]
- Catterall, C.P.; Freeman, A.N.D.; Kanowski, J.; Freebody, K. Can active restoration of tropical rainforest rescue biodiversity? A case with bird community indicators. Biol. Conserv. 2012, 146, 53–61. [Google Scholar] [CrossRef]
- Morrison, E.B.; Lindell, C.A.; Holl, K.D.; Zahawi, R.A. Using behavioural ecology to assess the quality of tropical forest restoration sites: Patch size effects on avian foraging patterns. J. Appl. Ecol. 2010, 47, 130–138. [Google Scholar] [CrossRef]
- Rey-Benayas, J.M.; Galvána, I.; Carrascal, L.M. Differential effects of vegetation restoration in Mediterranean abandoned cropland by secondary succession and pine plantations on bird assemblages. For. Ecol. Manag. 2010, 260, 87–95. [Google Scholar] [CrossRef] [Green Version]
- Lindell, C.A.; Cole, R.J.; Holl, K.D.; Zahawi, R.A. Migratory bird species in young tropical forest restoration sites: Effects of vegetation height, planting design, and season. Bird Conserv. Int. 2012, 22, 94–105. [Google Scholar] [CrossRef]
- Slocum, M.G.; Horwitz, C.C. Seed arrival under different genera of trees in a neotropical pasture. Plant Ecol. 2000, 49, 51–62. [Google Scholar] [CrossRef]
- Slocum, M.G. How tree species differ as recruitment foci in a tropical pasture. Ecology 2001, 82, 2547–2559. [Google Scholar] [CrossRef]
- Zamora, C.O.; Montagnini, F. Seed rain and seed dispersal agents in pure and mixed plantations of native trees and abandoned pastures at La Selva Biological Station, Costa Rica. Restor. Ecol. 2007, 15, 453–461. [Google Scholar] [CrossRef]
- Twedt, D.J.; Wilson, R.R.; Henne-Kerr, J.L.; Grosshuesch, D.A. Avian response to bottomland hardwood reforestation: The first 10 years. Restor. Ecol. 2002, 10, 645–655. [Google Scholar] [CrossRef]
- Brady, C.J.; Noske, R.A. Succession in bird and plant communities over a 24-year chronosequence of mine rehabilitation in the Australian Monsoon tropics. Restor. Ecol. 2010, 18, 855–864. [Google Scholar] [CrossRef]
- Munro, N.T.; Fischer, J.; Barrett, G.; Wood, J.; Leavesley, A.; Lindenmayer, D.B. Bird’s response to revegetation of different structure and floristics-are “restoration plantings” restoring bird communities? Restor. Ecol. 2011, 19, 223–235. [Google Scholar] [CrossRef]
- Reid, J.L.; Harris, J.B.C.; Zahawi, R.A. Avian habitat preference in Tropical Forest restoration in southern Costa Rica. Biotropica 2012, 44, 350–359. [Google Scholar] [CrossRef]
- Gould, S.F.; Mackey, B.G. Site vegetation characteristics are more important than landscape context in determining bird assemblages in revegetation. Restor. Ecol. 2015, 23, 670–680. [Google Scholar] [CrossRef] [Green Version]
- Gillies, C.S.; Clair, C.C.S. Riparian corridors enhance movement of a forest specialist bird in fragmented tropical forest. Proc. Natl. Acad. Sci. 2008, 105, 19774–19779. [Google Scholar] [CrossRef] [PubMed] [Green Version]
- Santos-Junior, P.C.A.; Marques, F.C.; Lima, M.R.; dos Anjos, L. The importance of restoration areas to conserve bird species in a highly fragmented Atlantic forest landscape. Nat. Conserv. 2016, 14, 1–7. [Google Scholar] [CrossRef]
- Cosset, C.C.; Edwards, D.P. The effects of restoring logged tropical forests on avian phylogenetic and functional diversity. Ecol. Appl. 2017, 27, 1932–1945. [Google Scholar] [CrossRef] [PubMed] [Green Version]
- Casas, G.; Darski, B.; Ferreira, P.M.; Kindel, A.; Müller, S.C. Habitat structure influences the diversity, richness and composition of bird assemblages in successional Atlantic rain forests. Trop. Conserv. Sci. 2016, 9, 503–524. [Google Scholar] [CrossRef]
- Rolo, V.; Olivier, P.I.; Van Aarde, R. Tree and bird functional groups as indicators of recovery of regenerating subtropical coastal dune forests. Restor. Ecol. 2017, 25, 788–797. [Google Scholar] [CrossRef]
- Paxton, E.H.; Yelenik, S.G.; Borneman, T.E.; Rose, E.T.; Camp, R.J.; Kendall, S.J. Rapid colonization of a Hawaiian restoration forest by a diverse avian community. Restor. Ecol. 2018, 26, 165–173. [Google Scholar] [CrossRef]
- Malan, G.; Meyer, E.; Panagos, M.D. Riparian-zone rehabilitation in pine plantations: Grassland vs woodland for plants and birds. S. Afr. J. Wildl. Res. 2007, 37, 159–178. [Google Scholar] [CrossRef]
- Becker, R.G.; Paise, G.; Pizo, M.A. The structure of bird communities in areas revegetated after mining in southern Brazil. Rev. Bras. Ornitol. 2013, 21, 221–234. [Google Scholar]
- Ortega-Álvarez, R.; Lindig-Cisneros, R.; Macgregor-Fors, I.; Renton, K.; Schondube, J.E. Avian community responses to restoration efforts in a complex volcanic landscape. Ecol. Eng. 2013, 53, 275–283. [Google Scholar] [CrossRef]
- Cianciaruso, M.V.; Silva, I.A.; Batalha, M.A. Phylogenetic and functional diversities: New approaches to community Ecology. Biota Neotrop. 2009, 9, 93–103. [Google Scholar] [CrossRef]
- Sayer, C.A.; Bullock, J.M.; Martin, P.A. Dynamics of avian species and functional diversity in secondary tropical forests. Biol. Conserv. 2017, 211, 1–9. [Google Scholar] [CrossRef]
- Alvares, C.A.; Stape, J.L.; Sentelhas, P.C.; Gonçalves, J.L.M.; Sparovek, G. Köppen’s climate classification map for Brazil. Meteorol. Z. 2013, 22, 711–728. [Google Scholar] [CrossRef]
- Oliveira, C.H. Planejamento Ambiental na Cidade de São Carlos (SP) com Ênfase nas Áreas Públicas e Áreas Verdes: Diagnóstico e Propostas. Master’ Thesis, Universidade Federal de São Carlos, São Carlos, Brasil, 1996; p. 196. Available online: https://repositorio.ufscar.br/handle/ufscar/1950 (accessed on 20 May 2018).
- Cunha, R.C.; Dupas, F.A.; Pons, N.A.D.; Tundisi, J.G. Análise da influência das variáveis ambientais utilizando inferência Fuzzy e zoneamento das vulnerabilidades: Estudo do Caso da Bacia hidrográfica do Ribeirão do Feijão, São Carlos-SP. Geociências 2011, 30, 399–414. [Google Scholar]
- Souza, A.L.; Fonseca, D.G.; Libório, R.A.; Tanaka, M.O. Influence of riparian vegetation and forest structure on the water quality of rural low-order streams in SE Brazil. For. Ecol. Manag. 2013, 298, 12–18. [Google Scholar] [CrossRef]
- Bibby, C.J.; Burgess, N.D.; Hill, D.A.; Mustoe, S.H. Bird Census Techniques, 2nd ed.; Academic Press: London, UK, 2000; ISBN 9780080886923. [Google Scholar]
- Jansen, A. Avian use of restoration plantings along a creek linking rainforest patches on the Atherton Tablelands North Queensland. Restor. Ecol. 2005, 13, 275–283. [Google Scholar] [CrossRef]
- Stirnemann, I.A.; Ikin, K.; Gibbons, P.; Blanchard, W.; Lindenmayer, D.B. Measuring habitat heterogeneity reveals new insights into bird community composition. Oecologia 2015, 177, 733–746. [Google Scholar] [CrossRef] [PubMed]
- Sick, H. Ornitologia Brasileira, 3rd ed.; Nova Fronteira: Rio de Janeiro, Brazil, 2001; ISBN 85-2090-816-0. [Google Scholar]
- Motta-Júnior, J.C. Estrutura trófica e composição das avifaunas de três hábitats terrestres na região central do estado de São Paulo. Ararajuba 1990, 1, 65–71. [Google Scholar]
- Manica, L.T.; Telles, M.; Dias, M.M. Bird richness and composition in a Cerrado fragment in the State of São Paulo. Braz. J. Biol. 2010, 70, 243–254. [Google Scholar] [CrossRef] [PubMed] [Green Version]
- Laliberté, E.; Legendre, P. A distance-based framework for measuring functional diversity from multiple traits. Ecology 2010, 91, 299–305. [Google Scholar] [CrossRef] [PubMed]
- Botta-Dukát, Z. Raos quadratic entropy as a measure of functional diversity based on multiple traits. J. Veg. Sci. 2005, 16, 533–540. [Google Scholar] [CrossRef]
- Ter Braak, C.J.F. Canonical Correspondence Analysis: A new eigenvector technique for multivariate direct gradient analysis. Ecology 1986, 67, 1167–1179. [Google Scholar] [CrossRef]
- R Development Core Team. R: A Language and Environment for Statistical Computing; R Foundation for Statistical Computing: Vienna, Austria, 2017. [Google Scholar]
- Oksanen, J.; Blanchet, F.G.; Friendly, M.; Kindt, R.; Legendre, P.; McGlinn, D.; Minchin, P.R.; O’Hara, R.B.; Simpson, G.L.; Solymos, P.; et al. Vegan: Community Ecology Package, 2010; R package version 2.5–2. Available online: http://cran.r-project.org/web/packages/vegan/ (accessed on 30 June 2018).
- Laliberté, E.; Legendre, P.; Shipley, B.; Laliberté, M.E. FD: Measuring Functional Diversity from Multiple Traits, and Other Tools for Functional Ecology; R Foundation for Statistical Computing: Vienna, Austria, 2014; Available online: http://cran.r-project.org/web/packages/FD/ (accessed on 25 June 2018).
- Agresti, A. Categorical Data Analysis, 2nd ed.; John Wiley & Sons: Hoboken, NJ, USA, 2003; pp. 70–114. ISBN 0471360937. [Google Scholar]
- Lebrija-Trejos, E.; Pérez-García, E.A.; Meave, J.A.; Bongers, F.; Poorter, L. Functional traits and environmental filtering drive community assembly in a speciesrich tropical system. Ecology 2010, 91, 386–398. [Google Scholar] [CrossRef] [PubMed]
- Kanowski, J.; Catterall, C.P.; Wardell-Johnson, G.W.; Proctor, H.; Reis, T. Development of forest structure on cleared rainforest land in eastern Australia under different styles of reforestation. For. Ecol. Manag. 2003, 183, 265–280. [Google Scholar] [CrossRef]
- Vesk, P.A.; Nolan, R.; Thomson, J.R.; Dorrough, J.W.; Mac Nally, R. Time lags in provision of habitat resources through revegetation. Biol. Conserv. 2008, 141, 174–186. [Google Scholar] [CrossRef]
- Garcia, L.C.; Cianciaruso, M.V.; Ribeiro, D.B.; dos Santos, F.A.M.; Rodrigues, R.R. Flower functional trait responses to restoration time. Appl. Veg. Sci. 2015, 18, 402–412. [Google Scholar] [CrossRef]
- Daronco, C.; Melo, A.C.G.; Durigan, G. Ecossistema em restauração versus ecossistema de referência: Estudo de caso da comunidade vegetal de mata ciliar em região de Cerrado, Assis, SP, Brasil. Hoehnea 2013, 40, 485–498. [Google Scholar] [CrossRef]
- César, R.G.; Moreno, V.S.; Coletta, G.D.; Chazdon, R.L.; Ferraz, S.F.; de Almeida, D.R.; Brancalion, PH. Early ecological outcomes of natural regeneration and tree plantations for restoring agricultural landscapes. Ecol. Appl. 2018, 28, 373–384. [Google Scholar] [CrossRef] [PubMed]
- Dunn, P. Breeding dates and reproductive performance. Adv. Ecol. Res. 2004, 35, 69–87. [Google Scholar]
- Ding, Z.; Feeley, K.J.; Wang, Y.; Pakeman, R.J.; Ding, P. Patterns of bird functional diversity on land-bridge island fragments. J. Anim. Ecol. 2013, 82, 781–790. [Google Scholar] [CrossRef] [PubMed]
- Fontúrbel, F.E.; Jiménez, J.E. Does bird species diversity vary among forest types? A local-scale test in Southern Chile. Naturwissenschaften 2014, 101, 855–859. [Google Scholar] [CrossRef] [PubMed]
- Meynard, C.N.; Quinn, J.F. Bird metacommunities in temperate South American forest: Vegetation structure, area, and climate effects. Ecology 2008, 89, 981–990. [Google Scholar] [CrossRef] [PubMed]
Figure 1.
Results of principal component analysis of reference (C1 and C2) and under restoration (R1–R6) sites in relation to forest structure variables.
Figure 1.
Results of principal component analysis of reference (C1 and C2) and under restoration (R1–R6) sites in relation to forest structure variables.

Figure 2.
Relationships between bird assemblage descriptors (A) abundance, (B) species richness, (C) functional dispersion, and (D) Rao’s quadratic entropy and Forest Axis 1 in reference (C1 and C2) and under restoration (R1–R6) sites, with results of significant linear regression models.
Figure 2.
Relationships between bird assemblage descriptors (A) abundance, (B) species richness, (C) functional dispersion, and (D) Rao’s quadratic entropy and Forest Axis 1 in reference (C1 and C2) and under restoration (R1–R6) sites, with results of significant linear regression models.

Figure 3.
Distribution of the relative abundance of combined bird functional traits on reference (C1 and C2) and under restoration (R1–R6) sites in relation to riparian forest structure (Forest Axes 1 and 2) according to canonical correspondence analysis. Symbol colors represent the position of traits of different functional categories: (A) forest dependence, (B) foraging stratum, (C) cavity dependence for nesting, (D) diet.

Figure 4.
Changes in the percent of species within traits of (A) foraging stratum, (B) cavity dependence for nesting, (C) diet, and (D) nest height, in relation to bird forest dependence.
Figure 4.
Changes in the percent of species within traits of (A) foraging stratum, (B) cavity dependence for nesting, (C) diet, and (D) nest height, in relation to bird forest dependence.

Table 1.
Mean ± SD of riparian forest structure variables of reference sites (C1 and C2) and sites under restoration of different ages (R1, R2, R3, R4, R5 and R6).
Table 1.
Mean ± SD of riparian forest structure variables of reference sites (C1 and C2) and sites under restoration of different ages (R1, R2, R3, R4, R5 and R6).
| C1 | C2 | R1 | R2 | R3 | R4 | R5 | R6 | |
|---|---|---|---|---|---|---|---|---|
| Mean tree height (m) | 7.38 ± 0.77 | 7.27 ± 0.82 | 6.08 ± 0.59 | 4.15 ± 0.41 | 3.62 ± 0.67 | 3.84 ± 0.41 | 2.56 ± 0.34 | 2.92 ± 0.22 |
| Maxim. tree height (m) | 16.8 | 18.1 | 13.3 | 5.8 | 8.2 | 9.0 | 5.7 | 4.5 |
| Canopy depth (m) | 2.22 ± 0.30 | 2.44 ± 0.45 | 2.95 ± 0.41 | 2.71 ± 0.37 | 2.20 ± 0.52 | 2.79 ± 0.37 | 1.68 ± 0.31 | 1.67 ± 0.18 |
| Mean dbh (cm) | 9.30 ± 1.19 | 12.70 ± 2.27 | 9.17 ± 1.76 | 9.07 ± 1.51 | 8.19 ± 3.22 | 6.27 ± 0.98 | 3.92 ± 0.83 | 6.28 ± 0.80 |
| Basal area (m²/ha) | 0.45 ± 0.11 | 1.09 ± 0.40 | 0.55 ± 0.23 | 0.41 ± 0.15 | 0.52 ± 0.41 | 0.23 ± 0.08 | 0.09 ± 0.04 | 0.20 ± 0.04 |
| Tree layering | 0.476 | 0.543 | 0.426 | 0.325 | 0.491 | 0.501 | 0.439 | 0.325 |
| Density (ind/ha) | 1700 | 1800 | 1600 | 750 | 500 | 1750 | 950 | 1500 |
| Grass cover (%) | 12.5 | 12.5 | 37.5 | 87.5 | 87.5 | 62.5 | 87.5 | 72.5 |
dbh: diameter at breast height, ind: individuals.
© 2018 by the authors. Licensee MDPI, Basel, Switzerland. This article is an open access article distributed under the terms and conditions of the Creative Commons Attribution (CC BY) license (http://creativecommons.org/licenses/by/4.0/).
Share and Cite
MDPI and ACS Style
Batisteli, A.F.; Tanaka, M.O.; Souza, A.L.T. Bird Functional Traits Respond to Forest Structure in Riparian Areas Undergoing Active Restoration. Diversity 2018, 10, 90. https://doi.org/10.3390/d10030090
AMA Style
Batisteli AF, Tanaka MO, Souza ALT. Bird Functional Traits Respond to Forest Structure in Riparian Areas Undergoing Active Restoration. Diversity. 2018; 10(3):90. https://doi.org/10.3390/d10030090
Chicago/Turabian StyleBatisteli, Augusto F., Marcel O. Tanaka, and Andréa L.T. Souza. 2018. "Bird Functional Traits Respond to Forest Structure in Riparian Areas Undergoing Active Restoration" Diversity 10, no. 3: 90. https://doi.org/10.3390/d10030090
Note that from the first issue of 2016, this journal uses article numbers instead of page numbers. See further details here.