Fluctuation of Information Entropy Measures in Cell Image

The Biophysical Interdisciplinary Schottenstein Center for the Research and Technology of the Cellome, Physics Department, Bar Ilan University, Ramat-Gan 5290002, Israel
*
Author to whom correspondence should be addressed.
Entropy 2017, 19(10), 565; https://doi.org/10.3390/e19100565
Submission received: 31 July 2017
/
Revised: 10 September 2017
/
Accepted: 18 October 2017
/
Published: 23 October 2017
Abstract
:A simple, label-free cytometry technique is introduced. It is based on the analysis of the fluctuation of image Gray Level Information Entropy (GLIE) which is shown to reflect intracellular biophysical properties like generalized entropy. In this study, the analytical relations between cellular thermodynamic generalized entropy and diffusivity and GLIE fluctuation measures are explored for the first time. The standard deviation (SD) of GLIE is shown by experiments, simulation and theoretical analysis to be indifferent to microscope system “noise”. Then, the ability of GLIE fluctuation measures to reflect basic cellular entropy conditions of early death and malignancy is demonstrated in a cell model of human, healthy-donor lymphocytes, malignant Jurkat cells, as well as dead lymphocytes and Jurkat cells. Utilization of GLIE-based fluctuation measures seems to have the advantage of displaying biophysical characterization of the tested cells, like diffusivity and entropy, in a novel, unique, simple and illustrative way.
1. Introduction
Background: This study is an effort to advance our understanding of the thermodynamics of information processing in general, specifically focusing on living systems. Emerging fields in biological research, such as system biology, analyze cells and life through a holistic approach. According to this view, living forms and processes are considered too complex to be completely defined and, hence, are characterized as a whole, in order to gain significant knowledge on that living system [1]. This perspective of the whole system is also at the base of statistical mechanics that enables characterization of thermodynamic macroscopic quantities in complex physical systems. One of the most indicative macroscopic whole-system thermodynamic measures is entropy, due to its consistent tendency to increase while the system is subjected to spontaneous processes. When applying the entropy measure to a living system, it could be analyzed at multiple levels, according to the field of perspective and the measurement system characteristics: genomic, transcriptomic, proteomic, network entropy, structural entropy, textural entropy, information entropy, thermodynamic entropy, etc. [2,3,4,5]. Entropy patterns of mRNA and protein expression could characterize cellular differentiation state [6], while network entropy measures could follow tumor progression and anticancer drug responses [7]. Entropy of population analysis reveals highly ordered cellular patterns that negatively relate to the degree of cell autonomy [8]. Flow cytometry (FCM) large data set distributions of results in cell populations of leukemia patients and healthy donors were utilized for identification of malignancy by analyzing the differences in multidimensional distributions of FCM results as well as the differences of related entropies [9]. The thermodynamics of biological data storage, transmission and interpretation is subject to intense discussion [10]. These entropy formulations are based on determination of probabilities of essential biological factors such as mRNA variation, gene interactions, DNA coding, FCM results etc., while the expected relations between these forms of cellular entropy are not yet fully defined. From a complementary perspective, we strive in this work to explore the probabilities of intracellular energetic levels and the related thermodynamic generalized entropy state. Entropy production rate, which may challenge living-cell homeostasis, is typically elevated in malignant cells [11].
Textural Information Entropy: When analyzing the fine microscopic texture of a medium (and not focusing on its structural macroscopic morphology), several entropy functions that reflect the micro scale image and medium complexity could be utilized [12]. Insight into micro scale complexity and related entropy due to the narrow perspective will probably better reflect the medium’s basic thermodynamic entropy, while a wider perspective will reflect a combination of entropies: thermodynamic, structural/morphologic and multi-levels of information entropies.
Application of these textural entropy investigations to evaluate the homogeneity and randomness of gray values within the cell image are relatively easy to perform and could rely on digital image analysis of label-free or marked live or fixated cells [13,14,15,16].
In the field of digital image analysis, Gonzalez and Woods [17] propose the utilization of information entropy formulation that measures the average information in the pixels of an inspected image field in bit units: , where Pi stands for the frequency of pixels whose intensity values are within the range (,) and is an intensity difference that depends on the resolution of the camera or the possible number of gray values in the dynamic range of the pixels. Their formulation could be used to investigate the complexity or textural entropy of various mediums, including living ones. Changing the microscope or camera settings (for example increasing camera’s possible number of gray values, exposure time or microscope light intensity) is expected to influence values so that maintaining fixed microscope and camera settings is essential for comparing different media.
Wiedemann et al. [18] performed label-free flow cytometry utilizing Gonzalez’s E values of 25 pixel measurement units from a cell image acquired during flow. This was compared to the results of viability tests performed on the same cells during flow as well. Though sensitivity and specificity of E values are not presented in their work, they indeed show that E values of dead cells are higher than those of living cells, thus enabling the presentation of two distinct cell populations.
Fluctuations: Nonetheless, Wiedemann and others [13,14,15,16,18] explored the steady state aspect of information or textural entropy, overlooking the fluctuating nature of these measures.
Motivated by the fact that living cells are not in a state of thermodynamic equilibrium, but rather in a metastable state [4,19], our studies [20,21] focus on the examination of the fluctuations of the measure Gray Level Information Entropy (GLIE) and its informative value.
For measurement of cellular GLIE fluctuation, we used a simple experimental system consisting of a user-friendly combination of common bright field microscopy and a unique imaging dish in which cells are individually held untethered, each within a picoliter volume optical chamber in an array, allowing repeatable spatiotemporal observation before, during and after bio-manipulation in situ, at single-cell resolution, while in a population.
GLIE fluctuation parameters, based on standard deviation (SD) of temporal GLIE value distributions or autocorrelation of GLIE temporal changes, could be utilized to successfully distinguish dead cells from live ones in multiple cell lines with sensitivity and specificity values between 92% and 100% [20]. GLIE fluctuation parameters, based on discrete Fourier transform (DFT) analysis of the temporal GLIE changes enable evaluation of multiple cellular physiologic stimulations and mitochondrial dysfunction conditions [21]. According to their power spectrum analysis, cellular GLIE fluctuations could be divided into two distinct types: (a) high power low frequency fluctuations (<0.1 Hz), attributed to periodic physiologic activity, i.e., intracellular translocations of proteins, vesicles and organelles, and (b) low power high frequency (>0.5 Hz) random fluctuations, attributed to dissipative random mechanical fluctuations of intracellular content [21].
Low frequency periodic events are governed mainly by the biological processes that take place in the cell and particularly in the examined intracellular areas of the cell images. Intracellular oscillations of signaling molecules [22] or pivotal intracellular mediators like Protein Kinase C and G translocations have been shown to take place in time periods of seconds [23,24,25]. On the other hand, the high frequency random GLIE fluctuations were found, in previous work, to reflect physical properties of the intracellular medium, like mobility and diffusivity. In the current work, we present our assumption regarding the relation between GLIE fluctuations and thermodynamic generalized entropy [26] of the observed intracellular system.
In addition, the physical and the physiological aspect of the proposed measures are discussed and examined experimentally, analytically and by computer simulation.
The SD of the information entropy function, when operating on image gray value fluctuation, was found to be indifferent to the microscope system “noise”. This was shown by experiments, simulation and theoretical examination.
Finally, we will demonstrate the applicability of GLIE fluctuation measures for discriminating between live, dead and malignant cells of the same kind, yet are known to have different thermodynamic states. In this regard, the morphology change common to all processes of cellular death is the increase in cellular inhomogeneity due to intracellular content condensation, shrinkage and defragmentation which lasts until the cell fragments [18,27]. The increase in inhomogeneity due to shrinkage and condensation of intracellular content which involves lower mobility [28] is expected to lower the possible number of the cellular system microstates and accordingly, the generalized entropy at that stage of cellular death.
Malignant cellular conditions are characterized by increased disorganization at multiple cellular levels from the genome to transcriptome and proteome with increased “noise” (fluctuations of all cellular measures discussed above) that accompanies the high mechanical dissipation, high diffusivity and the increase in cellular system thermodynamic generalized entropy [29,30,31].
Successful monitoring of cellular entropic conditions by a simple label-free cytometry based on analysis of image information entropy fluctuation could therefore be beneficial for investigation of pathophysiologic conditions such as malignant transformation.
2. Materials and Methods
2.1. Materials
Complete Medium (medium): RPMI-1640, DMEM medium, heat-inactivated fetal calf serum (FCS), penicillin, streptomycin, glutamine, sodium pyruvate and HEPES and Trypsin-EDTA solution B were obtained from Biological Industries (Kibbutz Beit Haemek, Israel). Propidium Iodide (PI) was obtained from Sigma-Aldrich (St. Louis, MO, USA).
2.1.1. Cells
Human leukemic Jurkat cells (ECACC, UK) were maintained in RPMI-1640 medium supplemented with 10% FCS, 100 U/mL penicillin, 100 μg/mL streptomycin, 2% glutamine, 2% sodium pyruvate and 2% HEPES. Cells were maintained in completely humidified air with 5% CO2 at 37 °C. Before use, exponentially growing cells were obtained, washed and suspended in PBS at a concentration of 1.5–2.0 × 10⁶ cells/mL.
Peripheral Blood Lymphocytes (PBL) were isolated from the heparinized blood (10 mL) of healthy subjects by the cell density Ficoll Paque gradient as previously described [32]. Following separation, cells were suspended in complete RPMI medium at 2 × 10⁶ cells/mL. In all instances, more than 70% of the cells were defined as T-lymphocytes (CD3 positive). Viability, determined by PI staining, was always higher than 90%.
2.1.2. Petri Dish-Based LCA (Live Cell Array) and Related Operations
A homemade imaging dish was created by embedding a hexagonal honeycomb array of picoliter wells (PWs) (20 μm diameter and 10 μm depth) on the 175 μm glass bottom of the Imaging Dish CG (175 ± 15 μm thickness, 18 mm diameter) (zell-kontakt GmbH, Nörten-Hardenberg, Germany) [33]. For cell loading, 40 µL of cell suspension (2.5 × 10⁶ cells/mL) in PBS or HEPES buffer, were loaded on top of the array and cells were allowed to settle by gravity for 5–10 min. Then, 500 µL of buffer was added gently to the medium exchange region around the array. The imaging dish was mounted on the microscope stage and measured.
2.1.3. Induction of Cell Death and PI Staining
Cell death was induced by serum deprivation. Cells were incubated for 72 h in incomplete RPMI-1640 (without FCS), then washed, suspended in HEPES buffer (0.1 M HEPES, pH 7.4; 1.4 M NaCl; 25 mM CaCl2) and maintained for 12 h, then washed again and loaded on the array.
Cell viability and plasma membrane integrity were evaluated by staining with PI, which was added to the cells at a final concentration of 2.5 µg/mL within the PW array and the cells were then incubated for 10 min in the dark at room temperature. Excitation filter was 470–490 nm, dichroic mirror 505 nm long pass and emission filter 510–530 nm.
2.2. Measurement System
2.2.1. Microscope
Images were acquired using a motorized Olympus inverted IX81 microscope (Tokyo, Japan) with halogen 12 V/100 W lamp light source. The microscope is equipped with a sub-micron Marzhauser-Wetzlar motorized stage type SCAN-IM, with an Lstep controller; (Wetzlar-Steindorf, Germany) and a filter wheel, including fluorescence cube (excitation filters, dichroic mirrors and emission filters, respectively, all obtained from Chroma Technology Corporation (Brattleboro, VT, USA)). A × 60 NA = 0.70 objective was used.
2.2.2. Image/Data Acquisition
A 12-bit cooled, highly sensitive ORCA II C4742-98 camera (Hamamatsu, Japan) was used for image and data acquisition. Image acquisition time was 1 ms, in 16-bit TIF format, each having 1344 × 1024 pixels, and a physical dimension of 147.69 × 112.53 µm at ×60 magnification on the microscope working plane. Standard illumination conditions of the samples were determined so that average image gray level was close to 1000. Illumination of the sample was synchronized with acquisition time using a controllable electronic shutter. Each image was acquired 200 times successively at 0.5 s intervals.
2.2.3. Fluctuation Based Measures
Acquired stacks of 200 16-bit TIF images were used for calculation of Gray Level Information Entropy (GLIE), using Matlab R2013a software (MathWorks Inc., Natick, MA, USA) and 12-bit images underwent simple conversion of binning 6 using Matlab software (12-bit image with 4096 possible gray values was converted to 682 possible gray value image by reducing six successive gray values to one new gray value). GLIE was calculated utilizing the following relation:
where stands for the occurrence of specific gray level value i, and N is the number of different gray values, both within the inspected field.
In this study the spatiotemporal manner of GLIE is of interest. To that end, images of the cells distributed over the PW matrix were repeatedly acquired 200 times at 0.5 s intervals and indexed by their serial time point (1 to 200), all together yielding the temporal aspect of GLIE. A region of interest (ROI) consisting of 50 × 50 pixels at the center of each cell was determined, Next, the spatial aspect of GLIE within the ROI was examined by dividing the 50 × 50 pixels of a ROI into 100 subgroups, each comprising of 5 × 5 pixels, from which the 25 pixel-based spatial GLIE (GLIE25) was calculated for each of the 200 time points. Hence, for each time point, a GLIE25 map was compiled from 100 GLIE25 values, reflecting the spatial distribution aspect of GLIE within a ROI.
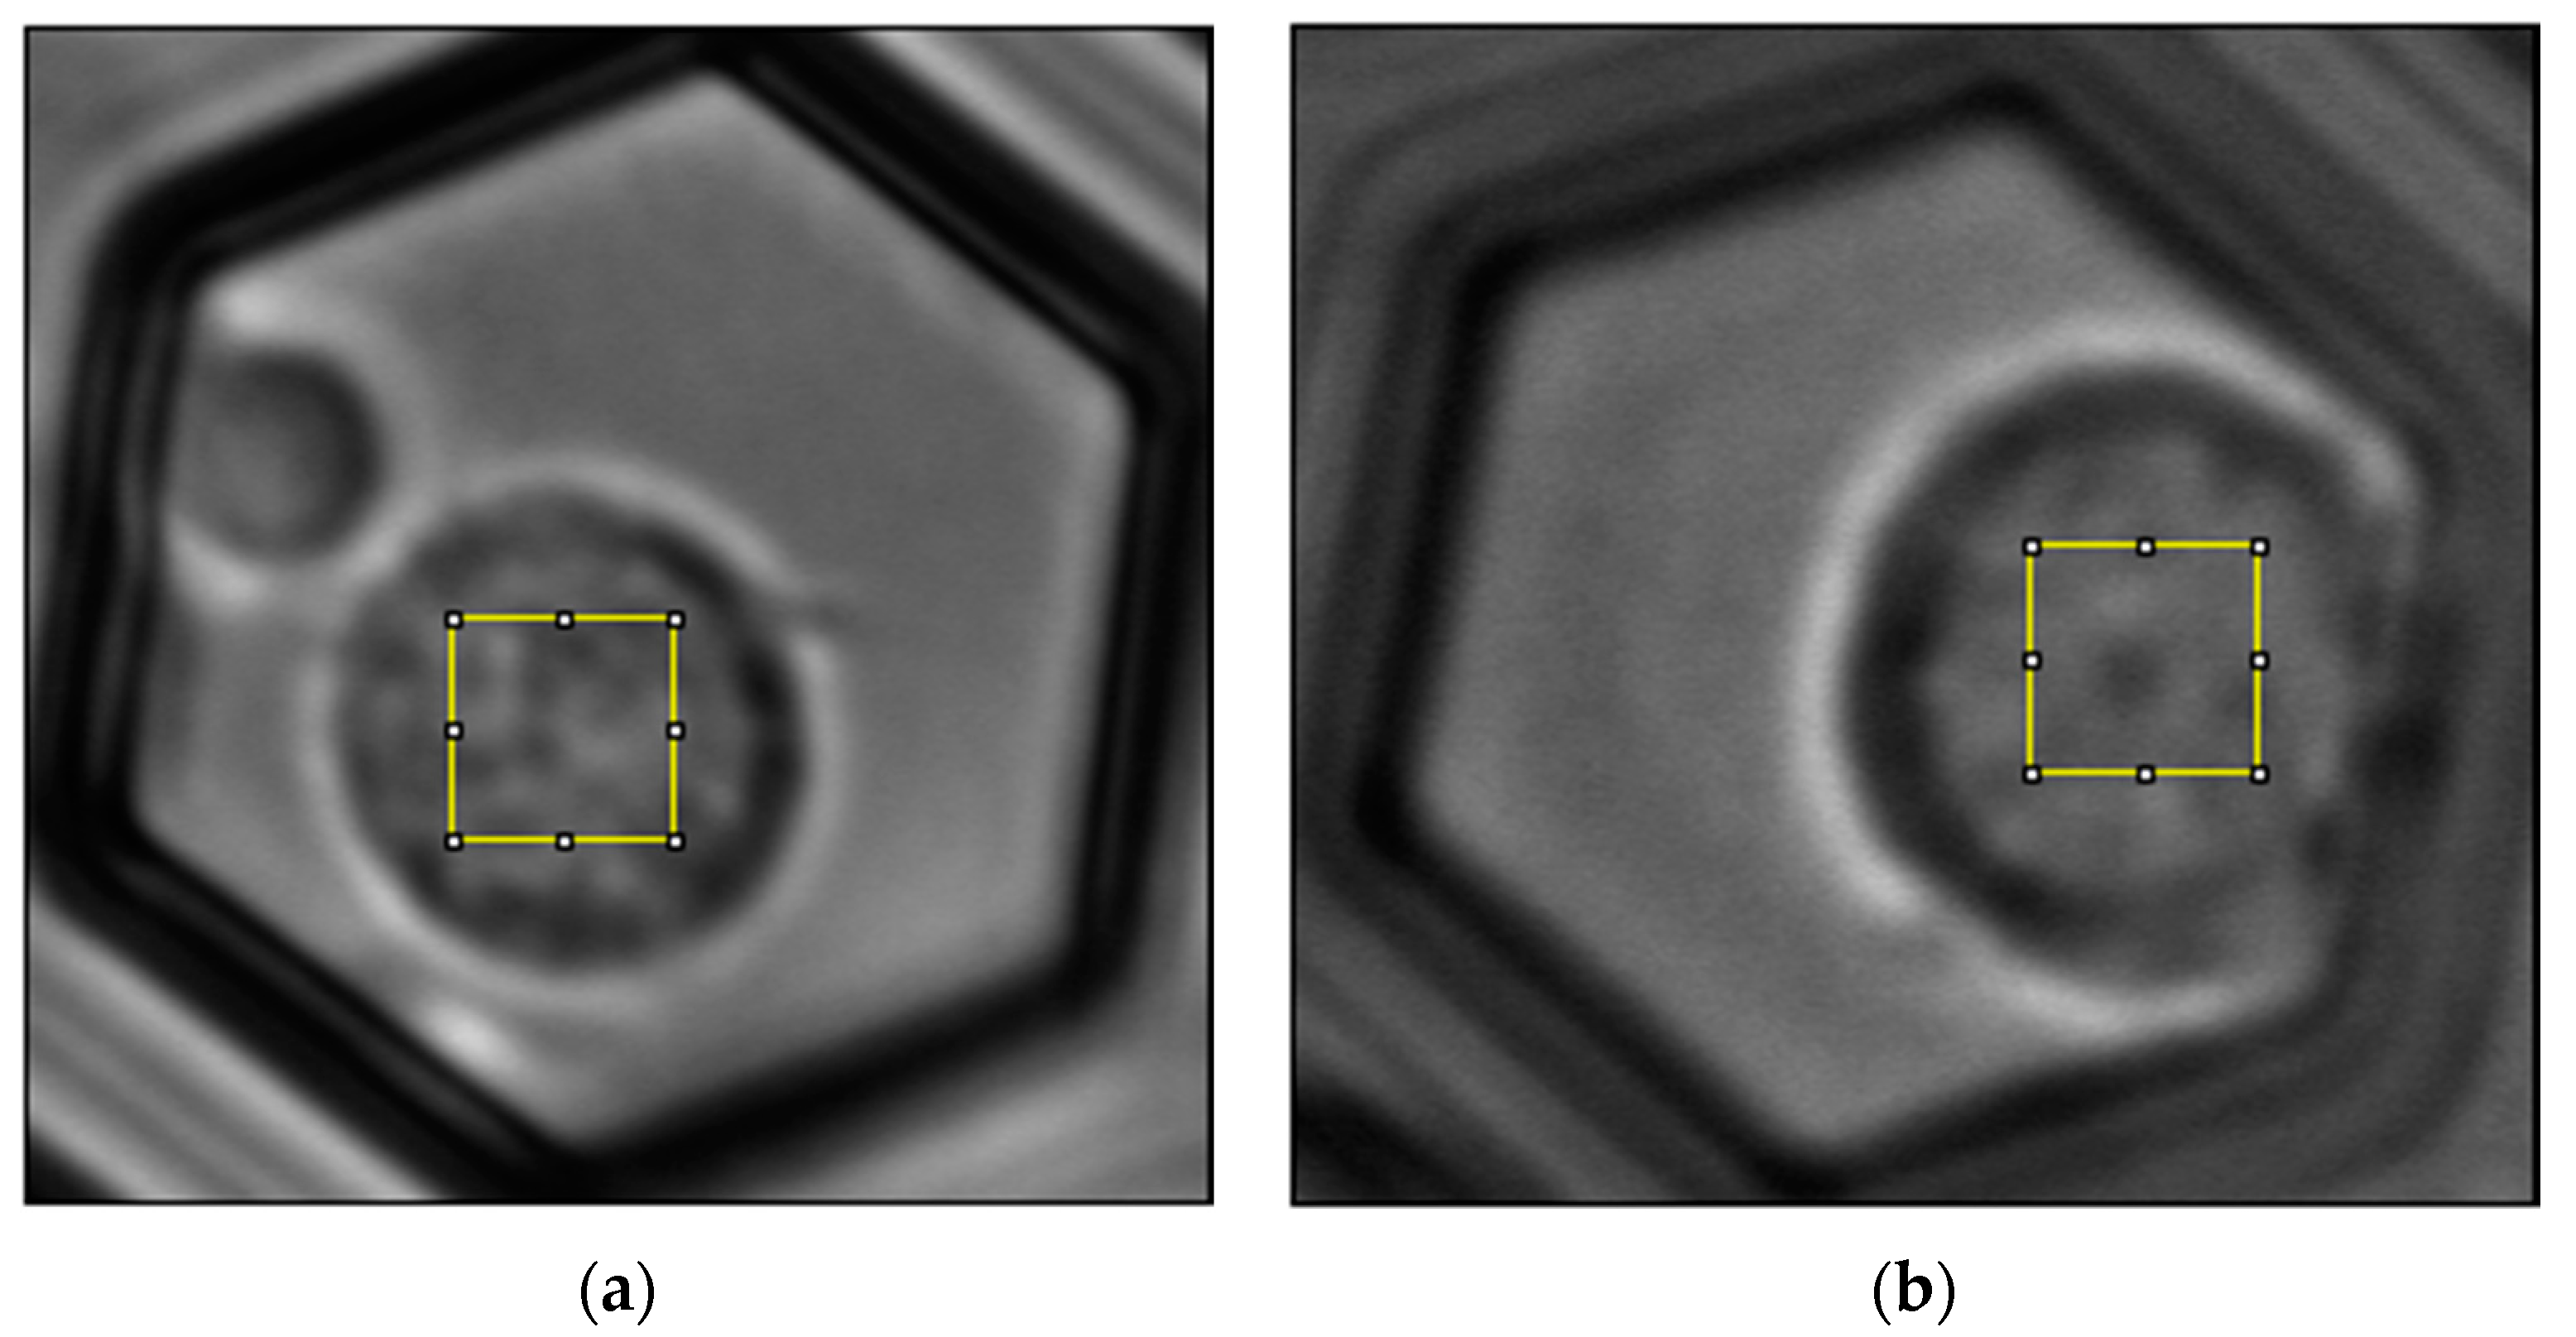
Cells which move within their PWs during data acquisition were excluded, though change in cellular volume of non-moving cells during this time period was possible. A typical normal lymphocyte and a typical Jurkat cell in the PW matrix are presented in Figure 1.
From this spatiotemporal data, the following measures were calculated:
Time-space Averaged GLIE (AGLIE): A two-step averaging (time and space) of GLIE25. First, each GLIE25 was averaged over the 200 time points; yielding 100 aGLIE25 values of time-based averaged GLIE25. Then, the average of these 100 values was calculated as well, all together yielding the AGLIE value of a ROI.
The power spectrum of GLIE25 was calculated by applying DFT analysis on the 200 time-dependent GLIE25 discrete values, (using Matlab R2013a software, MathWorks Inc., Natick, MA, USA), from which the measure HFAP was calculated as follows:
High Frequency Average Power spectrum amplitude (HFAP): GLIE fluctuation measure that was determined by calculating the average DFT power amplitudes of the frequency range 0.5–1 Hz, (dictated by previous results [20,21]) of 200 time serial GLIE25 values (HFAP25), yielding 100 values of HFAP25. Then, the average of these 100 HFAP25 values was defined as the HFAP value of a ROI.
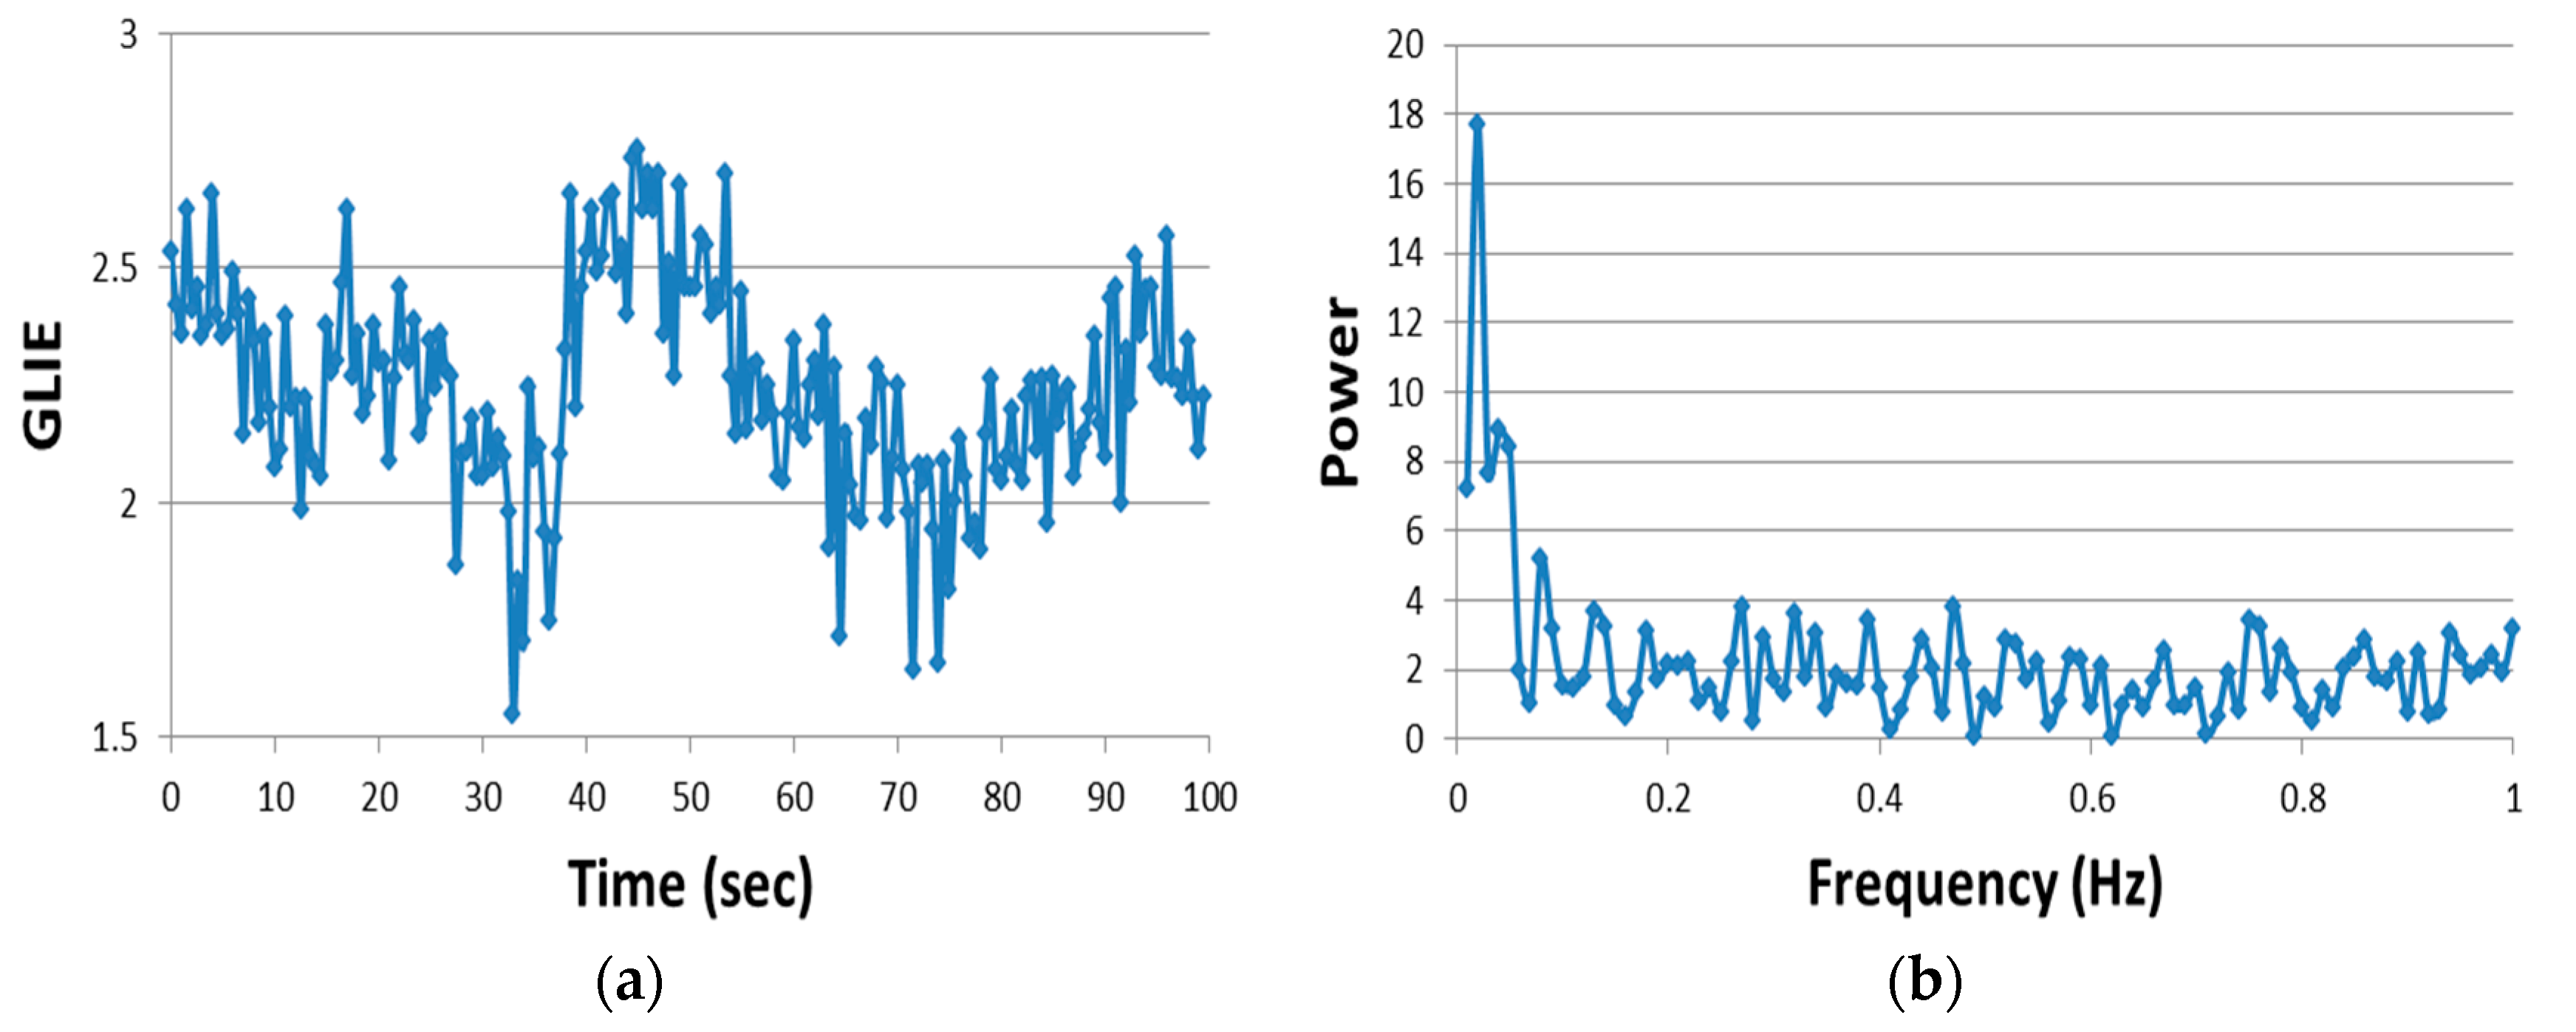
An example of the time dependency of GLIE25 and the corresponding power spectrum is depicted in Figure 2.
2.3. Data Analysis and Statistics
The acquired data within ROIs was exported to Excel spreadsheets (Microsoft office professional plus 2010, Microsoft Inc., Redmond, WA, USA) for graph and table presentation and statistical analysis with Real Statistic Resource pack. Significance of differences between groups was calculated using Anova single factor function or t-test for paired two samples, with statistical significance set at p < 0.05.
3. Results and Discussion
3.1. GLIE Fluctuation and Thermodynamic Entropy—A Theoretical Aspect
For exploration of a possible theoretical relation between cellular image GLIE fluctuation and cellular thermodynamic generalized entropy state, we chose the simple case of a single intracellular vesicle or organelle and analyzed its random motion in one dimension. The intracellular medium is considered a non-equilibrium steady state viscoelastic medium. Incoherent fraction of motor protein activity on the cytoskeleton create active random forces that cause ”diffusive-like” motion of the cytoskeleton and associated membranous structures like vesicles and organelles [31]. These active (ATP-dependent) random mechanical fluctuations dominate the particle random translocation fluctuations which are reflected by our measurement system (of GLIE temporal fluctuation) during a 1–2 s timescale of rates between 0.5–1 Hz which was chosen based on previous works [31,34,35]. In this timescale, the contribution of thermic fluctuations to the intracellular and GLIE fluctuations is minor [31,36]. These active random mechanical fluctuations of the viscoelastic intracellular cytoskeleton and related content, as a consequence of dissipative mechanical-energetic processes, resemble thermal fluctuations in a typical viscous medium. For instance, the measured Mean Square Displacement (MSD) of an intracellular vesicle and the corresponding time lags have a clear linear relationship which obeys the relationship [31,36], (though this diffusion is not thermally driven), where n is the number of dimensions, D is the diffusion coefficient (also called diffusivity), t is the time lag and ∆x is the translocation.
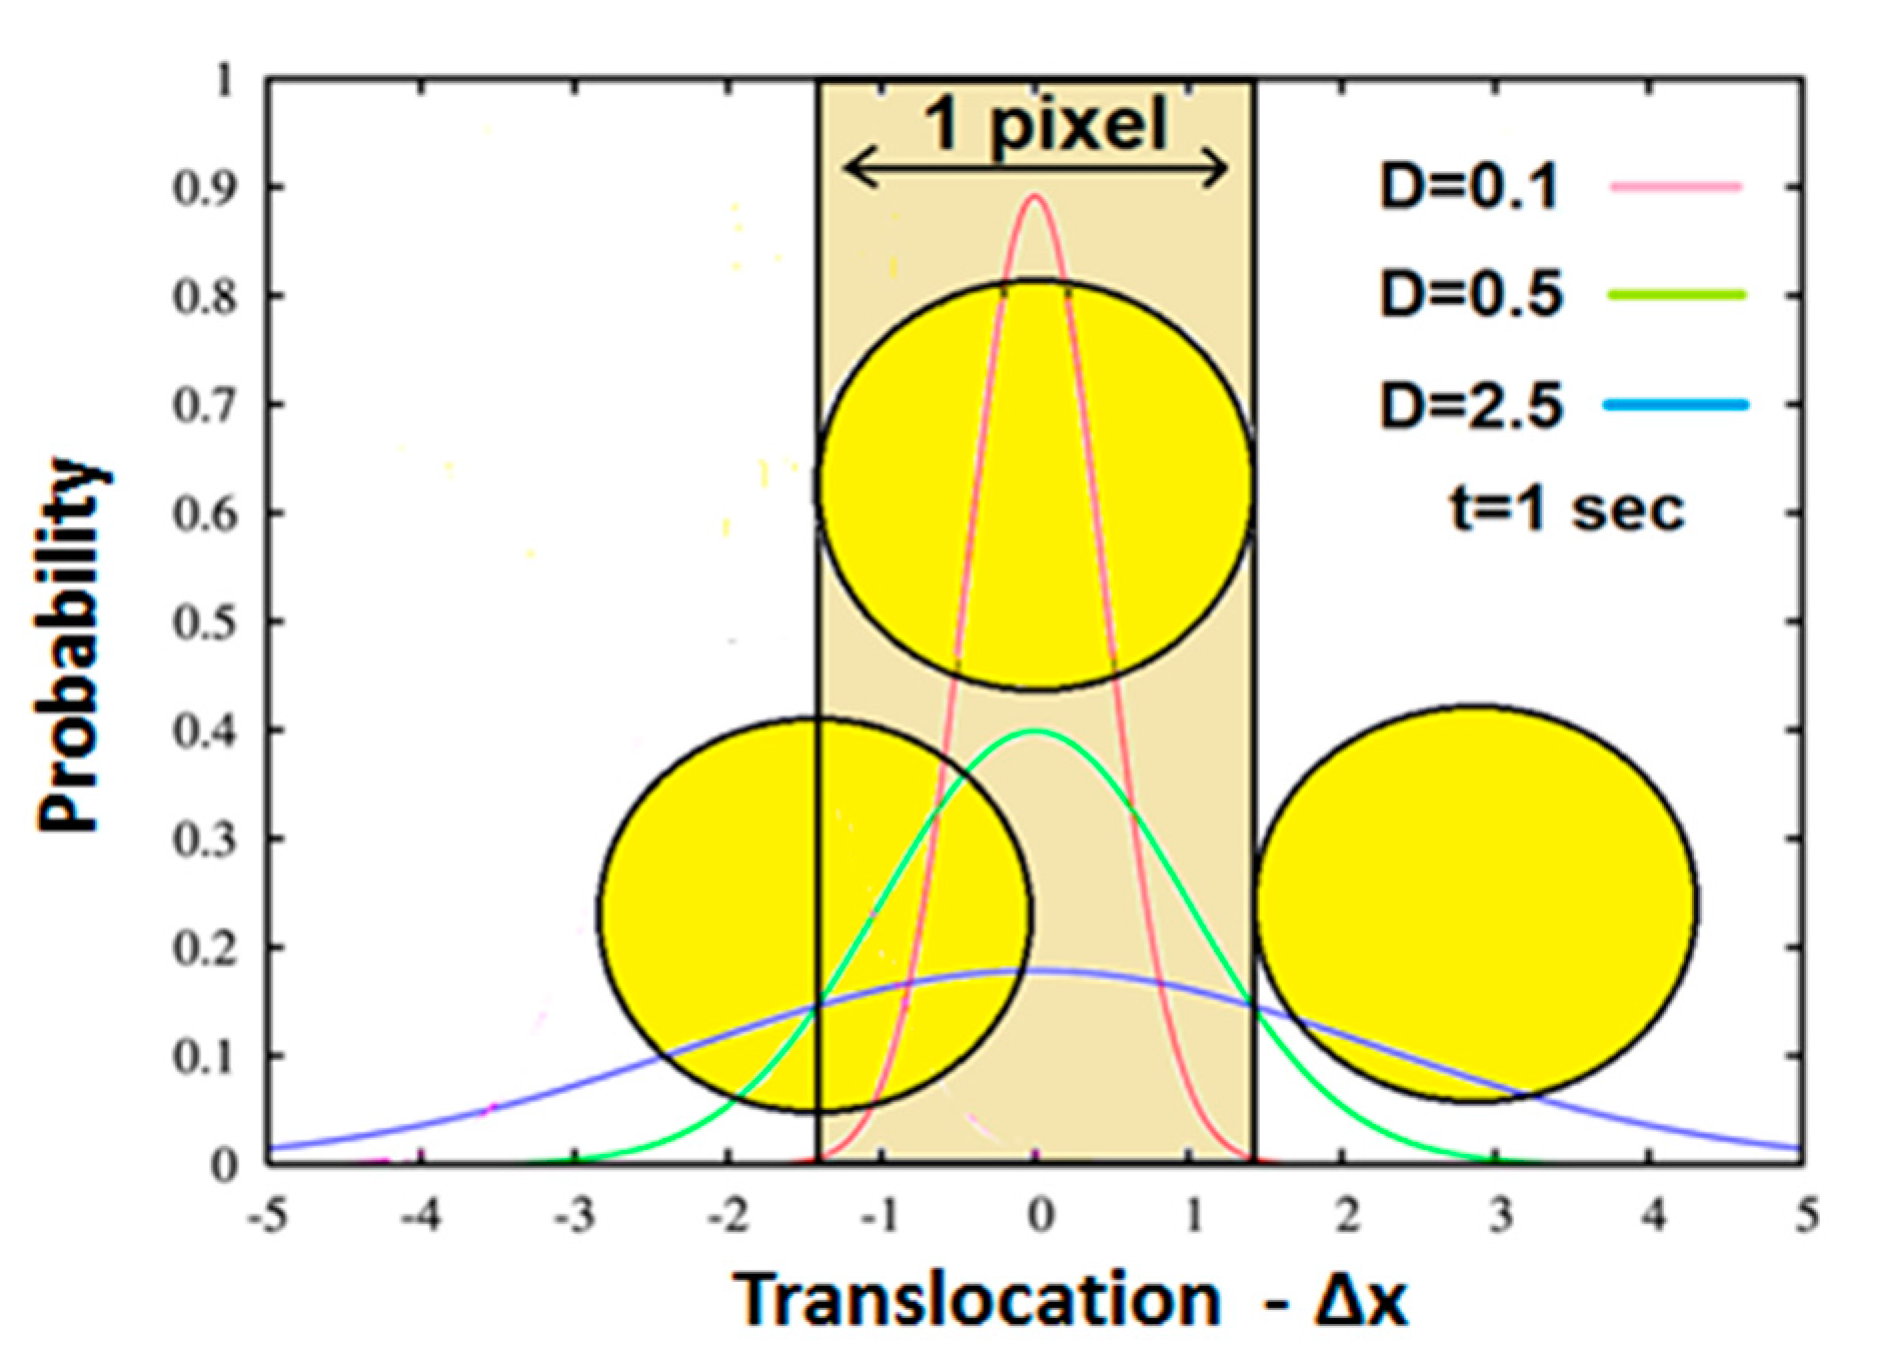
The practical meaning of the above is that the Probability Distribution Function (PDF) of translocations of the diffused particle obeys normal distribution, which has a variance of Figure 3 further illustrates this explanation. It depicts a microscopic partially transparent intracellular element such as an intracellular organelle or vesicle (yellow circle) located between a light source and a single light detector (pixel). Based on the above section, this element conducts “thermic-like” diffusion, upon which the distribution of its translocations around the origin (0,0) should obey one-dimensional Gaussian distribution. Possible distributions which may have different D (diffusivity) values are depicted in the figure by different colors (see inset). Now, for the sake of simplicity, let’s assume an element with the same size of the pixel via which it is detected. Hence, due to its partial transparency, the amount of light detected by the pixel will depend on the position of the element in relation to the detecting area. Three representative situations are illustrated in Figure 3. In the first, the element maximally prevents light from reaching the pixel (center) i.e., yielding the lowest detected gray value. In the second, the element is pushed/diffused to the right, where it doesn’t cover the pixel at all, a case where maximum light reaches the detector, yielding maximum gray value. In the third, the result of the element diffusion to the left, where it only partially covers the pixel detecting area, yields intermediate gray value. Obviously, the outcome of the pixel gray values and their SD must follow the behavior of the random time-dependent translocation of the element diffusing above the pixel.
Now, considering that intracellular mediums are viscoelastic mediums with a more dominant elastic component [31,36] and low Reynolds number flow [37], this situation is likely to propose that said intracellular element experiences potential elastic forces rather than inertia. In other words, changes in energy should be attributed more to potential than kinetic energy. Thus, in that medium with negligible inertia, one may expect to reflect the entire energy changes of the observed element [38]. Consequently, for any practical use, the distribution of the total energy of the particle will reflect the distribution of its potential energy.
In conclusion, the element translocations are in good approximation correlated to the total energy level changes so that a particle PDF of translocations approximates the particle PDF of energy levels.
Accordingly, the energy level probabilities must be Gaussian distributed as well. On the other hand, the entropy of a given Gaussian is (Wolfram and Mathworld):
So, in such case where a Gaussian describes “thermic-like” diffusion process as in our case: Inserting this expression into Equation (2) yields:
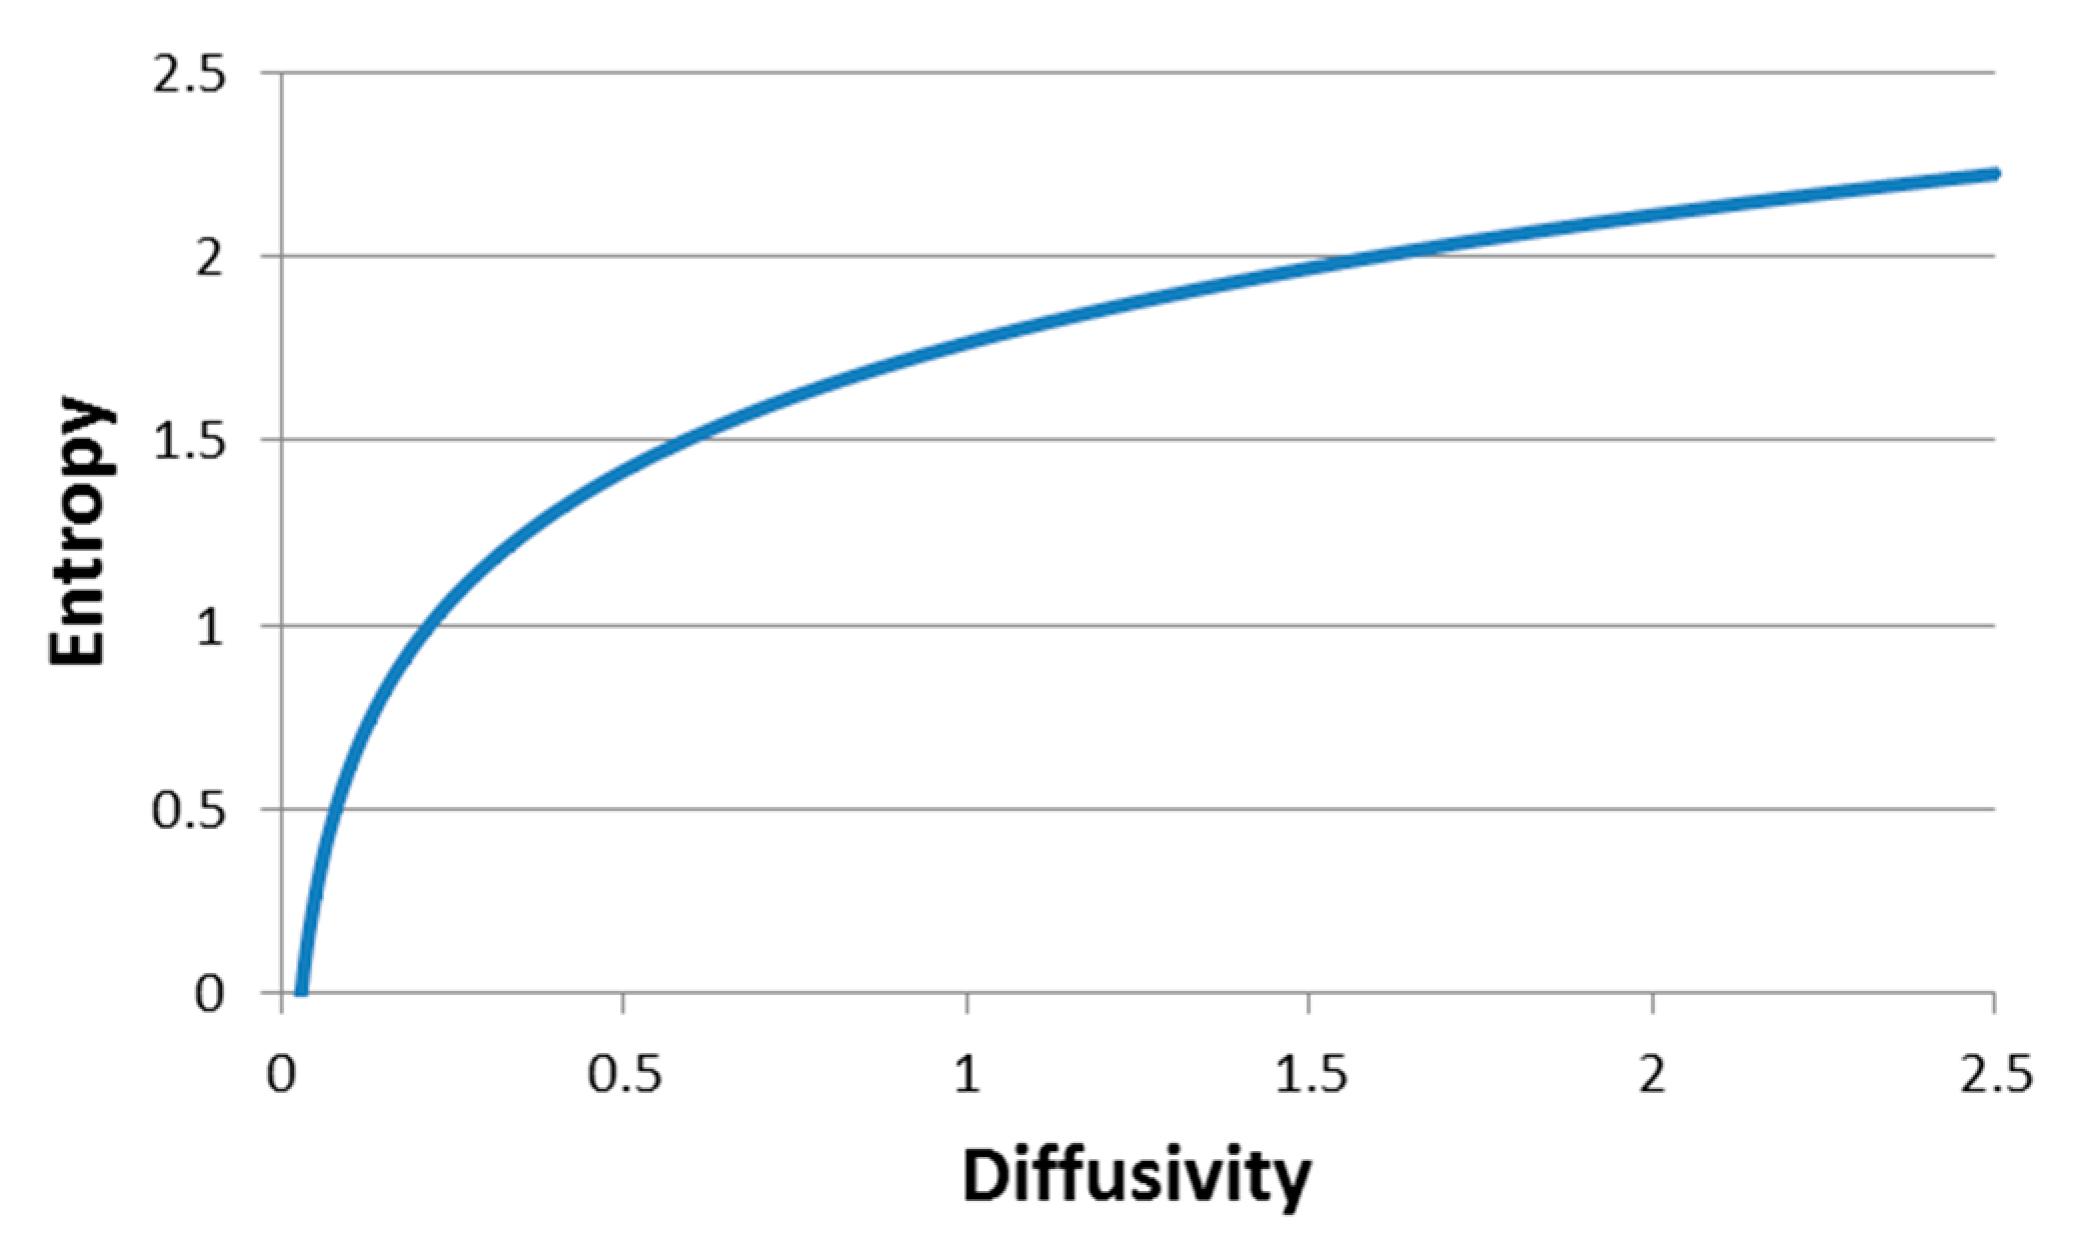
which explores the relation between particle thermodynamic generalized entropy and both the particle diffusivity in the hosting media and the time lag. Figure 4 presents schematically, the dependency of the element-environment entropy on the element diffusivity. Calculations were made for time lags of 1 s, in accordance with the measurement timescale used in this study.
In summary:
- Intracellular particle random motion and diffusivity in a time scale of 1–2 s is mostly not a result of thermal agitation but of random active mechanical fluctuations of the cytoskeleton and related intracellular content while in a thermodynamically non-equilibrium viscoelastic medium.
- The resulting diffusion might be characterized as “thermic-like”, with an approximately linear correlation between the square of translocations and time lags.
- Therefore, normal distribution describes the PDF of these intracellular particle translocations and the related energy levels as well.
- The above normal distribution PDF of total energy or translocations represents the thermodynamic generalized entropy of this particle system and hence correlates between diffusivity and thermodynamic generalized entropy (Equation (3)).
In another of our studies (to be published) we showed that diffusivity negatively correlates to intracellular GLIE25 values. A short explanation of this negative correlation is given below. Having said that, it implies that an increase of the intracellular medium diffusivity will be correlated to a decrease in the 5 × 5 pixel measurement unit gray value heterogeneity and GLIE25 values, i.e., more homogeneity of gray values in the measurement unit results in lower GLIE25 values.
The intracellular medium is very heterogenic and cannot be considered a simple random solution composed of its elements [39].
Intracellular heterogenic spatial distribution of macromolecules in various levels of macro and micro compartments has a crucial role in cellular organization, cellular metabolism and multi-enzyme complex functions [39]. An important mechanism for this spatial heterogeneity is the association of the macromolecules with the actin cytoskeleton network [39,40].
An increase in active random dissipative fluctuations of cytoskeleton and associated intracellular content relates to high diffusivity (in this time scale) [31], satisfactorily justifying the assumption that said fluctuations will probably lead to reduction of intracellular compartmentation of cytoskeletal-associated macromolecules. This, in turn, will lead to a more homogeneous intracellular media, and will result in a decrease of the related gray value heterogeneity and consequent GLIE values as well. According to this line of thought, the increase of dissipative energy and random fluctuations results in elevation of thermodynamic entropy which in turn augments the homogeneity of intracellular content and related image gray values. The latter will be reflected by lower image pixel informational entropy, i.e., by low GLIE values.
In that respect, HFAP and AGLIE values are negatively correlated as well. The source for this is fundamental, i.e., due to the logarithmic nature of GLIE and the fact that HFAP represents GLIE fluctuations.
The generality of this behavior, as well as the slopes of AGLIE-HFAP negative correlations being positively related to pixel gray value SD, were demonstrated by simulation as well (data not shown). As was discussed previously in this section, diffusivity and the SD of image pixel gray values are expected to be positively correlated (Figure 3).
Figure 5 summarizes the proposed correlation between intracellular thermodynamic generalized entropy and GLIE fluctuation parameters within said time scale of about 1 s. As can be seen, high diffusivity correlates to low AGLIE values and to high SD of image gray values. Low AGLIE values contribute to high HFAP values due to the negative AGLIE-HFAP correlation. Finally, high SD of image gray values elevates the slope of the AGLIE-HFAP correlation, which further contributes to higher HFAP values in cellular conditions of high diffusivity.
In summary, theoretical analysis indicates that the thermodynamic generalized entropy of Intracellular particles is closely related to their diffusivity. The latter is (a) negatively correlated to AGLIE values probably due to decreased compartmentation and increased intracellular medium homogeneity and (b) positively correlated to the SD of image pixel gray values and HFAP values (the positive correlation between diffusivity and HFAP values is mainly due to the logarithm-based negative correlation between AGLIE and HFAP values).
3.2. Noise Due to Measurement System Fluctuations
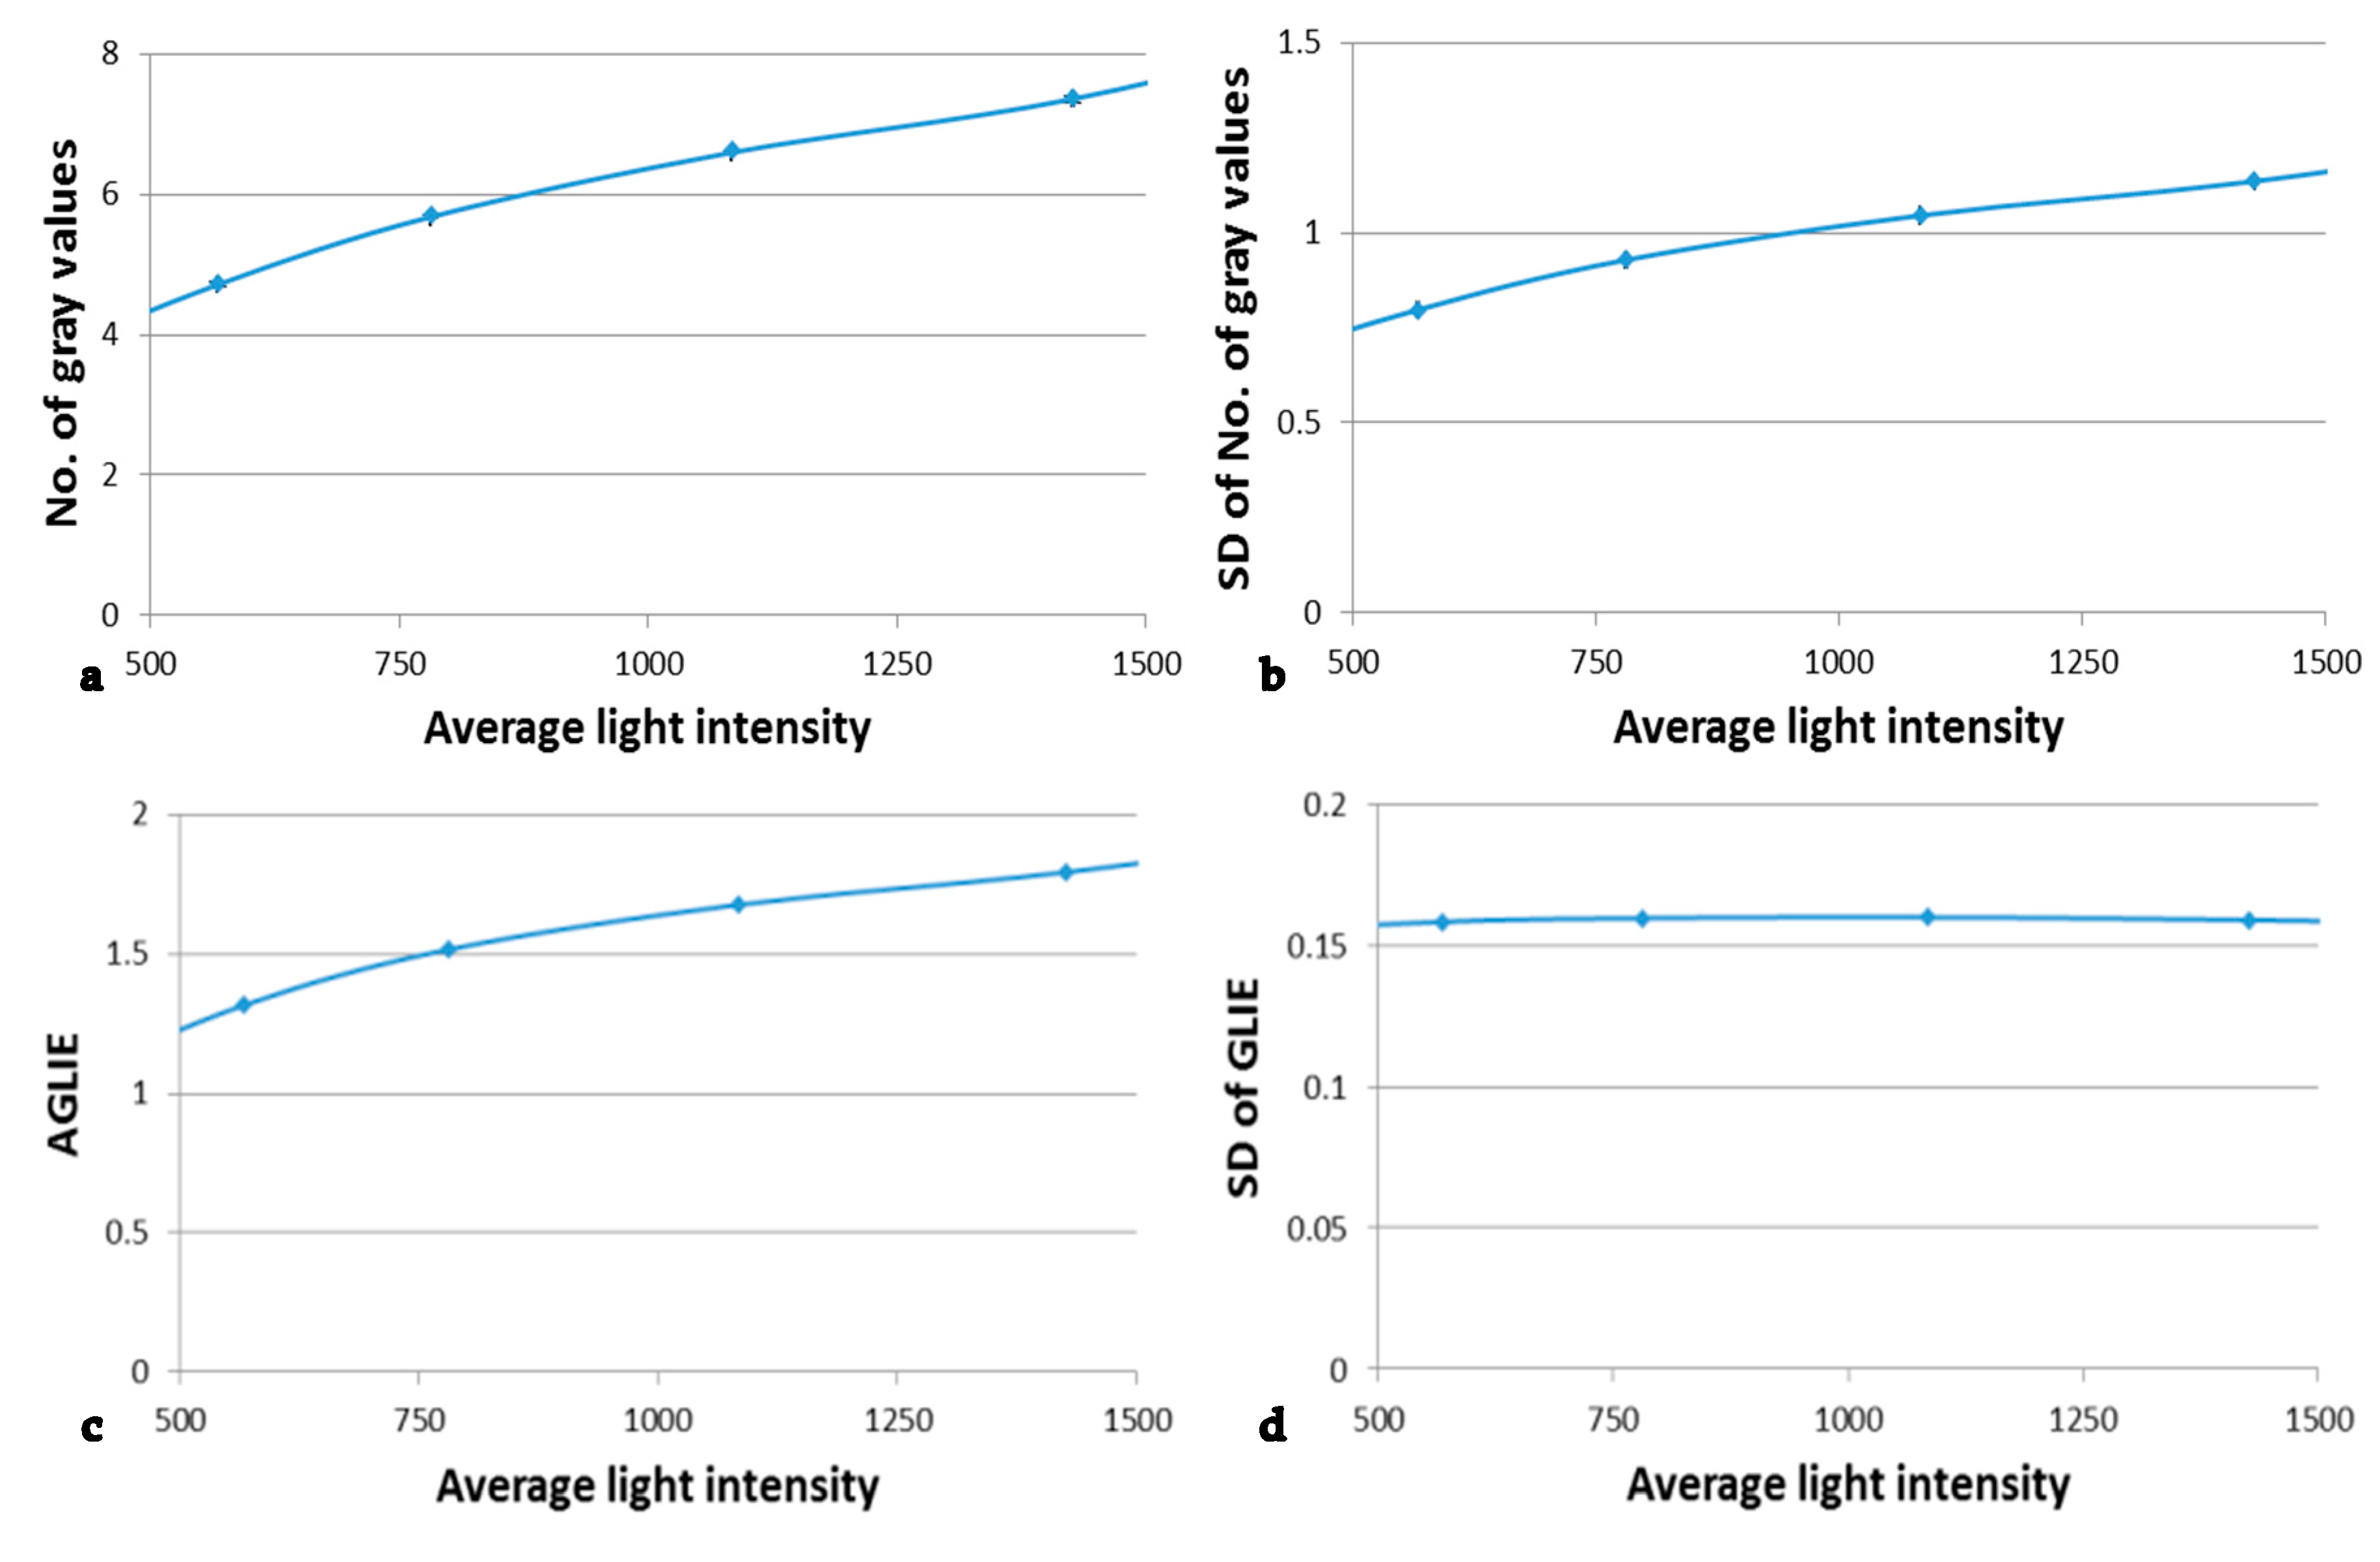
In order to evaluate the influence of the measurement system fluctuation upon those which originated from the investigated sample, microscope gray level readings were measured with different light intensities in the absence of a sample. Identical measurement procedures and conditions were followed, as those used for sample measurement. Six measurement areas in each stack of images were evaluated at each of the light intensities. Each measurement area was divided into 10 × 10 calculation units, each of 5 × 5 pixels, for which the following were calculated: average number of gray values, its SD in a serial of 200 images (0.5 s intervals), the average GLIE and its SD. Characteristic results are shown in Figure 6.
The results presented in Figure 6b indicate that regarding the number of gray values, the higher the light intensity N, the larger the corresponding fluctuation (SD), i.e., the photon noise . On the other hand, for large N, though the photon distribution per pixel is Poisson distribution, it tends to normal distribution. That is to say, the [41,42]. Furthermore, since (Equation (2)), the higher the N, the higher GLIE is, as well. It should be emphasized that due to the ergodic principle [43], the temporal (measured at single pixel) and the spatial intensity (measured at a field of 25 pixels) SDs can be considered to be equal, for any practical use.
According to Figure 6d, the fluctuations of the measure GLIE seem to be indifferent to the intensity. This is an important result that is further analytically investigated in the Supplementary Materials.
As for the practical aspect of GLIE fluctuation being indifferent to light intensity, it is believed to be a tremendous advantage when making a comparative evaluation between the inherent GLIE fluctuations of several media, each having a different transmitted light intensity.
3.3. The Immediate Applicative Aspect of GLIE Fluctuation-Based Measures
In this section, we present the results obtained in challenging GLIE fluctuation measured in three cardinal cellular states, each considered to have different thermodynamic generalized entropy: normal live, malignant and dead cells of the same type, i.e., normal human lymphocytes, Jurkat T lymphocytes and dead cells.
In short, as discussed in the Introduction, the GLIE fluctuation measures are expected to differ between these cells. For instance, apoptotic and other recently dead cells have low entropy and GLIE fluctuations [18,20,27], while malignant cells have high entropy and GLIE fluctuation in comparison to matched normal healthy cells [2,29,30].
Measurements were performed under the same conditions. Procedures of cell separation, preparation of malignant cell aliquots, staining and death induction, are all described in Materials and Methods.
Table 1 summarizes the GLIE fluctuation parameters: AGLIE and HFAP results in dead lymphocytes, dead Jurkat cells, live normal lymphocytes and live Jurkat cells.
As can be seen, AGLIE and HFAP values of dead Jurkat cells and dead lymphocytes are not significantly different (p = 0.20 for AGLIE and p = 0.31 for HFAP measures).
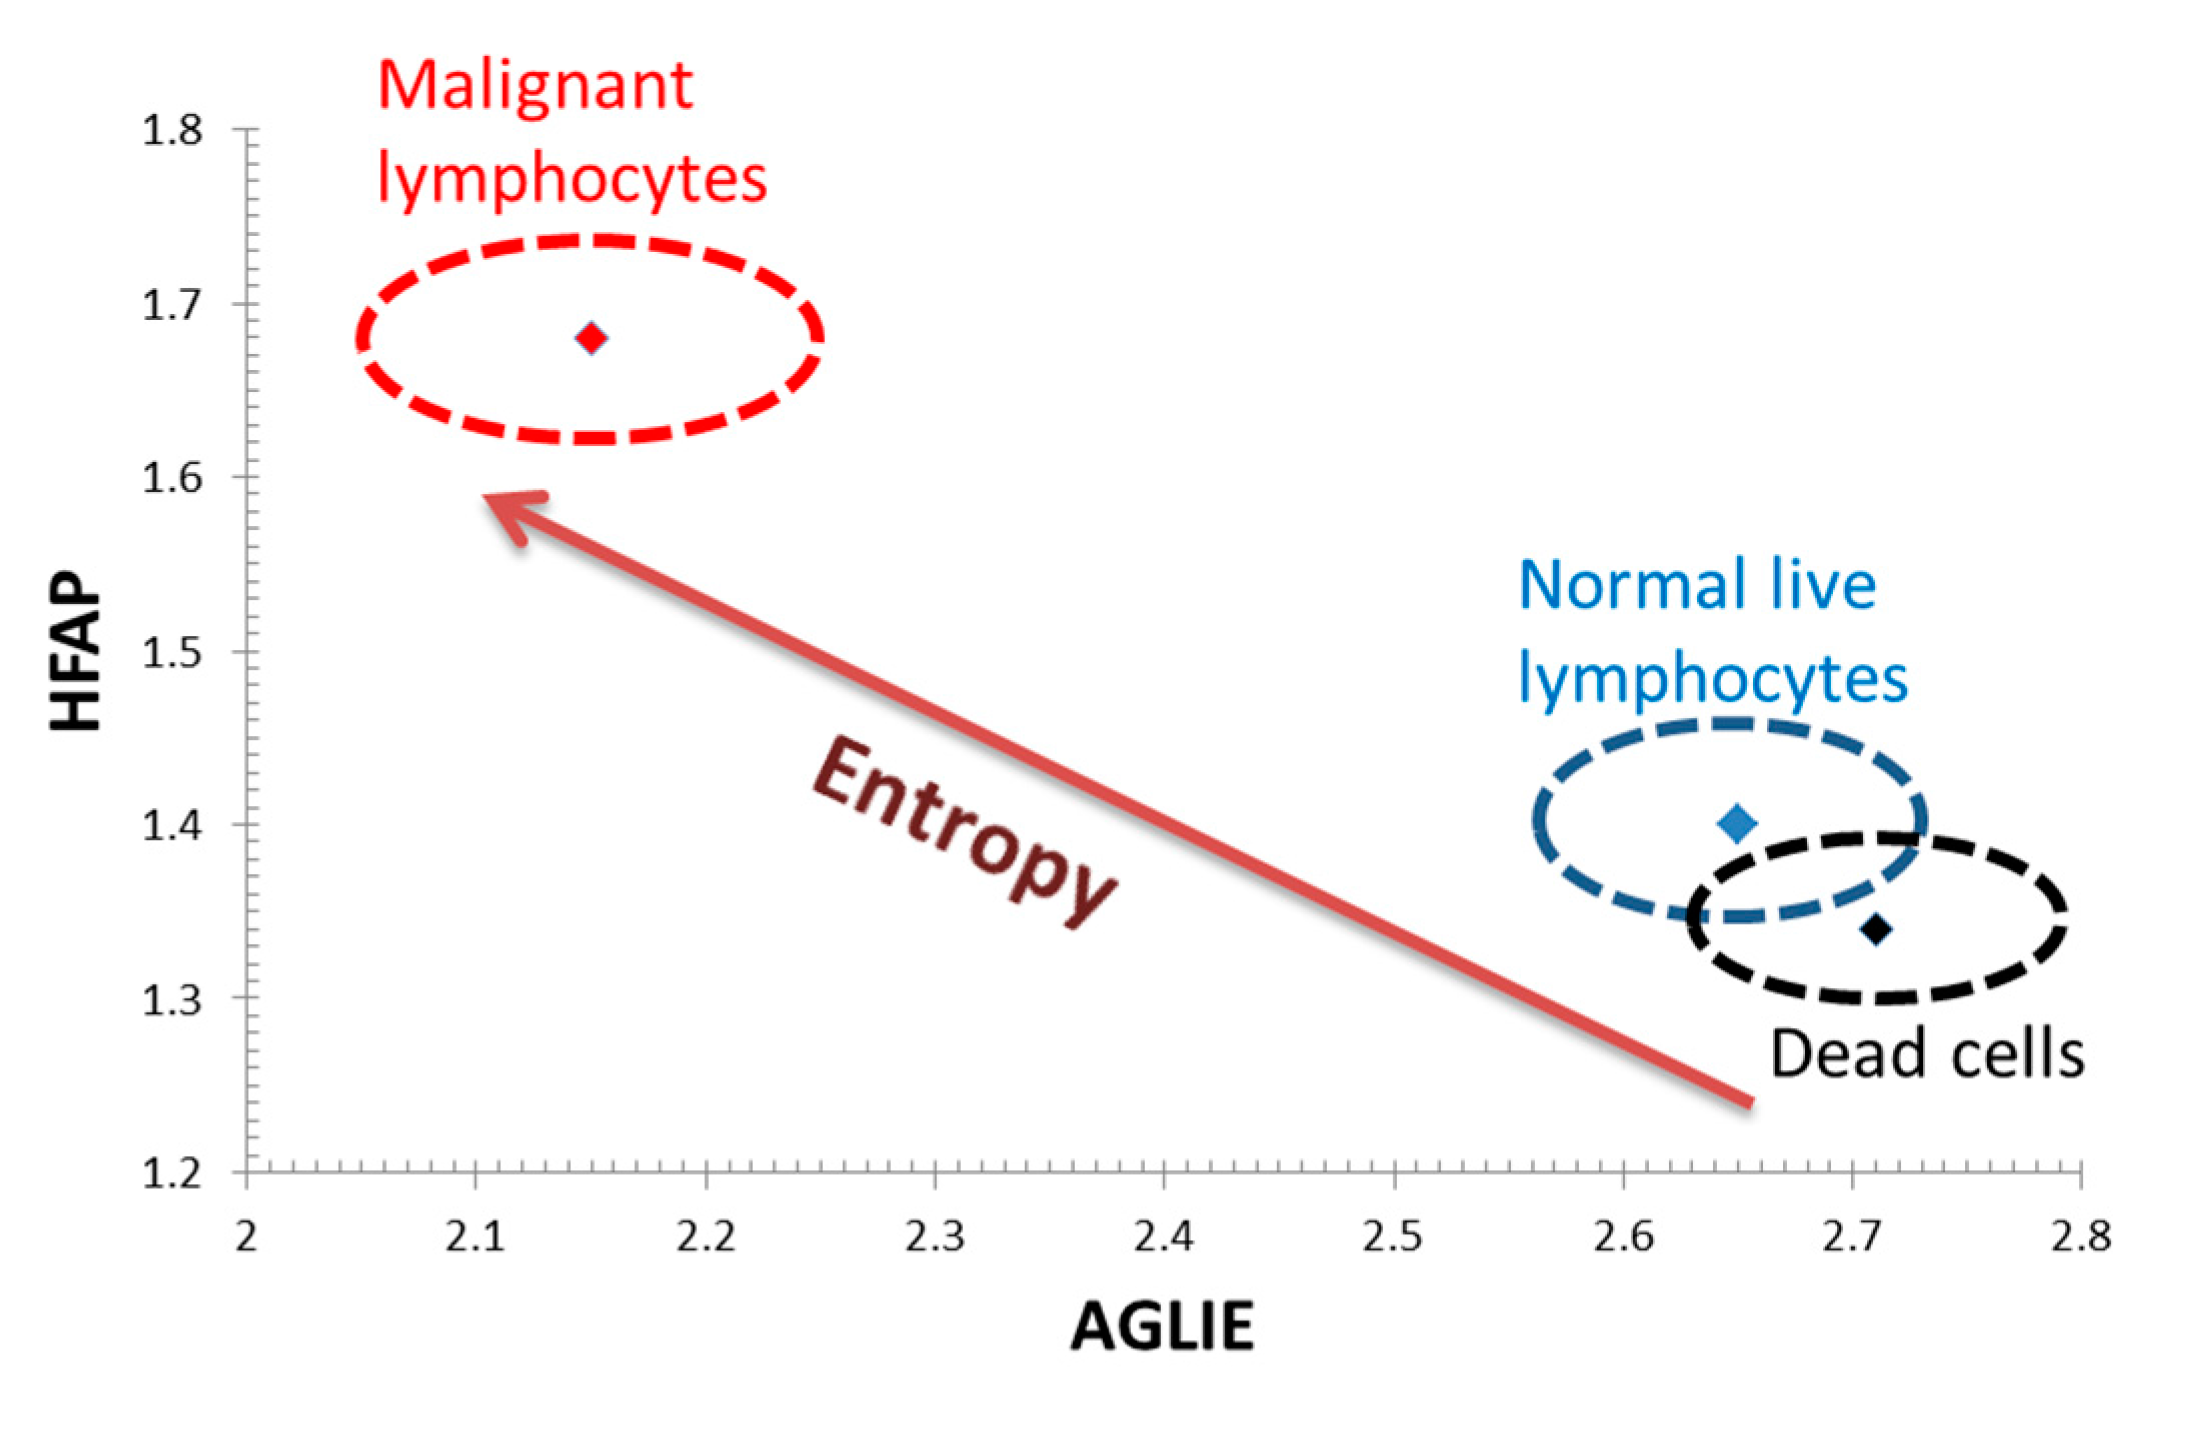
Table 1 clearly shows higher AGLIE values in dead lymphocytes and dead Jurkat cells when compared to those of normal live lymphocytes, which in turn, show higher AGLIE values when compared to those of malignant Jurkat cells. The opposite occurs with the HFAP parameter results: HFAP values are higher in malignant Jurkat lymphocytes when compared to normal live lymphocytes, which, in turn, are higher when compared to dead lymphocytes or dead Jurkat cells.
These outcomes are illustrated in Figure 7, where the combination of low HFAP values coupled with high AGLIE values in dead cells consistently change, with HFAP values rising and AGLIE values decreasing, at higher cellular entropic states in normal live cells, and even more so in malignant cells.
4. Conclusions
It has been previously found that GLIE random fluctuation parameters are related to intracellular particle diffusivity, to which, in this study, cellular thermodynamic generalized entropy was theoretically related.
Measures based on the fluctuating nature of GLIE for evaluation of tested medium fluctuations have a prominent advantage over steady state measurement of GLIE. While steady state measurement of GLIE may reflect intracellular medium fluctuations by reflection of the medium composition’s homogeneity, analyzing the fluctuation of GLIE (HFAP parameter) could evaluate intracellular medium fluctuations in a more direct and efficient way.
Moreover, the finding that GLIE fluctuation is indifferent to the intensity of the light which passes through the investigated measurement unit quite ideally enables accurate evaluation and adequate comparison of various mediums, each with a different magnitude of fluctuation.
The applicative aspect of the proposed GLIE fluctuation measures was successfully utilized for distinguishing between normal cells and tumor cells, and between dead and live cells as well, and hence, after completion of investigation, might be considered a candidate procedure for use in relevant laboratories and/or clinics.
Utilization of information entropy fluctuation measures to analyze cells in multiple physiologic and pathophysiologic conditions has the advantage of unique reflection of biophysical characterization, such as diffusivity and entropy, of the tested cells, in a simple and illustrative way.
Lastly, this study is believed to advance our understanding of the thermodynamics of information processing, with a special focus on, but not limited to, living systems. It contains both experimental and theoretical aspects, and to some extent, illuminates the general thermodynamic limits of information processing.
Supplementary Materials
The following are available online at www.mdpi.com/1099-4300/19/10/565/s1, One Microsoft Word File which includes: Analytical investigation of light intensity independency of GLIE SD together with Equations (S1)–(S10), as well as Simulation experiments together with Figure S1: versus , as calculated by simulation (blue curve) and Equation (S5) (orange curve), and Figure S2, versus as calculated by simulation (blue curve) and Equation (S10) (orange curve).
Acknowledgments
This study was endowed by the Bequest of Moshe Shimon and Judith Weisbrodt.
Author Contributions
Ishay Wohl and Mordechai Deutsch conceived and designed the experiments; Naomi Zurgil participated in the biological experimental design; Ishay Wohl performed the experiments and analyzed the data; Yaron Hakuk contributed analysis tools; Mria Sobolev contributed biological assistance and cells maintenance; Ishay Wohl and Mordechai Deutsch wrote the paper; Mordechai Deutsch supervised the study. All the authors have read and approved the final manuscript.
Conflicts of Interest
The authors declare no conflict of interest.
References
- Kitano, H. Systems Biology: A Brief Overview. Science 2002, 295, 1662–1664. [Google Scholar] [CrossRef] [PubMed]
- Tarabichi, M.; Antoniou, A.; Saiselet, M.; Pita, J.M.; Andry, G.; Dumont, J.E.; Detours, V.; Maenhaut, C. Systems biology of cancer: Entropy, disorder, and selection-driven evolution to independence, invasion and “swarm intelligence”. Cancer Metastasis Rev. 2013, 32, 403–421. [Google Scholar] [CrossRef] [PubMed]
- Banjeri, C.R.; Miranda-Saavedra, D.; Severini, S.; Windschwendter, M.; Enver, T.; Zhou, J.X.; Teschendorff, A.E. Cellular network entropy as the energy potential in Waddington’s differentiation landscape. Sci. Rep. 2013, 3, 3039. [Google Scholar] [CrossRef]
- Davies, P.C.; Rieperb, E.; Tuszynski, J.A. Self-organization and entropy reduction in a living cell. Biosystems 2013, 111, 1–10. [Google Scholar] [CrossRef] [PubMed]
- Kullback, S.; Leibler, R.A. On information and sufficiency. Ann. Math. Stat. 1951, 22, 79–86. [Google Scholar] [CrossRef]
- Guo, M.; Bao, E.L.; Wagner, M.; Whitsett, J.A.; Xu, Y. SLICE: Determining cell differentiation and lineage based on single cell entropy. Nucleic Acids Res. 2017, 45, e54. [Google Scholar] [CrossRef] [PubMed]
- Cheng, F.; Liu, C.; Shen, B.; Zhao, Z. Investigating cellular network heterogeneity and modularity in cancer: A network entropy and unbalanced motif approach. BMC Syst. Biol. 2016, 10, 65. [Google Scholar] [CrossRef] [PubMed]
- Maire, T.; Youk, H. Molecular-level tuning of cellular autonomy controls the collective behaviors of cell populations. Cell Syst. 2015, 1, 349–360. [Google Scholar] [CrossRef] [PubMed]
- Vilar, J.M.G. Entropy of Leukemia on Multidimensional Morphological and Molecular Landscapes. Phys. Rev. X 2014, 4, 021038. [Google Scholar] [CrossRef]
- Crofts, A.R. Life, information, entropy, and time: Vehicles for semantic inheritance. Complexity 2007, 13, 14–50. [Google Scholar] [CrossRef] [PubMed]
- Luo, L. Entropy production in a cell and reversal of entropy flow as an anticancer therapy. Front. Phys. China 2009, 4, 122–136. [Google Scholar] [CrossRef]
- Haralick, R.M.; Shanmugam, K.; Dinstein, I. Textural features for image classification. IEEE Trans. Syst. Man Cybern. 1973, SMC-3, 610–621. [Google Scholar] [CrossRef]
- Pantic, I.; Pantic, S.; Paunovic, J. Aging increases nuclear chromatin entropy of erythroid precursor cells or cells in mice spleen hematopoietic tissue. Microsc. Microanal. 2012, 18, 1054–1059. [Google Scholar] [CrossRef] [PubMed]
- Pantic, I.; Pantic, S.; Basta-Jovanovic, G. Gray level co-occurrence matrix texture analysis of germinal center light zone lymphocyte nuclei: Physiology viewpoint with focus on apoptosis. Microsc. Microanal. 2012, 18, 470–475. [Google Scholar] [CrossRef] [PubMed]
- Pantic, I.; Pantic, S. Germinal center texture entropy as possible indicator of humoral immune response: Immunophysiology viewpoint. Mol. Imaging Biol. 2012, 14, 534–540. [Google Scholar] [CrossRef] [PubMed]
- Pantic, I.; Pantic, S.; Paunovic, J.; Perovic, M. Nuclear entropy, angular second moment, variance and texture correlation of thymus cortical and medullar lymphocytes: Grey level co-occurrence matrix analysis. Anais Acad. Bras. Cienc. 2013, 85, 1063–1072. [Google Scholar] [CrossRef] [PubMed]
- Gonzalez, R.C.; Woods, R.E. Digital Image Processing; Prentice Hall: Upper Saddle River, NJ, USA, 2008; ISBN-13: 978-0131687288. [Google Scholar]
- Wiedemann, P.; Guez, J.S.; Wiegemann, H.B.; Egner, F.; Quintana, J.C.; Asanza-Maldonado, D.; Filipaki, M.; Wilkesman, J.; Schwiebert, C.; Cassar, J.P.; et al. In situ microscopic cytometry enables noninvasive viability assessment of animal cells by measuring entropy states. Biotechnol. Bioeng. 2011, 108, 2884–2893. [Google Scholar] [CrossRef] [PubMed]
- Schrödinger, E. What is Life? The Physical Aspect of the Living Cell; Cambridge University Press: Cambridge, UK, 1967. [Google Scholar]
- Wohl, I.; Zurgil, N.; Hakuk, Y.; Sobolev, M.; Galmidi, M.; Deutsch, M. In situ label-free static cytometry by monitoring spatiotemporal fluctuations of image gray values. J. Biomed. Opt. 2015, 20, 105013. [Google Scholar] [CrossRef] [PubMed]
- Wohl, I.; Zurgil, N.; Hakuk, Y.; Sobolev, M.; Deutsch, M. In Situ Evaluation of Physiological Activity and Mitochondrial Dysfunction via Novo Label-Free Measures Based on Fluctuation of Image Gray Values. J. Anal. Bioanal. Tech. 2016, 7, 2. [Google Scholar] [CrossRef]
- Paszek, P.; Jackson, D.A.; White, M.R.H. Oscillatory control of signalling molecules. Curr. Opin. Genet. Dev. 2010, 20, 670–676. [Google Scholar] [CrossRef] [PubMed]
- Oancea, E.; Meyer, T. Protein kinase C as a molecular machine for decoding calcium and diacylglycerol signals. Cell 1998, 95, 307–318. [Google Scholar] [CrossRef]
- Codazzi, F.; Teruel, M.N.; Meyer, T. Control of astrocyte Ca2+ oscillations and waves by oscillating translocation and activation of protein kinase C. Curr. Biol. 2001, 11, 1089–1097. [Google Scholar] [CrossRef]
- Giri, L.; Patel, A.K.; Karunarathne, W.K.; Kalyanaraman, V.; Venkatesh, K.V.; Gautam, N. A G-protein subunit translocation embedded network motif underlies GPCR regulation of calcium osscillations. Biophys. J. 2014, 107, 242–254. [Google Scholar] [CrossRef] [PubMed]
- Hatano, T.; Sasa, S. Steady State Thermodynamics of Langevin Systems. Phys. Rev. Lett. 2001, 86, 3463–3466. [Google Scholar] [CrossRef] [PubMed]
- Saraste, A.; Pulkki, K. Morphologic and biochemical hallmarks of apoptosis. Cardiovasc. Res. 2000, 45, 528–537. [Google Scholar] [CrossRef]
- Hakumäki, J.M.; Poptani, H.; Puumalainen, A.M.; Loimas, S.; Paljärvi, L.A.; Ylä-Herttuala, S.; Kauppinen, R.A. Quantitative 1H nuclear magnetic resonance diffusion spectroscopy of BT4C rat glioma during thymidine kinase-mediated gene therapy in vivo: Identification of apoptotic response. Cancer Res. 1998, 58, 3791–3799. [Google Scholar] [PubMed]
- Montero, S.; Martin, R.R.; Guerra, A.; Casanella, O.; Cocho, G.; Nieto-Villar, J.M. Cancer Glycolysis I. Entropy Production and Sensitivity Analysis in Stationary State. J. Adenocarcinoma 2016, 1, 8. [Google Scholar]
- Molnar, J.; Thornton, B.S.; Gábor, P. Thermodynamics and Information Physics Offer New Opportunities in Cancer Therapy. Curr. Cancer Ther. Rev. 2014, 10, 234–245. [Google Scholar] [CrossRef]
- Guo, M.; Ehrlicher, A.J.; Jensen, M.H.; Renz, M.; Moore, J.R.; Goldman, R.D.; Lippincott-Schwartz, J.; Mackintosh, F.C.; Weitz, D.A. Probing the stochastic, motor-driven properties of the cytoplasm using force spectrum microscopy. Cell 2014, 158, 822–832. [Google Scholar] [CrossRef] [PubMed]
- Sunray, M.; Zurgil, N.; Shafran, Y.; Deutsch, M. Determination of individual cell Michaelis-Menten constants. Cytometry 2002, 47, 8–16. [Google Scholar] [CrossRef] [PubMed]
- Ravid-Hermesh, O.; Zurgil, N.; Shafran, Y.; Sobolev, M.; Galmidi, M.; Badihi, Y.; Israel, L.L.; Lellouche, J.P.; Lellouche, E.; Michaeli, S.; et al. Real-time quantification of protein expression and translocation at individual cell resolution using imaging-dish-based live cell array. Anal. Bioanal. Chem. 2014, 406, 7085–7101. [Google Scholar] [CrossRef] [PubMed]
- MacKintosh, F.C.; Levine, A.J. Nonequilibrium mechanics and dynamics of motor-activated gels. Phys. Rev. Lett. 2008, 100, 018104. [Google Scholar] [CrossRef] [PubMed]
- Mizuno, D.; Tardin, C.; Schmidt, C.F.; MacKintosh, F.C. Nonequilibrium mechanics of active cytoskeletal networks. Science 2007, 315, 370–373. [Google Scholar] [CrossRef] [PubMed]
- Brangwynne, C.P.; Koenderink, G.H.; MacKintosh, F.C.; Weitz, D.A. Intracellular transport by active diffusion. Trends Cell Biol. 2009, 19, 423–427. [Google Scholar] [CrossRef] [PubMed]
- Cartwright, J.H.E.; Piro, O.; Tuval, I. Fluid dynamics in developmental biology: Moving fluids that shape ontogeny. HFSP J. 2009, 3, 77–93. [Google Scholar] [CrossRef] [PubMed]
- Shabaniverki, S.; Juárez, J.J. Characterizing gelatin hydrogel viscoelasticity with diffusing colloidal probe microscopy. J. Colloid Interface Sci. 2017, 497, 73–82. [Google Scholar] [CrossRef] [PubMed]
- Saks, V.; Beraud, N.; Wallimann, T. Metabolic Compartmentation—A System Level Property of Muscle Cells. Int. J. Mol. Sci. 2008, 9, 751–767. [Google Scholar] [CrossRef] [PubMed]
- Hudder, A.; Nathanson, L.; Deutscher, P. Organization of Mammalian Cytoplasm. Mol. Cell. Biol. 2003, 23, 9318–9326. [Google Scholar] [CrossRef] [PubMed]
- Kissick, D.J.; Muir, R.D.; Simpson, G.J. Statistical treatment of photon/electron counting; extending the linear dynamic range from the dark count rate to saturation. Anal. Chem. 2010, 82, 10129–10134. [Google Scholar] [CrossRef] [PubMed]
- Evans, R.J.; Boersma, J. The Entropy of a Poisson Distribution. SIAM Rev. 2006, 30, 314–317. [Google Scholar] [CrossRef]
- Moore, C.C. Ergodic theorem, ergodic theory, and statistical mechanics. Proc. Natl. Acad. Sci. USA 2015, 112, 1907–1911. [Google Scholar] [CrossRef] [PubMed]
Figure 1.
Normal lymphocyte (a) and Jurkat cell (b) in the PW matrix. At about the center of each cell, 50 × 50 pixel ROIs (5.5 µm wide) are marked.
Figure 1.
Normal lymphocyte (a) and Jurkat cell (b) in the PW matrix. At about the center of each cell, 50 × 50 pixel ROIs (5.5 µm wide) are marked.

Figure 2.
Live cell time-dependent GLIE25 of one typical measurement unit and its Fourier analysis. Images were acquired at 0.5 s intervals out of which GLIE25 values were calculated (a), and its power spectrum was analyzed (b).
Figure 2.
Live cell time-dependent GLIE25 of one typical measurement unit and its Fourier analysis. Images were acquired at 0.5 s intervals out of which GLIE25 values were calculated (a), and its power spectrum was analyzed (b).

Figure 3.
Schematic representation of an intracellular element (yellow circle) positioned between a light source (not shown) and a light detector (single pixel camera). The detecting space is represented by the light brown rectangle. Three representative positions of the element in relation to the detector’s detecting area are as follows: First, the centers of detection area and particle coincide so that the detecting pixel is maximally shadowed, resulting in the lowest gray value. Second, the element is on the right and out of the detection area, resulting in the maximum gray value. Third, the element is positioned to the left of the origin, only partially concealing the detector, resulting in an intermediate gray value. Each Gaussian represents the particle translocation distribution for different diffusivity in a time lag of 1 s (see inset).

Figure 4.
Schematic representation of Equation (3): Entropy versus diffusivity in a time lag of 1 s (matching our experimental frequency range).
Figure 4.
Schematic representation of Equation (3): Entropy versus diffusivity in a time lag of 1 s (matching our experimental frequency range).

Figure 5.
Schematic diagram of the positive correlations between diffusivity and entropy of intracellular particles, and diffusivity and related GLIE fluctuation-based measure: HFAP.
Figure 5.
Schematic diagram of the positive correlations between diffusivity and entropy of intracellular particles, and diffusivity and related GLIE fluctuation-based measure: HFAP.

Figure 6.
The dependency of number of gray values, AGLIE and derived fluctuate measures on light intensity. The parameters that were measured in different light intensities in the 5 × 5 pixel measurement units of the 6 measured areas were: (a) Average number of gray values, (b) the SD of the number of gray values in the time dependent 200 measurements, (c) the average GLIE values and (d) the SD of GLIE values in the time dependent 200 measurements. Points are connected by a curve in order to emphasize the trend of the results. Coefficient of variation never exceeded 1%.

Figure 7.
Average values of AGLIE and HFAP parameters in the three groups of cells: dead Jurkat and dead lymphocyte cells (black), normal live lymphocytes (blue) and malignant lymphocytes—Jurkat cells (red). The ellipses around the average values in the cell group represent one SD of AGLIE and HFAP values.


Table 1.
Results of AGLIE and HFAP (average and SD) obtained in dead Jurkat cells, live Jurkat cells, live normal lymphocytes, and dead lymphocytes. The p-values are located between two relevant columns.
Table 1.
Results of AGLIE and HFAP (average and SD) obtained in dead Jurkat cells, live Jurkat cells, live normal lymphocytes, and dead lymphocytes. The p-values are located between two relevant columns.
| Parameter | Dead Jurkat | p-Value | Jurkat | p-Value | Normal Lymph | p-Value | Dead Lymph |
|---|---|---|---|---|---|---|---|
| # of cells | 32 | - | 43 | - | 60 | - | 75 |
| AGLIE | 2.72 ± 0.08 | p < 10−5 | 2.15 ± 0.10 | p < 10−5 | 2.65 ± 0.08 | p < 10−5 | 2.7 ± 0.07 |
| HFAP | 1.35 ± 0.05 | p < 10−5 | 1.68 ± 0.06 | p < 10−5 | 1.40 ± 0.06 | p < 10−5 | 1.34 ± 0.05 |
© 2017 by the authors. Licensee MDPI, Basel, Switzerland. This article is an open access article distributed under the terms and conditions of the Creative Commons Attribution (CC BY) license (http://creativecommons.org/licenses/by/4.0/).
Share and Cite
MDPI and ACS Style
Wohl, I.; Zurgil, N.; Hakuk, Y.; Sobolev, M.; Deutsch, M. Fluctuation of Information Entropy Measures in Cell Image. Entropy 2017, 19, 565. https://doi.org/10.3390/e19100565
AMA Style
Wohl I, Zurgil N, Hakuk Y, Sobolev M, Deutsch M. Fluctuation of Information Entropy Measures in Cell Image. Entropy. 2017; 19(10):565. https://doi.org/10.3390/e19100565
Chicago/Turabian StyleWohl, Ishay, Naomi Zurgil, Yaron Hakuk, Maria Sobolev, and Mordechai Deutsch. 2017. "Fluctuation of Information Entropy Measures in Cell Image" Entropy 19, no. 10: 565. https://doi.org/10.3390/e19100565
Note that from the first issue of 2016, this journal uses article numbers instead of page numbers. See further details here.