Article

Changes in the Composition of the Lactic Acid Bacteria Behavior and the Diversity of Oenococcus oeni Isolated from Red Wines Supplemented with Selected Grape Phenolic Compounds

1
CBQF—Centro de Biotecnologia e Química Fina—Laboratório Associado, Escola Superior de Biotecnologia, Universidade Católica Portuguesa, 4202-401 Porto, Portugal
2
Plataforma de Inovação da Vinha e do Vinho, Universidade dos Tras-os-Montes e Alto Douro, 5001-801 Vila Real, Portugal
*
Author to whom correspondence should be addressed.
Fermentation 2019, 5(1), 1; https://doi.org/10.3390/fermentation5010001
Submission received: 19 November 2018 / Revised: 17 December 2018 / Accepted: 18 December 2018 / Published: 20 December 2018

Abstract

:
Phenolic compounds are important components of wine and are known to have an impact on the physiology of wine microbes. The influence of specific sub-sets of phenolic compounds on the growth and metabolism of lactic acid bacteria (LAB) and on the diversity of Oenococcus oeni in inoculated and non-inoculated red wines was investigated during malolactic fermentation (MLF) and subsequent storage. Representative O. oeni strains from wines treated with flavonols and trans-resveratrol were isolated and analyzed by pulsed-field gel electrophoresis of rare restriction enzyme digests (REA-PFGE). 28 days after MLF initiation, strains from all samples had entered the death phase, except those supplemented with trans-resveratrol. In the non-inoculated samples, the onset of lactic acid production was apparently delayed by all compounds tested, except for the flavan-3-ols. Increased levels of phenolics also delayed citrate consumption in inoculated samples. PFGE analysis revealed 22 genetic profiles, and some profiles were characteristics of specific samples. The commercial starter used in the inoculated wines did not dominate during MLF. The effect of the phenolics studied was dependent on the origin and concentration of each as well, as the fermentation stage and whether the wines were inoculated. The effect of flavonols and trans-resveratrol seemed to be strain-dependent, which could have implications on the final quality of wines.

1. Introduction

Malolactic fermentation (MLF) is a desirable step in the vinification process of most red wines. It is conducted by certain specific species of lactic acid bacteria (LAB), by far the most important of which is Oenococcus oeni. The result of a successful MLF is an increased microbial stability of wine through the consumption of key carbon sources and other nutrients, which might otherwise be used by spoilage microorganisms, and through the production of antimicrobial compounds by LAB [1,2]. The organoleptic properties of wine can also be altered during MLF by the consumption and liberation of various metabolites [3,4]. Residual sugars can be metabolized into lactic acid or lactic acid, carbon dioxide, and ethanol or acetic acid via the fermentative pathways of LAB. Acetic acid, and hence the oenological parameter volatile acidity, can also increase in wine from the degradation of citric acid during MLF [5]. This MLF can be spontaneous, due to the microflora present in the winery or from the grape material, or it can be induced by inoculation with one of a number of selected starters, chosen according to their technological or quality attributes. As a consequence of their adaptation to the wine environment, in particular, their tolerance to wine’s acidity and alcohol concentration, strains of O. oeni are the predominant LAB responsible for the MLF. Thus, starter cultures for the MLF are also predominantly selected from this species. The strain-level diversity of O. oeni populations in wine ecosystems is very high, and it can be region- and winery-specific [6,7], often contributing to recognized differences in wines. O. oeni has been shown to genetically adapt according the type of wine (white or red), driven by the pH and the phenolic compounds present [8].
Taxonomically, the species is ordered into three groups, with A and B being the two major phylogenetic groups, and C a putative group composed of a unique strain isolated from cider. Group A exclusively contains strains found in wine. All strains from cider, except that attributed to group C, are located in group B, while strains from Champagne and Burgundy are only from group A. It appears that most of the strains isolated from malolactic ferments derive from the domestication of ancestral O. oeni strains during the process of the industrialization of wine and cider, rather than responding to geographical constraints [9,10,11].
Several molecular techniques have been applied to determine the diversity of LAB in red wines. Polymerase chain reaction (PCR) -based techniques including 16S metabarcoding sequencing [12], PCR-DGGE (denaturing gradient gel electrophoresis) [13] and species-specific multiplex PCR [14] are used on samples taken directly from wines, but these are as yet limited to differentiation to the species level at most. To reach an intra-species discrimination level, prior isolation stage is still required. Randomly amplified polymorphic DNA (RAPD) and pulsed-field gel electrophoresis of rare restriction enzyme digests (REA-PFGE) are molecular methods frequently employed to investigate the strain diversity of several species of wine LAB [15]. PFGE proved to be a quick tool to study the O. oeni community, and their fluctuation in wine and the level of discrimination of PFGE depends on the restriction enzyme used [7,9,13]. To achieve a finer differentiation of isolated strains, other methods that have been applied to this area include multilocus sequence typing (MLST) [6,9,13], multiple locus variable number of tandem repeat analysis (VNTR) [16], differential display PCR [7], and single nucleotide polymorphisms (SNPs) [6].
In the context of wine, phenolic compounds are naturally occurring molecules that are derived from grape material. They are important components of wine, contributing many sensorially and technologically relevant traits to the finished product. Phenolics constitute a highly diverse group of compounds, having in common the possession of at least one phenolic ring in their structure, but varying greatly in structure and size, and consequently their impact on wine quality.
Many practices employed in the winemaking process influence the phenolics composition and concentration in pre-malolactic wines. These begin with viticulture (grape variety and clone, light exposure, degree of ripeness) and continue in the winery (destemming, crushing, pre-fermentation maceration, alcoholic fermentation, pressing) options and parameters, amongst others. Must freezing, cryogenic maceration, extended maceration, enzyme regime, and alcoholic fermentation temperature have been reported to increase phenolics concentrations in wines [17,18,19,20]. On the other hand, according to Olejar et al., mechanical harvesting could contribute to decreases in phenolics through reactions with oxidative radicals [20]. In the study of Caridi et al., one S. cerevisiae strain used as a starter for alcoholic fermentation was shown to enhance red wine content in phenolic compounds, especially in trans-resveratrol, trans-caffeic acid, quercetin and (−)-epicatechin [21].
Phenolic compounds found in wines are normally classified in two groups; the flavonoids, which include anthocyanins, flavan-3-ols and flavonols (and other flavone derivatives), and the non-flavonoids, which comprise hydroxycinnamic acids and stilbenes among others [22]. Wine flavan-3-ols, mainly (+)-catechin and (−)-epicatechin, are primarily synthesized in seeds and stems, and are the precursors of procyanidins and condensed tannins, which contribute to the astringency and bitterness of wines. Flavonols, mainly represented by quercetin, myricetin, and kaempferol, are responsible for the yellow color of white wines. Hydroxycinnamic acids (HCA) are mostly found in grapes in their bound (tartaric ester) forms, located in the vacuoles of the skin and pulp cells. In their free forms (trans-p-coumaric acid, trans-ferulic acid, and trans-caffeic acid), HCA are important compounds in the oxidation processes of wine, and they act as color stabilizers and flavor precursors [23,24,25]. Trans-resveratrol is the most relevant stilbene in wine, known for its antioxidant activity [26] and mostly coming from grape skins, being biosynthesized via the phenylalanine pathway as a defense response to biotic and abiotic stresses [27].
Some phenolic compounds have been shown to have a species and strain-dependent impact on the activity of bacteria, which are relevant to wine quality. Phenolics can activate or inhibit microbial growth and metabolism, depending on their structures and concentrations [28,29]. Hydroxycinnamic acids, and especially trans-p-coumaric acid, have been shown to exhibit a strong inhibitory effect on the growth and survival of malolactic starters and wine-spoilage strains [30,31,32,33]. In addition to their antimicrobial effects, the presence of HCA has been observed to increase the cell membrane permeability of some wine LAB, to delay their metabolism of glucose and citric acid, and to increase the yield of lactic and acetic acid production from glucose [29,34]. According to Devi et al. [35], the microbial response to exposure to HCA is, in part, manifested as changes in membrane and enzyme compositions. Quercetin and (+)-catechin can stimulate cell growth and metabolism, or they have an antimicrobial effect, depending on their concentrations and the microorganisms targeted. Vaquero et al. [36] investigated the negative impacts of both quercetin and (+)-catechin against pathogenic bacteria. Some other studies mention that flavonols possess antimicrobial activities linked to their antioxidant properties, and to their potential cytotoxicity [37,38]. At high concentrations, (+)-catechin has been observed to have an inhibitory effect on bacterial development [39]. However, according to another study, quercetin and (+)-catechin could stimulate MLF by O. oeni under certain conditions [40]. Moreover, previously published research suggest that some levels of (+)-catechin can activate the cell growth of some Pediococus pentosaceus and Lactobacillus plantarum strains [41]. Devi et al. [35] noted that among all the phenolic compounds tested, (+)-catechin exercised the least stress on the LAB tested. As for trans-resveratrol, this stilbene was described as a strong inhibitor against some contaminant yeasts and acetic acid bacteria [42]. Furthermore, as reported by García-Ruiz et al. [43], both stilbenes and flavonols may have a negative impact on the growth of the O. oeni, L. hilgardii and P. pentosaceus strains isolated from wine. In addition, flavonols, especially kaempferol, have found to strongly inactivate some LAB by damaging their membranes [44]. Of course, the concentration of the compounds tested is critical to any effect, and most of the studies cited on this specific subject have been performed in culture media, with concentrations of phenolic compounds being far higher than those found in wines, and certainly not under real wine conditions.
In this present paper, the development of the malolactic microbiota was studied throughout, and immediately following MLF conducted with and without O. oeni starter inoculation. A post-alcoholic fermentation red wine, supplemented with varying concentrations of flavan-3-ols, HCA, flavonols, and trans-resveratrol was the matrix used in this experiment. The development of specific O. oeni strains was followed in the samples treated with flavonols and trans-resveratrol.
This study evaluated the impact of the addition of specific groups of phenolic compounds on the behavior of wine LAB, and more specifically, on the diversity of MLF starter O. oeni strains. The novelty of the work lies in the fact that it was performed directly in post-alcoholic fermentation wine supplemented with concentrations of phenolics that are within the range that is encountered in real wine situations.

2. Results

2.1. Effect of Grape Phenolic Compounds on the Growth of LAB

A significant reduction in the total bacterial growth (LAB) was observed after 14 days of incubation for both spontaneous and inoculated samples containing three times their initial concentrations in flavonols and HCA (Figure 1d,f). At the lower concentrations tested, no impact was detected by flavonols, and only the bacterial growth rate of the wines undergoing spontaneous MLF was affected by HCA (Figure 1e). At the single concentration under which it was tested (3× original), trans-resveratrol showed an inhibitory effect similar to 2× HCA on the non-inoculated samples (Figure 1g).
After 28 days of incubation, the LAB were in the death phase. The inhibitory effect was greater for 2× flavan-3-ols on the non-inoculated wines and 3× flavan-3-ol on the inoculated ones (Figure 1a,b). On the contrary, in the case of both the inoculated and non-inoculated samples supplemented with trans-resveratrol, the bacterial population was higher than for the other samples (Figure 1g). No significant effect from the flavonols and HCA addition was observed at this stage.

2.2. Influence of the Natural Phenolics Studied on the LAB Metabolism

During MLF, citric and l-malic acids are usually consumed by LAB before glucose and fructose are metabolized [28]. MLF was considered to be finished in all the wines 14 days after its initiation, as l-malic acid was no longer detectable at this time (detection limit = 0.16 g/L). Bacterial metabolism was affected differently, depending on the type of MLF (spontaneous or induced), and on the phenolic compounds added. Table 1 shows that the addition of all phenolic compounds except flavan-3-ols delayed the production of lactic acid in the samples undergoing spontaneous MLF. In the inoculated wines, only flavan-3-ols, at 3× concentration, suppressed lactic acid production (Table 2). At the end of MLF, the concentration of acetic acid appeared to be lower for the non-inoculated wines treated with 3× flavonols, 3× HCA and 3× trans-resveratrol (respectively, 0.34 ± 0.03 g/L, 0.32 ± 0.03 g/L, and 0.33 ± 0.05 g/L, against 0.43 ± 0.00 g/L for the controls). However, the contrary effect was observed after 28 days of incubation for the 3× HCA and 3× trans-resveratrol experiments. Citric acid was already completely consumed at the end of MLF in the wines that went through the spontaneous MLF. In the samples inoculated with Oenos™, the addition of the phenolics studied decreased citrate consumption during MLF when compared to the control.

2.3. Diversity of O. oeni Isolated From Red Wines Treated with Flavonols and Trans-Resveratrol

Pulsed-field gel electrophoresis of rare restriction enzyme digests analysis (REA-PFGE) of genomic DNA from seven commercial O. oeni strains showed that the NotI enzyme, used at 20 U, yielded more discriminating restriction fragments than ApaI (20 U and 40 U), producing different patterns consisting of 8–12 bands in the range of 33.3 kb–1135 kb (Figure S1).
A total of 70 O. oeni colonies isolated from spontaneous fermentations and inoculated fermentations, as well as seven commercial starters were characterized genotypically by REA-PFGE. It was not possible to grow seven of the isolates, and for three further isolates, it was not possible to obtain a restriction enzyme digest (Table 3). Cluster analysis of the PFGE profiles of the 70 refreshed O. oeni isolates revealed 22 genotypes with specific profiles, three of these genotypes (P, T, V) contained commercial strains (Figure 2). Most of the isolated strains digested with NotI shown predominantly 8, 9, or 10 bands.
On inspecting the dendrogram (Figure 2), the percentage of similarity between the unrelated profile varied from 62.5% to 96%. The seven commercial strain profiles were clustered together at 85% similarity. CiNe™ and Oenos™ profiles were ≥95% similar to CH16™ and CH35™.
The results also showed a clear distinction between most of the O. oeni strains isolated at the beginning of incubation, and those isolated 28 days later. The strains of profiles A, B, C (five strains), D and E were isolated specifically from the wines at the beginning of the MLF. Some strains from the profiles L and N were detected at both time-points.
Differences in the O. oeni strain composition were observed between inoculated and non-inoculated samples supplemented with the same family of phenolic compound. The commercial strain OenosTM, used as a starter for the inoculated wine samples, apparently did not predominate during the malolactic fermentation. In fact, only one of the colonies isolated from the inoculated non-treated wines (WP265O) after 28 days of incubation, had the same PFGE profile as this starter strain (V). Two other strains considered by this analysis to be part of the same PFGE profiles of, respectively, AlphaTM (P) and CH11TM (T), were found. The first one was in the non-inoculated wine treated with flavonols, and the second one was in the inoculated, non-treated wine. Among the 22 PFGE profiles, 12 were characterized by a unique strain, with the inoculated, non-treated wine containing the most of these.
Profiles L, F, and N showed the highest number of strains with 15, 13, and 8 isolates, respectively. The profile L was mostly present after 28 days of incubation in the non-supplemented samples, and F in the samples supplemented with flavonols, in the case of inoculated and non-inoculated wines.
Concerning the O. oeni diversity in the supplemented wines compared to the non-supplemented ones, the profiles X, Z and M were found only in non-supplemented wines. X and Z were unique strain profiles from inoculated samples, and profile M was composed of three strains from non-inoculated samples. I (three strains) and Q (unique strain) were two PFGE profiles only found in inoculated wines with added trans-resveratrol, contrary to J (two strains) and O (three strains) which were present in all the samples after 28 days of incubation, but the ones that were treated with the stilbene were studied. G and H (one strain each) were exclusively observed in wines treated with flavonols, contrary to Y (three strains). The strains from profile K were isolated in wines treated with both the phenolics studied.

3. Discussion

In this present study, biochemical, microbiological, and molecular tools were used to study the development of lactic acid bacteria, and the diversity of Oenococcus oeni strains isolated from red wines treated with small, grape-derived, phenolic compounds. In order to analyze the effect of an increase of particular classes of phenolics on MLF, the concentrations of flavan-3-ols, hydroxycinnamic acids, flavonols, and trans-resveratrol were doubled and tripled in inoculated and non-inoculated, post-alcoholic fermentation wines.
Unlike the results obtained by Hernandez et al. [45], the concentrations of all the phenolics tested, except trans-p-coumaric acid, decreased during MLF for both inoculated and non-inoculated wines (Table S1). This observation might be explained by the complexation or precipitation of these compounds, or it may indeed be linked to the specific microbial population of the wine and some interaction with it.
The results reported here show that the effect of the phenolics studied on the growth and metabolism of LAB during MLF, as well as on the intraspecific diversity of O. oeni, was influenced by the type of phenolic and their concentrations, the stage of the fermentation and whether the wines were inoculated.
The addition of all the compounds tested, except for the flavan-3-ols, caused a delay in the lactic acid production for the non-inoculated wines. The reduction of the lactic acid production rate by the microbiota of non-inoculated samples treated with flavonols and HCA is concomitant with the inhibitory nature of these compounds at these concentrations (Figure 1d,f).
The effect of flavan-3-ols on the LAB growth during fermentation was found to be dependent on the microbial population of the samples. No inhibitory effect was observed on the non-inoculated samples, but depending of the concentrations added, these compounds can negatively impact the LAB growth or delay the lactic acid production in the wine inoculated with the starter OenosTM. These observations are in agreement with previous studies showing the variable effect of (+)-catechin on different LAB [35,36,39].
The acetic acid yield was apparently repressed in the non-inoculated samples by HCA and trans-resveratrol at the end of MLF (14 days), although it increased after 28 days. A possible shift in the metabolic pathway of glucose consumption in OenosTM towards acetic acid production, caused by hydroxycinnamic acids by was previously observed by Campos et al. [34] in experiments performed in growth medium. In our study, this observation is also noted for trans-resveratrol’s effect on some indigenous LAB.
All of the compounds tested apparently caused a delay in citric acid degradation by the LAB in inoculated wines. A similar observation on citrate metabolism was shown by Campos et al. [34], using the same O oeni stain that was inoculated in the growth medium and supplemented with HCA and other benzoic acids.
As reported by García-Ruiz et al. [43], trans-resveratrol had a similarly negative impact on the growth and metabolism of LAB in non-inoculated samples as flavonols and HCA. Nevertheless, in this study, 28 days after initiation of incubation, the bacterial concentrations were higher in the wines treated with trans-resveratrol.
Polyphenol extracts have been tested on the O. oeni intra-diversity in wine [8,13] but the effect of the addition of the individual families of phenolic compounds so far has not been explored. The peculiar activity of flavonols and trans-resveratrol against the O. oeni distribution in the wines was investigated in a preliminary way in this current study. PFGE-REA has been used successfully for strain typing O. oeni in red wines [6,7,13]. In this work, a PFGE-REA technique was employed on the 80 representative isolates from the non-treated wines, and the wines treated with flavonols and trans-resveratrol and identified as O. oeni by microscopic observation. NotI was used as a restriction enzyme to study the diversity and evolution of the wine O. oeni population. The isolates showed 22 different genetic profiles, indicating a considerable intra-specific diversity in the wines. One of the colonies that were randomly selected for subculture from the wines with no prior addition of phenolic compounds presented the same pattern as Oenos™, the starter that was employed in other parts of the experiment. The post-alcoholic fermentation wines used in this study were characterized by LAB concentrations of ~104 CFU/mL. Together with a high diversity of O. oeni strains, these factors could explain why Oenos™, in inoculated experiments appears not to dominate the indigenous microbiota in this particular wine. The diversity of O. oeni was more influenced by the fermentation time than the type of MLF (inoculated or not) and the concentration of the phenolic compounds under study. Indeed, as observed in Figure 2, two clear clusters, corresponding to the two strain isolation time points, grouped all the patterns.
The effect of phenolics on O. oeni seems also to be strain-dependent. Some authors [43] have observed a strong inhibitory effect for quercetin against four different O. oeni strains, with an IC50 of 0.148 to 0.454 g/L, while others [40] have shown that the addition of 5–25mg/L of quercetin-activated malic acid degradation by another O. oeni strain. In our study, the profile L, grouping the highest number of strains, was less represented in the phenolic-treated samples. Moreover, the profiles X, Z, and M were found only in the wines, with no prior addition of phenolic compounds. A possible interpretation is that these strains are less tolerant to flavonols and stilbenes. The same goes for the strains from profiles I and Q, which are possibly enhanced by trans-resveratrol, whilst strains from profiles G and H might be activated by flavonols. On the other hand, strains from profiles J and O could be negatively impacted by trans-resveratrol and those from profile Y, by flavonols. These results seem to indicate that flavonols and trans-resveratrol could affect O. oeni positively or negatively, depending on the specific strain.
In summary, the effects of the addition of specific phenolic compounds on LAB behavior during MLF in wine have been described in this paper, highlighting the importance, in this respect, of the pre-malolactic winemaking techniques that influence the phenolic composition of the wine. More particularly, the increase of flavonols and trans-resveratrol concentrations at this stage could influence the malolactic bacterial population at the strain level and therefore possibly also the metabolic activities occurring during this period. More work should be focused on the specific effect of these compounds on each PFGE profile. Current work is being concentrated upon the effects of small grape phenolics on the metabolite characterization of wines following inoculated and spontaneously conducted MLF.

4. Materials and Methods

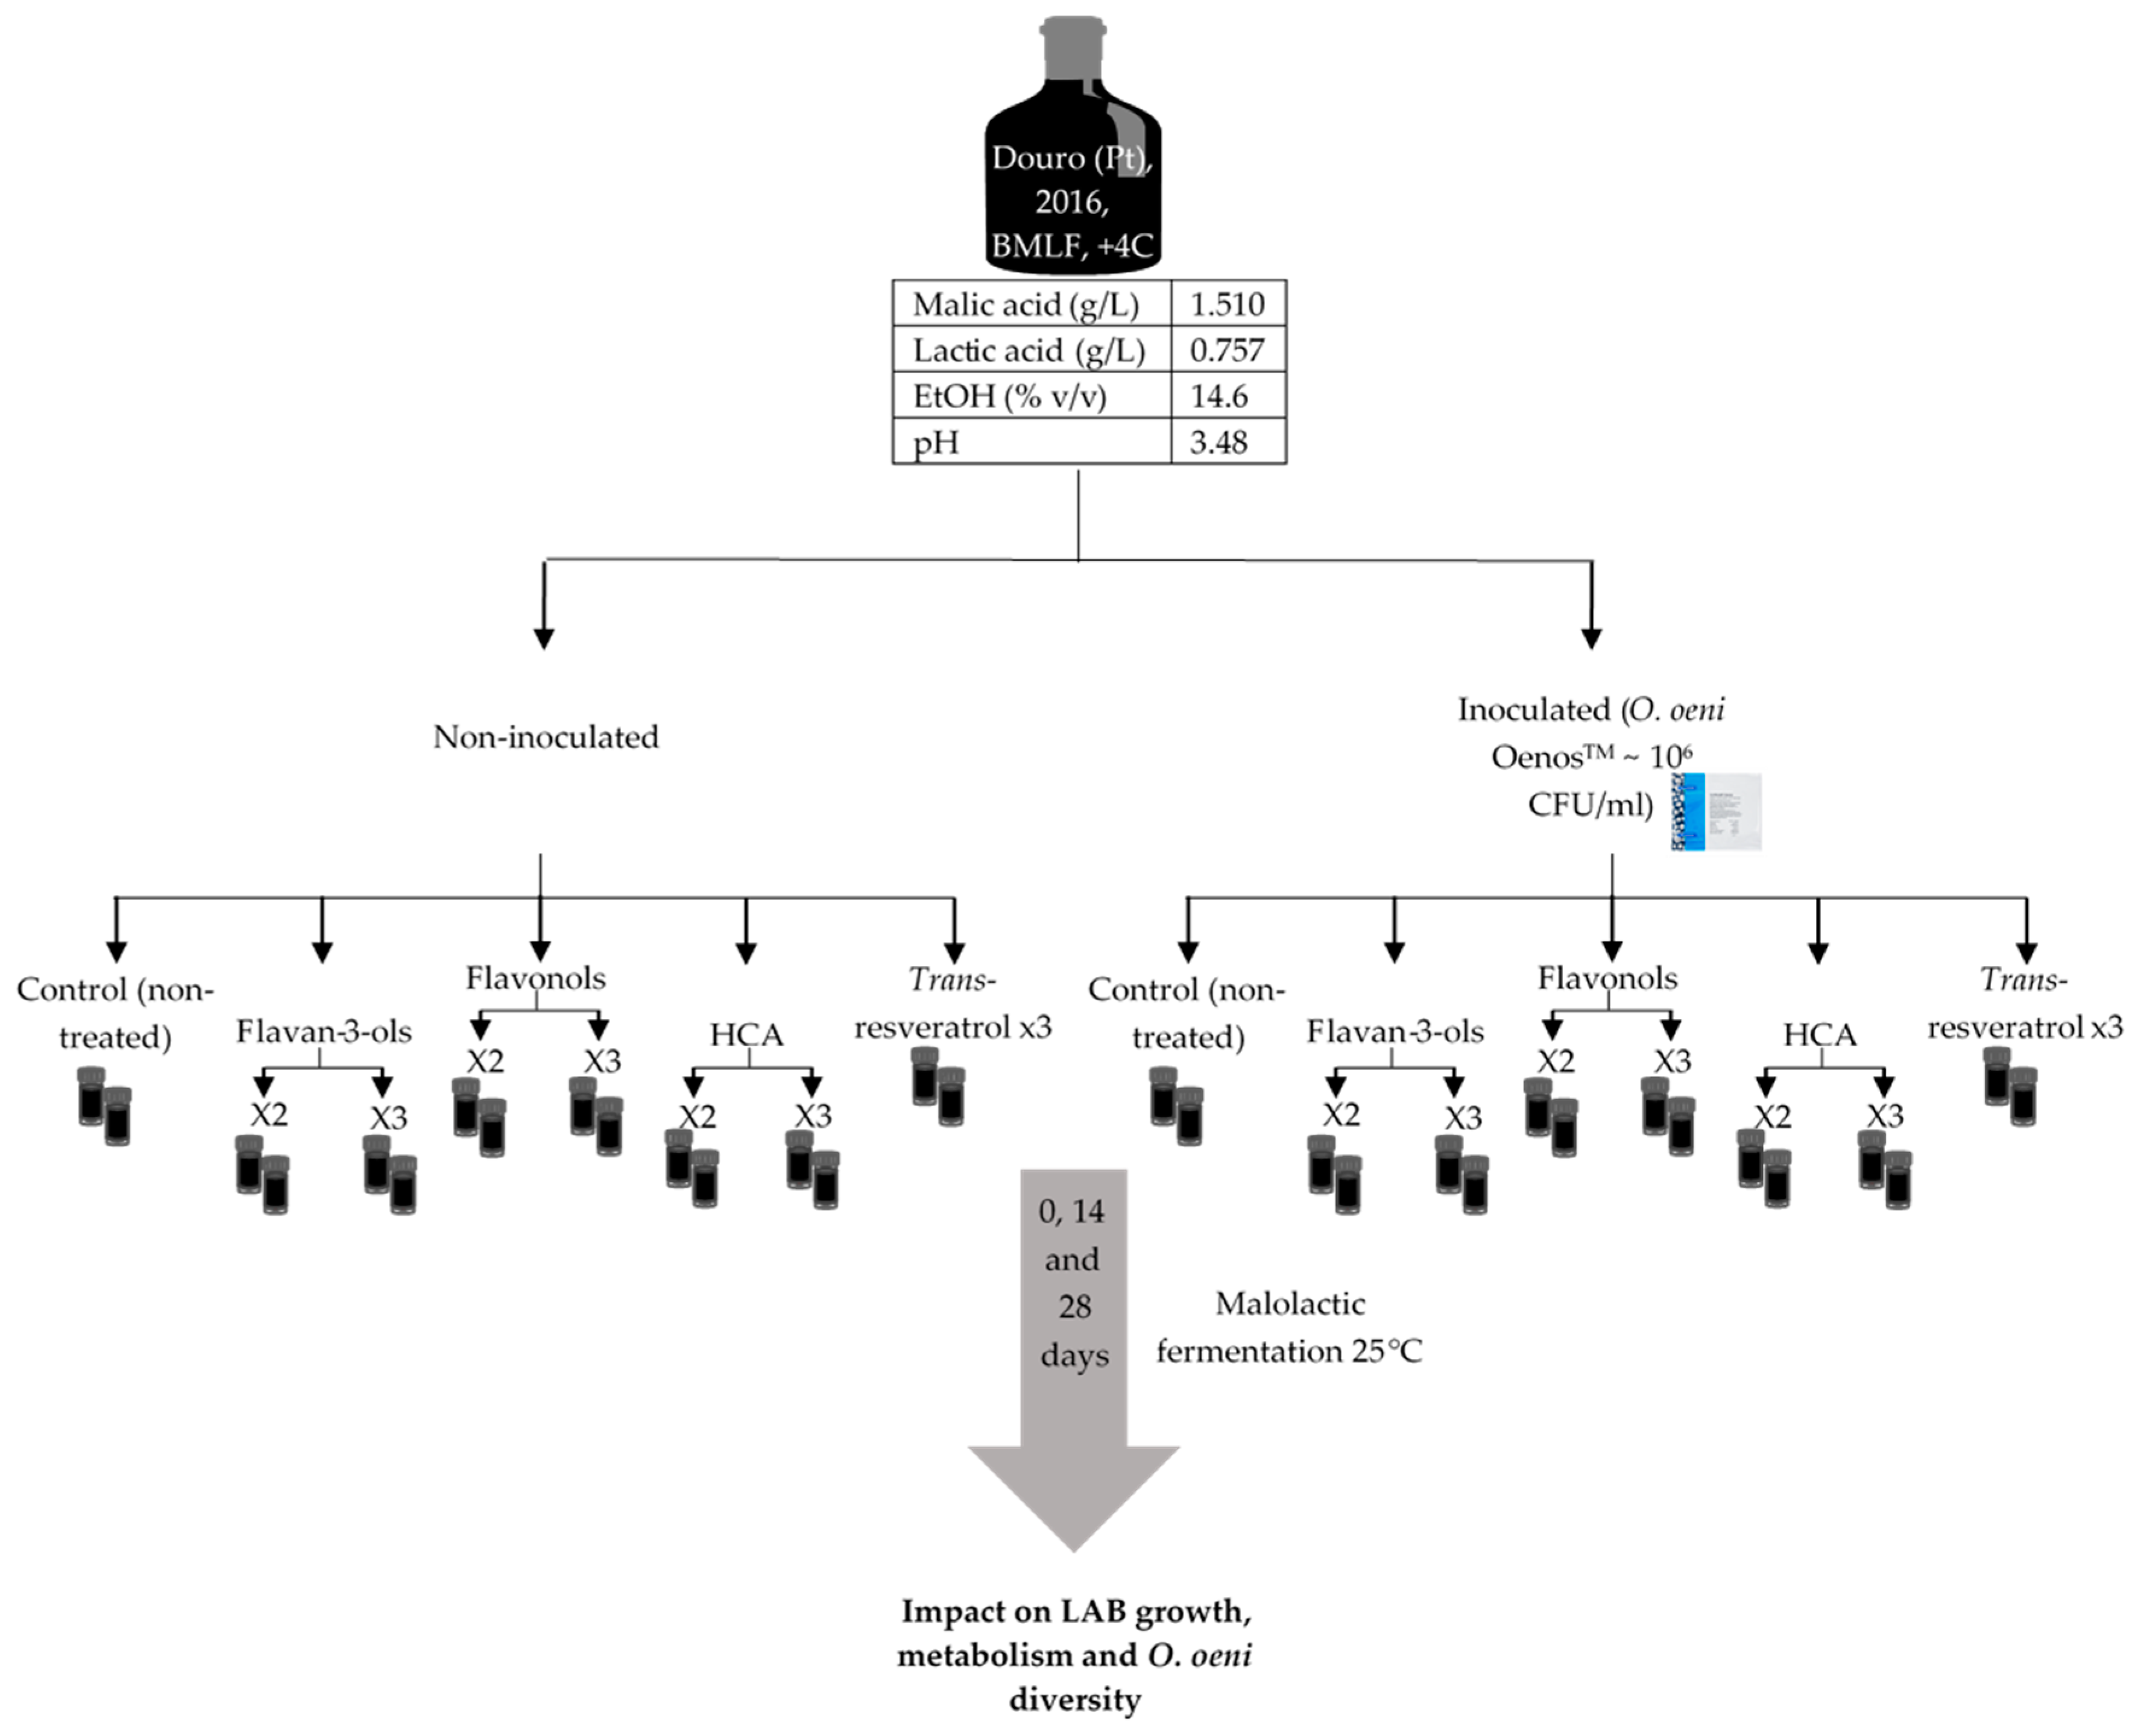
4.1. Malolactic Fermentation Experiments in Red Wine

The red wine used for the experiment (14.6 % (v/v) alcohol, pH 3.48, 1.510 g/L malic acid and 0.757 g/L lactic acid) was a varietal wine from the Touriga Franca variety collected before malolactic fermentation in the Douro region in Northern Portugal from the 2016 harvest (stored at 4 °C before the initiation of the experiment). Touriga Franca is the most widely grown variety in the Douro Demarcated Region, normally being blended with other varieties for the still and fortified wines of the region. The wine used had been through a spontaneous (non-inoculated) alcoholic fermentation with no addition of SO2 at the end of fermentation.
Inoculated and non-inoculated MLF experiments were carried out in parallel. The LAB population at the beginning of these fermentations were ~104 CFU/mL. The commercial O. oeni strain Viniflora Oenos™ from Ch. Hansen (Hørsholm, Denmark) was directly inoculated into the wine at an initial concentration of 106 CFU/mL.
Flavan-3-ols ((+)-catechin hydrate, purity = 99% and (-)-epicatechin, purity = 90%), flavonols (kaempferol and quercetin, purity > 99%), hydroxycinnamic acids (trans-p-coumaric acid, purity = 98% and trans-ferulic acid, purity = 99%) and trans-resveratrol (purity = 99%), obtained from Sigma-Aldrich (Steinheim, Germany), were previously dissolved in ethanol before being added into the treated wines. The initial concentrations of these compounds in the wine ((+)-catechin 28.34 ± 1.05 mg/L; (−)-epicatechin 12.60 ± 0.51 mg/L; kaempferol 1.84 ± 0.08 mg/L; quercetin 3.19 ± 0.25 mg/L; trans-p-coumaric acid 0.53 ± 0.07 mg/L; trans-ferulic acid 0.16 ± 0.11 mg/L; trans-resveratrol 1.30 ± 0.11 mg/L) were doubled (×2) and tripled (×3), to mimic pre-fermentation variations, with values within the ranges encountered in real wine situations (Table 4). All treated wines were compared to the non-treated (control) ones.
MLF experiments were conducted in laboratory-scale, sterile conditions, in 50 mL flasks (Figure 3). Control wines and wines containing phenolic compounds, all in duplicate, were incubated at 25 °C in the dark with no agitation. During the incubation, the wine contents of l-malic acid and l-lactic acid were monitored by HPLC-UV-RI (High performance liquid chromatography with ultraviolet and refractive index detection). MLF was considered finished when l-malic acid was no longer detectable (nominal detection limit = 0.16 g/L). At the beginning of MLF—prior to the addition of phenolics, 14 and 28 days after, a 100 µL sample of each assay was collected and directly diluted for plating. Another 1 mL volume of sample was kept in a commercial freezer (−20 °C) for metabolite analysis.

4.2. Sugars and Organic Acids Determination

The analytical methods used have been previously employed in the authors’ laboratory and have been proven to be robust and accurate for this type of matrix [34]. Organic acids (citric acid, acetic acid, malic acid, lactic acid), and sugars (glucose, fructose) were analyzed by HPLC-UV-RI, with a UV detector at 210 nm (K-2501) and a refraction index (RI) detector (K-2301), both from KNAUER (Berlin, Germany). The column used was an Aminex HPX-87H 300 × 7.8 mm from Bio-Rad laboratories (Hercules, California, CA, USA) at a temperature of 55 °C, and the mobile phase a solution of sulfuric acid 2.5 mM at a flow-rate of 0.5 mL/min. Samples were analyzed in duplicate, diluted five times, and syringe-filtered (with a 0.45 µm cellulose acetate filter) before injection (20 μL).

4.3. LAB Quantification, Isolation, and Identification

Wine samples were diluted and plated on MRS (de Man, Rogosa & Sharpe) medium from BIOKAR Diagnostics (Allonne, France) supplemented with 5% (v/v) absolute ethanol from Carlo Erba (Val-de-Reuil, France), 10 mg/L cycloheximide (Sigma-Aldrich, Steinheim, Germany) and 2% (w/w) agar from Liofilchem (Roseto degli Abruzzi, Italy), with a pH adjusted to 4.5 with a 12 M hydrochloric acid solution. Plates were incubated at 25 °C for 8–10 days. Lactic acid bacteria counts were made by the drop-count technique [49]. For the non-treated wines and the wines treated with 2× flavonols and trans-resveratrol, 10 isolated colonies were randomly chosen from each sample plates at the beginning of the MLF, and 28 days after its initiation. Isolates were sub-cultured onto the same medium for purification. Each pure colony was then grown in liquid MRS medium, with the same composition but without agar, and stored at −80 °C with 30% (v/v) glycerol (Sigma-Aldrich, Germany) before molecular analysis. The 80 isolated LAB strains were initially identified as O. oeni form their appearance under microscope (observed at ×1000 magnification).

4.4. Commercial LAB Strains

Seven commercial O. oeni strains: OenosTM, CH11TM, CH16TM, CH35TM, CiNeTM (Ch. Hansen, Denmark) as well as AlphaTM and VP41TM from Lallemand (Montreal, QC, Canada) were used in this study to optimize the REA-PFGE protocol, and as a comparison with the indigenous strains. The bacteria were added at 106 CFU/mL for growth in the same liquid medium, as for the isolated strains having previously been re-suspended into peptone water (10 g peptone, 5 g NaCl in 1 L H2O, pH 7.2).

4.5. REA-PFGE

The REA-PFGE protocol described by García-Ruiz et al. [13] was followed with some slight modifications. Except where otherwise stated, all liquid were grown without agitation at 25 °C. Pre-cultures of 2 mL in MRS broth, were made for each strain from stock cultures and grown for seven days. The fresh cultures used for digestion and electrophoresis were prepared by inoculating 4 mL of MRS medium with 40 µL (1% v/v) of the pre-cultures and growing these for six days to reach an absorbance of approximately 0.5 at a 600 nm wavelength, as measured in an UV/VIS UNICAM 8620 spectrophotometer (UNICAM, Cambridge, UK). Cells were harvested by centrifugation (5 min, 10,000 g at room temperature), the supernatant discarded and the pellets washed twice with 1 mL of 1 × TE (10 mM Tris-HCl, 1 mM EDTA, pH 8) before being resuspended in 200 µL of T100E (10 mM Tris-HCl, 100 mM EDTA, pH 8). The cell suspensions were mixed with an equal volume of 1% (w/v) SeaKemTM Gold Agarose (Lonza, Switzerland), which was pre-melted and kept at 60 °C. PFGE molds were filled with the mixtures to obtain three plugs per strain, and the plugs were let to solidify 20 min at room temperature. Cells embedded in the agarose plugs were lysed for 3 hr at 37 °C in 1 mL lysozyme (10 mg/mL buffer) (Thermo Fisher Scientific, Waltham, MA, USA). The lysis buffer was replaced with 1 mL of 2 mg/mL Pronase E/1.5% N-lauryl sarcosyl buffer in T100E (Pronase E from Streptomyces griseus, Sigma-Aldrich), and incubated for 16 h at 37 °C. The plugs were rinsed four times for 30 min with 4 mL 1 × TE in a shaking water bath set at 55 °C. The 5 mL tubes containing the plugs were filled with 5 mL 1 × TE and stored at 4 °C before restriction enzyme digestion. A half-plug of each strain was digested with 20 U NotI restriction endonuclease (10 U/mL, Thermo Fisher Scientific) in a volume of 200 µL for 16 hr at 37 °C. As a size marker and normalization reference, plugs of Salmonella serotype Braenderup H98122 restricted with XbaI (10 U/mL, Thermo Fisher Scientific) 50 U 2 h/37 °C were prepared and kept at 4 °C before electrophoresis. Standards were placed in the gel every six lanes. The digested DNA fragments were separated by electrophoresis in a 1% SeaKemTM Gold Agarose in 3 L 0.5× TBE buffer (0.1 M Tris, 0.09 M boric acid, 0.01 M EDTA, pH 8) with a CHEF-DRIII apparatus (Bio-Rad). Electrophoresis was performed for 20 h at 15 °C, 6 V/cm, with interpolation pulse time of 2.5 s to 25 s, and an included angle of 120°. Gels were stained with ethidium bromide (0.7 mg/mL) and washed twice in deionized water, and images were taken using a Bio-Rad ChemiDoc™ MP System from Bio-Rad (Hercules, California, CA, USA). The fingerprint data were analyzed using BioNumerics 6 software. The Dice coefficient with 1% optimization and 2% band position tolerance settings and the clustering algorithm UPGMA were chosen to compare the PFGE profiles.

4.6. Statistical Analysis

Sugars and organic acids analyses in order to show the progression of the major metabolic alterations, experiments were performed in duplicate, and each sample was analyzed once. The reproducibility of the chromatographic analyses was assured by repeating the samples at the beginning, middle, and end of each analytical session, in all cases values were similar. Microbial counts were performed in triplicate on each sample taken. Data were subjected to statistical analysis using JMP13 for Windows XP, at a confidence level of 95% (p = 0.05). Dunnett´s test was run to compare the means of each sample relatively to the controls.

Supplementary Materials

Supplementary materials can be found at https://www.mdpi.com/2311-5637/5/1/1/s1.

Author Contributions

Conceptualization, I.C., F.M.C. and T.H.; Data curation, I.C. and F.M.C.; Formal analysis, I.C.; Funding acquisition, T.H.; Investigation, I.C.; Methodology, I.C.; Project administration, T.H.; Resources, T.H.; Supervision, F.M.C. and T.H.; Validation, F.M.C. and T.H.; Writing—original draft, I.C.; Writing—review & editing, F.M.C. and T.H.

Funding

This project has received funding from the European Union’s Horizon 2020 research and innovation programme under the Marie Sklodowska-Curie grant agreement No 643063—Microwine. We would also like to thank the scientific collaboration of CBQF under the FCT project UID/Multi/50016/2013.

Acknowledgments

We would like to thank Carla Maria Oliveira for her help with HPLC-UV-RI, Rui Magalhães for his technical assistance in performing the REA-PFGE work and Sofia Almeida Pereira for her explanations with the use of BioNumerics 6 software.

Conflicts of Interest

The authors declare no conflict of interest.

References

  1. Rammelsberg, M.; Müller, E.; Radler, F. Caseicin 80: Purification and characterization of a new bacteriocin from Lactobacillus casei. Arch. Microbiol. 1990, 154, 249–252. [Google Scholar] [CrossRef]
  2. Henick-Kling, T.; Stoewsand, G. Lead in wine. Am. J. Enol. Vitic. 1993, 44, 459–463. [Google Scholar]
  3. Mcdaniel, M.; Henderson, L.; Watson, J.R.; Heatherbell, D. Sensory panel training and screening for descriptive analysis of the aroma of Pinot Noir wine fermented by several strains of malolactic bacteria. Descr. Sens. Anal. Pract. 2008, 351. [Google Scholar] [CrossRef]
  4. Laurent, M.-H.; Henick-Kling, T.; Acree, T. Changes in the aroma and odor of Chardonnay wine due to malolactic fermentation. Weinwissenschaft 1994, 49, 3–10. [Google Scholar]
  5. Davis, C.; Wibowo, D.; Lee, T.; Fleet, G. Growth and metabolism of lactic acid bacteria during and after malolactic fermentation of wines at different pH. Appl. Environ. Microbiol. 1986, 51, 539–545. [Google Scholar] [PubMed]
  6. El Khoury, M.; Campbell-Sills, H.; Salin, F.; Guichoux, E.; Claisse, O.; Lucas, P.M. Biogeography of Oenococcus oeni reveals distinctive but non-specific populations in wine-producing regions. Appl. Environ. Microbiol. 2016. [Google Scholar] [CrossRef]
  7. Cafaro, C.; Bonomo, M.G.; Guerrieri, A.; Crispo, F.; Ciriello, R.; Salzano, G. Assessment of the genetic polymorphism and physiological characterization of indigenous Oenococcus oeni strains isolated from Aglianico del Vulture red wine. Folia Microbiol. 2016, 61, 1–10. [Google Scholar] [CrossRef]
  8. Breniaux, M.; Dutilh, L.; Petrel, M.; Gontier, E.; Campbell-Sills, H.; Deleris-Bou, M.; Reguant, C. Adaptation of two groups of Oenococcus oeni strains to red and white wines: The role of acidity and phenolic compounds. J. Appl. Microbiol. 2018. [Google Scholar] [CrossRef]
  9. Bridier, J.; Claisse, O.; Coton, M.; Coton, E.; Lonvaud-Funel, A. Evidence of distinct populations and specific subpopulations within the species Oenococcus oeni. Appl. Environ. Microbiol. 2010, 76, 7754–7764. [Google Scholar] [CrossRef]
  10. Campbell-Sills, H.; El Khoury, M.; Favier, M.; Romano, A.; Biasioli, F.; Spano, G.; Coton, M. Phylogenomic analysis of Oenococcus oeni reveals specific domestication of strains to cider and wines. Genome Biol. Evol. 2015, 7, 1506–1518. [Google Scholar] [CrossRef]
  11. Campbell-Sills, H.; Lorentzen, M.; Lucas, P.M. Genomic Evolution and Adaptation to Wine of Oenococcus oeni. In Biology of Microorganisms on Grapes, in Must and in Wine; Springer: Cham, Switzerland, 2017; pp. 457–468. [Google Scholar]
  12. del Carmen Portillo, M.; Mas, A. Analysis of microbial diversity and dynamics during wine fermentation of Grenache grape variety by high-throughput barcoding sequencing. LWT-Food Sci. Technol. 2016, 72, 317–321. [Google Scholar] [CrossRef]
  13. García-Ruiz, A.; Tabasco, R.; Requena, T.; Claisse, O.; Lonvaud-Funel, A.; Bartolomé, B.; Moreno-Arribas, M.V. Genetic diversity of Oenoccoccus oeni isolated from wines treated with phenolic extracts as antimicrobial agents. Food Microbiol. 2013, 36, 267–274. [Google Scholar] [CrossRef] [PubMed] [Green Version]
  14. Petri, A.; Pfannebecker, J.; Fröhlich, J.; König, H. Fast identification of wine related lactic acid bacteria by multiplex PCR. Food Microbiol. 2013, 33, 48–54. [Google Scholar] [CrossRef] [PubMed]
  15. López, I.; Torres, C.; Ruiz-Larrea, F. Genetic typification by pulsed-field gel electrophoresis (PFGE) and randomly amplified polymorphic DNA (RAPD) of wild Lactobacillus plantarum and Oenococcus oeni wine strains. Eur. Food Res. Technol. 2008, 227, 547–555. [Google Scholar] [CrossRef]
  16. Claisse, O.; Lonvaud-Funel, A. Development of a multilocus variable number of tandem repeat typing method for Oenococcus oeni. Food Microbiol. 2012, 30, 340–347. [Google Scholar] [CrossRef] [PubMed]
  17. Sacchi, K.L.; Bisson, L.F.; Adams, D.O. A review of the effect of winemaking techniques on phenolic extraction in red wines. Am. J. Enol. Vitic. 2005, 56, 197–206. [Google Scholar]
  18. Del Llaudy, M.C.; Canals, R.; Canals, J.M.; Zamora, F. Influence of ripening stage and maceration length on the contribution of grape skins, seeds and stems to phenolic composition and astringency in wine-simulated macerations. Eur. Food Res. Technol. 2008, 226, 337–344. [Google Scholar] [CrossRef]
  19. Setford, P.C.; Jeffery, D.W.; Grbin, P.R.; Muhlack, R.A. Factors affecting extraction and evolution of phenolic compounds during red wine maceration and the role of process modelling. Trends Food Sci. Technol. 2017, 69, 106–117. [Google Scholar] [CrossRef]
  20. Olejar, K.J.; Fedrizzi, B.; Kilmartin, P.A. Influence of harvesting technique and maceration process on aroma and phenolic attributes of Sauvignon blanc wine. Food Chem. 2015, 183, 181–189. [Google Scholar] [CrossRef]
  21. Caridi, A.; Sidari, R.; Giuffrè, A.M.; Pellicanò, T.M.; Sicari, V.; Zappia, C.; Poiana, M. Test of four generations of Saccharomyces cerevisiae concerning their effect on antioxidant phenolic compounds in wine. Eur. Food Res. Technol. 2017, 243, 1287–1294. [Google Scholar] [CrossRef]
  22. Monagas, M.; Bartolomé, B.; Gómez-Cordovés, C. Updated knowledge about the presence of phenolic compounds in wine. Crit. Rev. Food Sci. Nutr. 2005, 45, 85–118. [Google Scholar] [CrossRef] [PubMed]
  23. Hernández, T.; Estrella, I.; Carlavilla, D.; Martín-Álvarez, P.J.; Moreno-Arribas, M.V. Phenolic compounds in red wine subjected to industrial malolactic fermentation and ageing on lees. Anal. Chim. Acta 2006, 563, 116–125. [Google Scholar] [CrossRef]
  24. Bouzanquet, Q.; Barril, C.; Clark, A.C.; Dias, D.A.; Scollary, G.R. A novel glutathione-hydroxycinnamic acid product generated in oxidative wine conditions. J. Agric. Food Chem. 2012, 60, 12186–12195. [Google Scholar] [CrossRef] [PubMed]
  25. Lima, A.; Oliveira, C.; Santos, C.; Campos, F.M.; Couto, J.A. Phenolic composition of monovarietal red wines regarding volatile phenols and its precursors. Eur. Food Res. Technol. 2018, 244, 1985–1994. [Google Scholar] [CrossRef]
  26. Burns, J.; Gardner, P.T.; O’Neil, J.; Crawford, S.; Morecroft, I.; McPhail, D.B.; Lean, M.E. Relationship among antioxidant activity, vasodilation capacity, and phenolic content of red wines. J. Agric. Food Chem. 2000, 48, 220–230. [Google Scholar] [CrossRef] [PubMed]
  27. Hasan, M.; Bae, H. An overview of stress-induced resveratrol synthesis in grapes: Perspectives for resveratrol-enriched grape products. Molecules 2017, 22, 294. [Google Scholar] [CrossRef] [PubMed]
  28. Rozès, N.; Arola, L.; Bordons, A. Effect of phenolic compounds on the co-metabolism of citric acid and sugars by Oenococcus oeni from wine. Lett. Appl. Microbiol. 2003, 36, 337–341. [Google Scholar] [CrossRef] [Green Version]
  29. Campos, F.M.; Couto, J.A.; Figueiredo, A.R.; Tóth, I.V.; Rangel, A.O.; Hogg, T.A. Cell membrane damage induced by phenolic acids on wine lactic acid bacteria. Int. J. Food Microbiol. 2009, 135, 144–151. [Google Scholar] [CrossRef] [Green Version]
  30. Stead, D. The effect of hydroxycinnamic acids on the growth of wine-spoilage lactic acid bacteria. J. Appl. Bacteriol. 1993, 75, 135–141. [Google Scholar] [CrossRef]
  31. Campos, F.; Couto, J.; Hogg, T. Influence of phenolic acids on growth and inactivation of Oenococcus oeni and Lactobacillus hilgardii. J. Appl. Microbiol. 2003, 94, 167–174. [Google Scholar] [CrossRef] [Green Version]
  32. Bloem, A.; Bertrand, A.; Lonvaud-Funel, A.; De Revel, G. Vanillin production from simple phenols by wine-associated lactic acid bacteria. Lett. Appl. Microbiol. 2007, 44, 62–67. [Google Scholar] [CrossRef] [PubMed]
  33. Harris, V.; Jiranek, V.; Ford, C.M.; Grbin, P.R. Inhibitory effect of hydroxycinnamic acids on Dekkera spp. Appl. Microbiol. Biotechnol. 2010, 86, 721–729. [Google Scholar] [CrossRef] [PubMed]
  34. Campos, F.M.; Figueiredo, A.R.; Hogg, T.A.; Couto, J.A. Effect of phenolic acids on glucose and organic acid metabolism by lactic acid bacteria from wine. Food Microbiol. 2009, 26, 409–414. [Google Scholar] [CrossRef] [PubMed] [Green Version]
  35. Devi, A.; Anu-Appaiah, K. Diverse physiological and metabolic adaptations by Lactobacillus plantarum and Oenococcus oeni in response to the phenolic stress during wine fermentation. Food Chem. 2018, 268, 101–109. [Google Scholar] [CrossRef] [PubMed]
  36. Vaquero, M.R.; Alberto, M.; de Nadra, M.M. Antibacterial effect of phenolic compounds from different wines. Food Control 2007, 18, 93–101. [Google Scholar] [CrossRef]
  37. Harborne, J.B.; Williams, C.A. Flavone and flavonol glycosides. In The Flavonoids; Springer: Berlin/Heidelberg, Germany, 1988; pp. 303–328. [Google Scholar]
  38. Treutter, D. Significance of flavonoids in plant resistance: A review. Environ. Chem. Lett. 2006, 4, 147. [Google Scholar] [CrossRef]
  39. Alberto, M.R.; Farías, M.E.; de Nadra, M.C.M. Effect of gallic acid and catechin on Lactobacillus hilgardii 5w growth and metabolism of organic compounds. J. Agric. Food Chem. 2001, 49, 4359–4363. [Google Scholar] [CrossRef]
  40. Reguant, C.; Bordons, A.; Arola, L.; Rozes, N. Influence of phenolic compounds on the physiology of Oenococcus oeni from wine. J. Appl. Microbiol. 2000, 88, 1065–1071. [Google Scholar] [CrossRef]
  41. de Llano, D.G.; Gil-Sánchez, I.; Esteban-Fernández, A.; Ramos, A.M.; Cueva, C.; Moreno-Arribas, M.; Bartolomé, B. Some Contributions to the Study of Oenological Lactic Acid Bacteria through Their Interaction with Polyphenols. Beverages 2016, 2, 27. [Google Scholar] [CrossRef]
  42. Pastorkova, E.; Zakova, T.; Landa, P.; Novakova, J.; Vadlejch, J.; Kokoska, L. Growth inhibitory effect of grape phenolics against wine spoilage yeasts and acetic acid bacteria. Int. J. Food Microbiol. 2013, 161, 209–213. [Google Scholar] [CrossRef]
  43. García-Ruiz, A.; Moreno-Arribas, M.V.; Martín-Álvarez, P.J.; Bartolomé, B. Comparative study of the inhibitory effects of wine polyphenols on the growth of enological lactic acid bacteria. Int. J. Food Microbiol. 2011, 145, 426–431. [Google Scholar] [CrossRef] [PubMed] [Green Version]
  44. García-Ruiz, A.; Bartolomé, B.; Cueva, C.; Martín-Álvarez, P.; Moreno-Arribas, M. Inactivation of oenological lactic acid bacteria (Lactobacillus hilgardii and Pediococcus pentosaceus) by wine phenolic compounds. J. Appl. Microbiol. 2009, 107, 1042–1053. [Google Scholar] [CrossRef] [PubMed]
  45. Hernandez, T.; Estrella, I.; Pérez-Gordo, M.; Alegría, E.; Tenorio, C.; Ruiz-Larrrea, F.; Moreno-Arribas, M. Contribution of malolactic fermentation by Oenococcus oeni and Lactobacillus plantarum to the changes in the nonanthocyanin polyphenolic composition of red wine. J. Agric. Food Chem. 2007, 55, 5260–5266. [Google Scholar] [CrossRef] [PubMed]
  46. Zoechling, A.; Reiter, E.; Eder, R.; Wendelin, S.; Liebner, F.; Jungbauer, A. The flavonoid kaempferol is responsible for the majority of estrogenic activity in red wine. Am. J. Enol. Vitic. 2009, 60, 223–232. [Google Scholar]
  47. Komes, D.; Ulrich, D.; Ganic, K.K.; Lovric, T. Study of phenolic and volatile composition of white wine during fermentation and a short time of storage. VITIS-J. Grapevine Res. 2007, 46, 77–84. [Google Scholar]
  48. Rossouw, M.; Marais, J. The phenolic composition of south African Pinotage, Shiraz and Cabernet Sauvignon wines. S. Afr. J. Enol. Vitic. 2017, 25, 94–104. [Google Scholar] [CrossRef]
  49. Miles, A.; Misra, S.; Irwin, J. The estimation of the bactericidal power of the blood. J. Hyg. 1938, 38, 732–749. [Google Scholar] [CrossRef] [PubMed]
Figure 1. Bacterial concentrations (Log 10 of colony forming units) during 28 days of incubation in wine samples supplemented with phenolic compounds. (a) 2× Flavan-3-ols; (b) 2× Flavan-3-ols; (c) 2× Flavonols; (d) 3× Flavonols; (e) 2× hydroxycinnamic acids (HCA); (f) 3× HCA; (g) trans-resveratrol. Plane lines—non-inoculated wines; dotted lines—wines inoculated with O. oeni Oenos™. (orange)—controls; (blue)—supplemented wines. Standard deviations for three replicates.
Fermentation 05 00001 g001
Figure 2. Dendrogram based on the NotI Pulsed-field gel electrophoresis of rare restriction enzyme digests (REA-PFGE) profiles of the 19 unrelated patterns of the 80 O. oeni strains isolated in this study, and seven commercial O. oeni strains.
Fermentation 05 00001 g002
Figure 3. Overall experimental process.
Fermentation 05 00001 g003
Table 1. Effect of phenolic compound addition on apparent sugar and organic acid metabolism of wine lactic acid bacteria (LAB) after 28 days of spontaneous malolactic fermentation (MLF).
TreatmentsFructose (g/L)Lactic Acid (g/L)Acetic Acid (g/L)
BeforeAfterBeforeAfterBeforeAfter
Control0.84 ± 0.04 y0.62 ± 0.06 0.78 ± 0.052.77 ± 0.03 0.26 ± 0.000.59 ± 0.02
2× Flavan-3-ols 0.51 ± 0.06 2.71 ± 0.00 0.69 ± 0.02
3× Flavan-3-ols 0.47 ± 0.02 2.76 ± 0.00 0.59 ± 0.02
2× Flavonols 0.49 ± 0.09 2.38 ± 0.12 0.59 ± 0.00
3× Flavonols 0.51 ± 0.01 2.39 ± 0.05 0.59 ± 0.00
2× HCA 0.46 ± 0.02 2.41 ± 0.17 0.59 ± 0.00
3× HCA 0.49 ± 0.02 2.29 ± 0.10 0.65 ± 0.02
Trans-resveratrol 0.41 ± 0.01 2.38 ± 0.07 0.69 ± 0.02
y values represent the mean ± SD.
Table 2. Effect of phenolic compounds addition on the apparent sugar and organic acids metabolism of wine LAB after 28 days of MLF, initiated by O. oeni Oenos™
TreatmentsCitric Acid (g/L)Fructose (g/L)Lactic Acid (g/L)Acetic Acid (g/L)
Before After hBeforeAfterBeforeAfterBeforeAfter
Control1.46 ± 0.07 ynd0.87 ± 0.020.41 ± 0.01 0.78 ± 0.032.66 ± 0.020.26 ± 0.010.72 ± 0.02
2× Flavan-3-ols 0.63 ± 0.08 0.47 ± 0.03 2.65 ± 0.00 0.71 ± 0.00
3× Flavan-3-ols 0.80 ± 0.21 0.50 ± 0.01 2.46 ± 0.10 0.71 ± 0.00
2× Flavonols 0.80 ± 0.37 0.52 ± 0.02 2.65 ± 0.00 0.71 ± 0.00
3× Flavonols 0.61 ± 0.10 0.49 ± 0.04 2.65 ± 0.00 0.71 ± 0.00
2× HCA 0.69 ± 0.05 0.42 ± 0.01 2.65 ± 0.00 0.71 ± 0.00
HCA ×3 0.93 ± 0.29 0.51 ± 0.02 2.65 ± 0.00 0.71 ± 0.00
Trans-resveratrol ×3 0.76 ± 0.26 0.42 ± 0.05 2.65 ± 0.00 0.71 ± 0.00
y values represent the mean ± SD; h citric acid consumed at end-stage MLF (d14). nd = not detectable (detection limit of citric acid = 0.15 g/L).
Table 3. Oenococcus oeni strains isolated from spontaneous and inoculated red wines fermented in the absence/presence of phenolic compounds: flavonols and trans-resveratrol.
Red WineTreatmentSampling Time (days)O. oeni IsolatedPFGE ProfileRed WineTreatmentSampling Time (days)O. oeni IsolatedPFGE ProfileCommercialized StrainsPFGE Profile
Non-inoculatedControl0WP201CNDInoculated Control0WP201ONDOenos™V
WP202CND WP202ONCH11™T
WP203CL WP203OLCH16™R
WP204CN WP204ODCH35™S
WP205CA WP205OECiNe™W
WP206CC WP206OCAlpha™P
WP207CB WP207OFVP41™U
WP208CL WP208OF
WP209CN WP209OC
WP210CC WP210OC
28WP266CM 28WP263OZ
WP267CL WP264OX
WP268CND WP265OV
WP269CM WP266OF
WP270CY WP267OL
WP271CN WP268OT
WP272CL WP269ON
WP273CJ WP270OL
WP274CL WP271OO
WP275CL WP272OND
Flavonols28WP294CL Flavonols28WP291OND
WP295CL WP292OJ
WP296CND WP293OL
WP297CP WP294OH
WP298CF WP295OF
WP299CM WP296OF
WP2100CK WP297OF
WP2101CF WP298OF
WP2102CG WP299OO
WP2103CO WP2100ON
Stilbene28WP2114CL Stilbene28WP2111OND
WP2115CM WP2112OND
WP2116CY WP2113OI
WP2117CF WP2114OI
WP2118CND WP2115OF
WP2119CN WP2116OF
WP2120CN WP2117OL
WP2121CF WP2118OY
WP2122CK WP2119OQ
WP2123CL WP2120OI
ND strains that did not grow when refreshed.
Table 4. Minimal and maximal concentrations (mg/L) in phenolic compounds in wines (during alcoholic fermentation, MLF, ageing, and in bottles) as reported in the literature *.
Phenolic CompoundsConcentrations (mg/L)
Bottled red wines (Zoechling et al. (2009)) [46]White wine during fermentation and short storage (Komes et al. (2007)) [47]Red wines during MLF (Hernandez et al. (2006)) [23]Red wines during ageing (Hernandez et al. (2006)) [23]Red wine inoculated with different O. oeni strains (Hernandez et al. (2007)) [45]Red wine (Rossouw et al. (2017)) [48]
MinMaxMinMaxMinMaxMinMaxMinMaxMinMax
Flavan-3-ols
(+)-catechin22.00141.701.843.0316.5419.827.1122.4411.5023.5041.8250.40
(−)-epicatechin7.5094.500.674.689.8911.353.1815.843.697.5329.9440.58
Flavonols
Quercetinnd7.40--14.0914.693.568.730.984.7211.1918.27
Kaempferolnd5.40--------2.583.60
HCA
Trans-p-coumaric acid1.306.600.342.630.7021.3410.0126.302.0616.017.3611.47
Trans-ferulic acid0.301.002.023.20--0.731.41nd0.84--
Stilbene
Trans-resveratrol0.073.95--0.591.01nd0.790.635.25--
Min: minimum; Max: maximum; nd: not detectable; -: not quantified in the referred literature. * [23,45,46,47,48]

