1. Introduction
Estimation of the entropy rate of natural language is a challenge originally set up by Shannon [
1,
2]. The entropy rate quantifies the complexity of language, precisely the rate how fast the amount of information grows in our communication with respect to the text length. Today, the entropy rate provides an important target for data compression algorithms, where the speed of convergence of the compression rate to the entropy rate is an informative benchmark. Measuring the entropy rate is also the first step in answering what kind of a stochastic process can model generation of texts in natural language, an important question for many practical tasks of natural language engineering.
An important theoretical question concerning the entropy rate, which has also been noted in the domains of computational linguistics [
3] and speech processing [
4], is whether the entropy rate of human language is a strictly positive constant. The overwhelming evidence collected so far suggests that it is so—in particular, the amount of information communicated per unit time in English text is generally agreed to be about 1 bpc (bit per character) [
2,
5,
6,
7,
8]. Although this is what we might intuitively expect, in 1990, Hilberg formulated a hypothesis that the entropy rate of natural language is zero [
9]. Zero entropy rate does not imply that the amount of information in texts is not growing, but that it grows with a speed slower than linear. Although Hilberg’s hypothesis may seem unlikely, the results of recent experiments concerning the scaling of maximal repetition in human language [
10] may be explained exactly by a hypothesis that the entropy rate is zero. Whereas zero entropy rate need not be the sole possible explanation of these experiments, it is advisable to perform another large scale experiment in which entropy rate would be estimated as precisely as possible.
Precise estimation of the entropy rate is a challenging task mainly because, mathematically speaking, the sought parameter is a limit for text length tending to infinity. To alleviate this problem, previous great minds proposed estimation methods based on human cognitive testing [
2,
5]. Since human testing is costly, however, such attempts remain limited in terms of the scale and number of tested languages. In contrast, although any conceivable data size can only be finite, today’s language data have become so large in scale that we may reconsider estimation of the entropy rate using big data computation. This point was already raised by [
1], which led to important previous works such as [
6] in the domain of computational linguistics. Both of these articles and many others that followed, however, mostly considered the English language only.
This article disproves Hilberg’s hypothesis by providing stronger empirical evidence that the entropy rate is positive. We investigate six languages using large, state-of-the-art 20 corpora of up to 7.8 gigabytes, across six languages: English, French, Russian, Korean, Chinese, and Japanese. We try to estimate the entropy rate by compressing these data sets using the standard PPM (Prediction by Partial Match) algorithm and extrapolating the data points with a new carefully selected ansatz function. Whereas a couple of ansatz functions were previously proposed in [
8,
9,
11,
12], here we introduce another function, which is a stretched exponential function and enjoys the same number of parameters as previous proposals. The new functions yields a smaller error of fit. As a result, we arrive at the entropy rate estimates which are approximately 20% smaller than without extrapolation, yet positive.
There remains something true in the original hypothesis of Hilberg, however. Hilberg [
9] seemed to suppose that complexity of natural language, as expressed by some parameters of the ansatz function, is approximately constant across different languages. Our experimental data confirm this statement. Our ansatz function has three parameters: the limiting entropy rate, a proportionality constant, and an exponent
β, which determines the speed of convergence of compression rate to the entropy rate. Although the entropy rate estimates depend on the kind of the script, the exponent
β turns out to be approximately constant across different languages. Thus, we suppose that this exponent is a language universal. Let us note that entropy rate quantifies how difficult it is to
predict the text once the optimal prediction scheme has been learned. In contrast, exponent
β quantifies how difficult it is to
learn to predict the text. Claiming constancy of exponent
β, we provide some evidence that despite huge typological differences, all languages are equally hard to learn.
We can legitimately ask whether language can be modeled as a stationary ergodic process, which is a precondition for statistical identifiability of a unique entropy rate and other parameters of the underlying stochastic process, such as the exponent
β. In report [
7] it was observed that different written sources in the the same literary language give rise to somewhat different entropy rates. In our paper, we will further confirm this observation. Thus natural language is somewhat nonergodic. Still, if we speak of statistics pertaining to universal coding, there seem to be some cross-linguistic and cross-textual universals, like the mentioned exponent
β. As we will see further in this paper, artificial random sources obey a different decay of the entropy rate estimates, so the constancy of exponent
β, reported in this paper, does say something about complexity of natural language.
The organization of the article is as follows: In
Section 2, we recall the notion of the entropy rate. In
Section 3, we discuss methods of entropy estimation. In
Section 4, we review the extrapolation functions.
Section 5 details our experimental procedure, whereas
Section 6 describes our experimental results.
Section 7 contains the concluding remarks.
2. Entropy Rate
Let
be a stochastic process, i.e., an infinite sequence of random variables
with each random variable
assuming values
, where
is a certain set of countably many symbols. For natural language, for instance,
can be a set of characters, whereas
is an infinite corpus of texts. Let
, where
, denote a finite subsequence
of
and let
denote a probability function of the subsequence
. The Shannon entropy of a finite subsequence
is defined as:
where sequences
are instances of
[
1]. In contrast, the entropy rate of the infinite sequence
X is defined as [
13]:
The entropy rate is the amount of information per element for the data length tending to infinity.
Let us note that the entropy rate quantifies the asymptotic growth of the number of possible values of an infinite sequence
. Roughly speaking, there are effectively only
possible values for a subsequence
, where
n is the sequence length. In other words, condition
is tantamount to an exponential growth of the number of possible sequences with respect to
n. Value
need not mean that the number of possibilities does not grow. For instance, for a sequence
whose number of possibilities grows like
, as supposed by Hilberg [
9], we have
. Although the number of possibilities for such a sequence of random variables grows quite fast, the speed of the growth cannot be properly measured by the entropy rate.
The entropy rate thus quantifies, to some extent, the degree of randomness or freedom underlying the text characters to follow one another. (To make things more subtle, the randomness quantified by the entropy of a sequence
is a sort of statistical randomness, which should be distinguished from algorithmic randomness of a sequence
, quantified by the Kolmogorov complexity. These two concepts are closely related, however. It can be shown that the rate of Kolmogorov complexity and the entropy rate are almost surely equal for any stationary ergodic process [
14].) For human languages, the occurrence of a linguistic element, such as a word or character, depends on the previous elements, and there are many long repetitions [
10]. This results in a lower value of the entropy rate than for a random sequence, but the ultimate degree of randomness in natural language is hard to simply guess. Whereas Hilberg [
9] supposed that
holds for natural language, this is only a minority view. According to the overwhelming experimental evidence the entropy of natural language is strictly positive [
2,
5,
6,
7,
8]. We may ask however whether these known estimates are credible. In fact, if convergence of
to the entropy rate is very slow, this need not be so. For this reason, while estimating the entropy rate, it is important to investigate the speed of the estimate convergence.
3. Direct Estimation Methods
There are several methods to estimate the entropy rate of natural language. These can be largely divided into methods based on human cognitive testing and methods based on machine computation. Estimation via human cognitive testing is mainly conducted by showing a substring of a text to a human examinee and having him or her guess the character to follow the substring. This method was introduced by Shannon [
2]. He tested an unmentioned number of examinees with the text of Dumas Malone’s “Jefferson the Virginian” and obtained
bpc. This method was improved by Cover and King [
5] as a sort of gambling. The results with 12 examinees produced an average of
bpc. Human cognitive testing has the advantage over methods based on machine computations that the estimates of entropy rate converge faster. Unfortunately, such human cognitive testing is costly, so the number of examinees involved is small and the samples are rather short. It is also unclear whether human examinees guess the text characters according to the true probability distribution.
In contrast, today, estimation of the entropy rate can be performed by big data computation. For this paradigm, we can mention the following specific approaches:
The first approach is to compress the text using a data compression algorithm. Let
denote the size in bits of text
after the compression. Then the code length per unit,
, is always larger than the entropy rate [
13],
We call
the encoding rate. In our application, we are interested in universal compression methods. A universal text compressor guarantees that the encoding rate converges to the entropy rate, provided that the stochastic process
is stationary and ergodic, i.e., equality
holds with probability 1.
The second approach is to estimate the probabilistic language models underlying formula (2). A representative classic work is [
6], who reported
bpc, by estimating the probability of trigrams in the Brown National Corpus.
Besides that, a bunch of different entropy estimation methods has been proposed in information theory. There are lower bounds of entropy such as the plug-in estimator [
15], there are estimators which work under assumption that the process is Markovian [
16,
17,
18], and there are a few other methods such as Context Tree Weighting [
15,
19].
In the following we will apply the first approach: since our data are very large, we are obliged to use efficient and reliable tools only, so we use some off-the-shelf programs that are thoroughly tested and can manage large scale data efficiently. Among important known universal compressors we can name: the Lempel-Ziv (LZ) code [
20], the PPM (Prediction by Partial Match) code [
21], and a wide class of grammar-based codes [
22], with many particular instances such as Sequitur [
23] and NSRPS (Non-Sequential Recursive Pair Substitution) [
12,
24]. Whereas all these codes are universal, they are not equal—being based on different principles. The LZ code and the grammar-based codes compress texts roughly by detecting repeated substrings and replacing them with shorter identifiers. A proof of universality of the LZ code can be found in [
13], whereas the proof of universality of grammar-based codes can be found in [
22]. In contrast, the PPM code is an
n-gram based language modeling method [
21] which applies variable length
n-grams and arithmetic coding. The PPM code is guaranteed to be universal when the length of the
n-gram is considered up to the length of the maximal repetition of the input text [
25,
26].
A very important question for our application is the scaling of the encoding rate of off-the-shelf implementations of universal codes for finite real data. Since the probabilistic model of natural language remains unknown, the notion of universality may serve only as a possible standard to obtain a stringent upper bound. One may raise some doubt that natural language is strictly stationary since the word frequencies exhibit formidable long-memory effects, as indicated, e.g., by [
27,
28,
29]. Moreover, many off-the-shelf compressors are not strictly universal, since they are truncated in various ways to gain the computational speed. Such truncations usually take form of a bounded traversing window length, so the respective compressors converge to the entropy of the traversing window rather than to the true entropy rate. Still, it is possible to implement a compressor that does not have this deficiency and there exist such off-the-shelf compressors. The simplest way to identify suitable compressors is by experimental inspection, excluding those for which the encoding rate is too large.
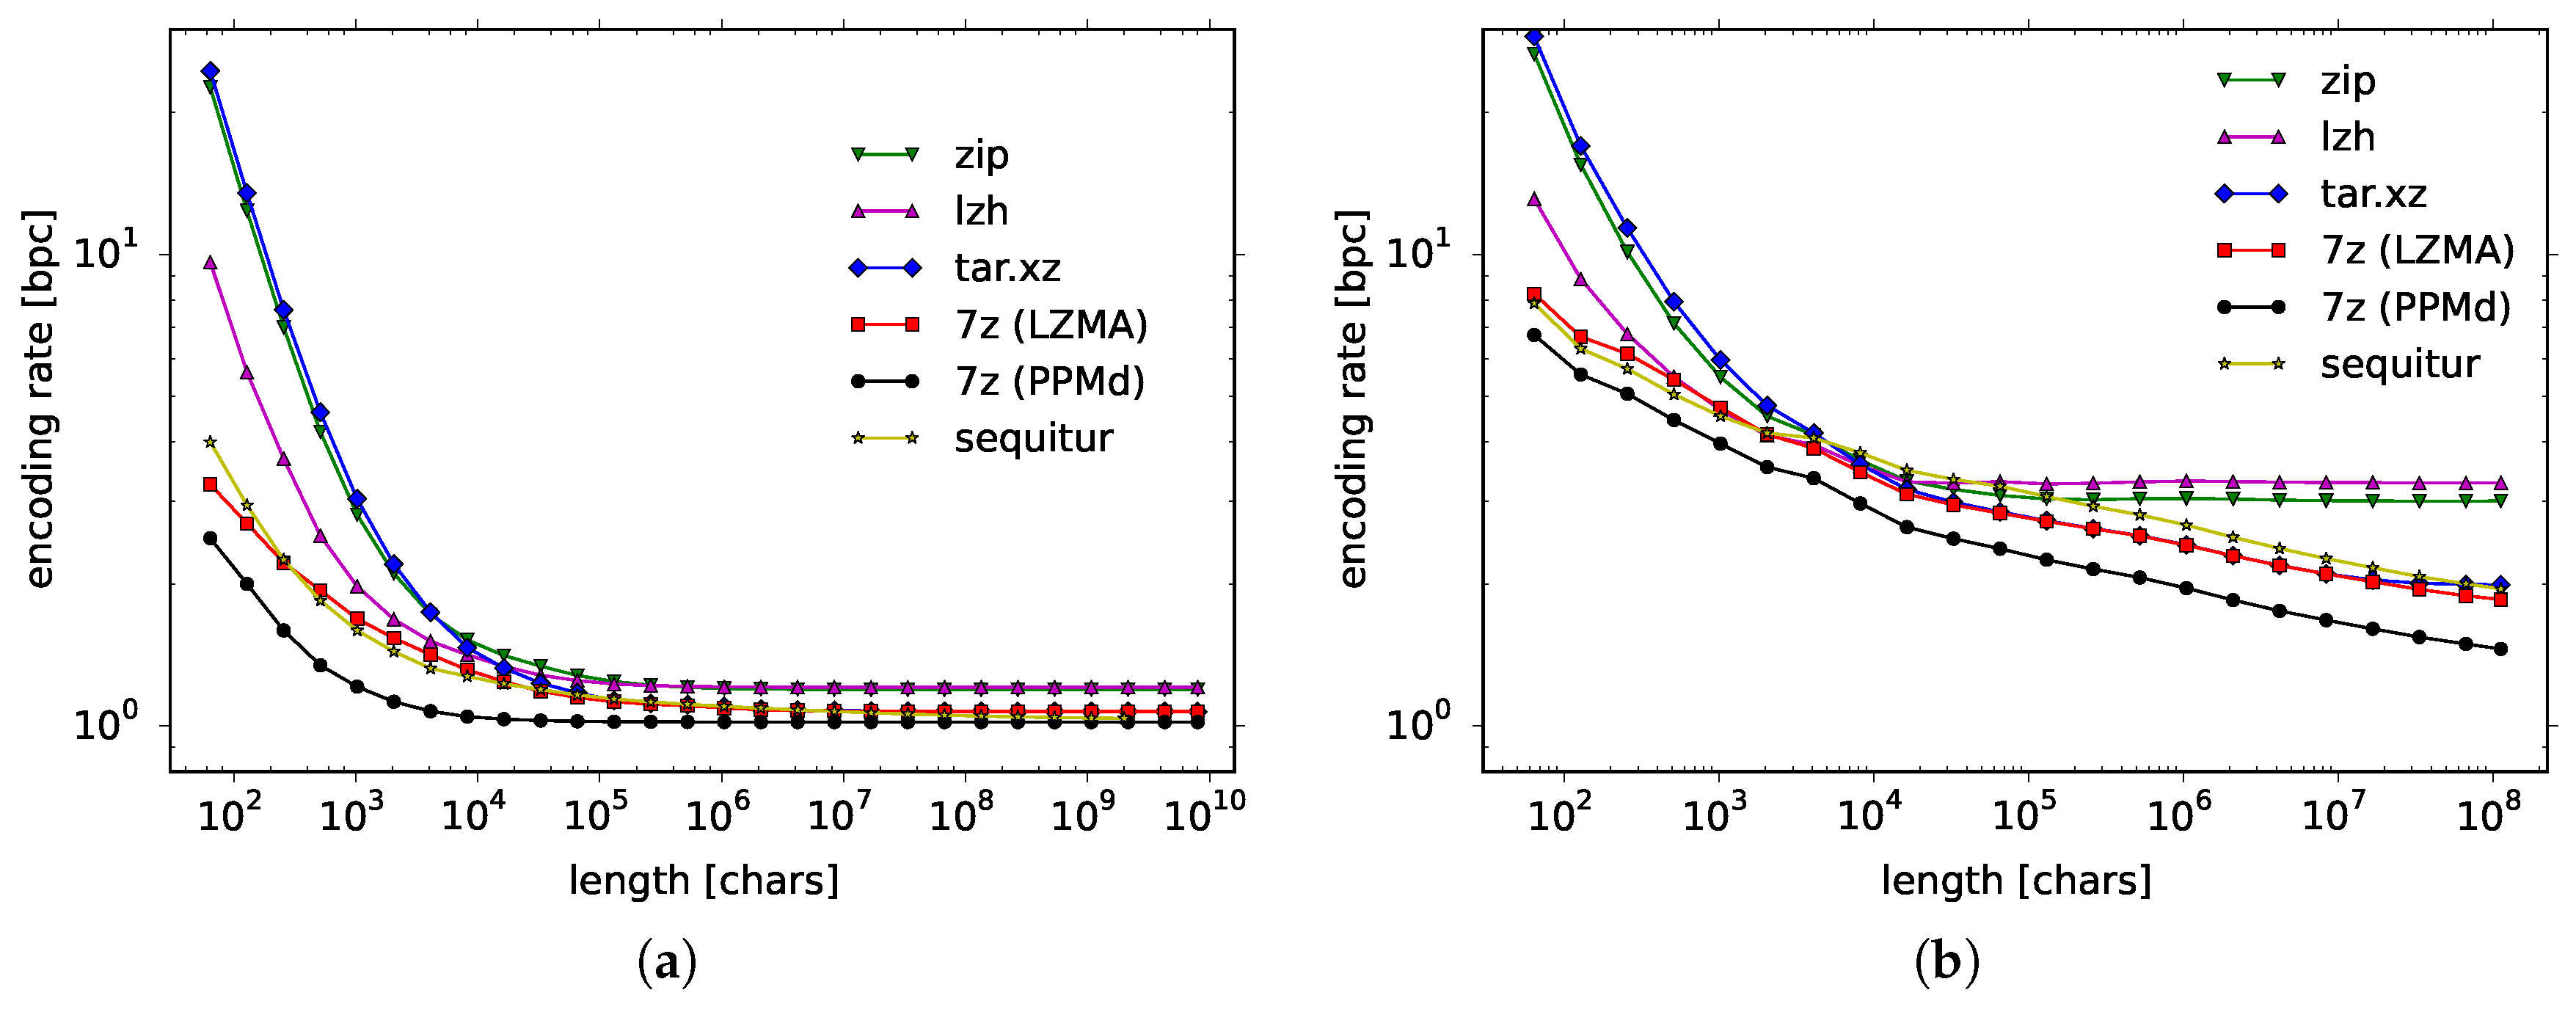
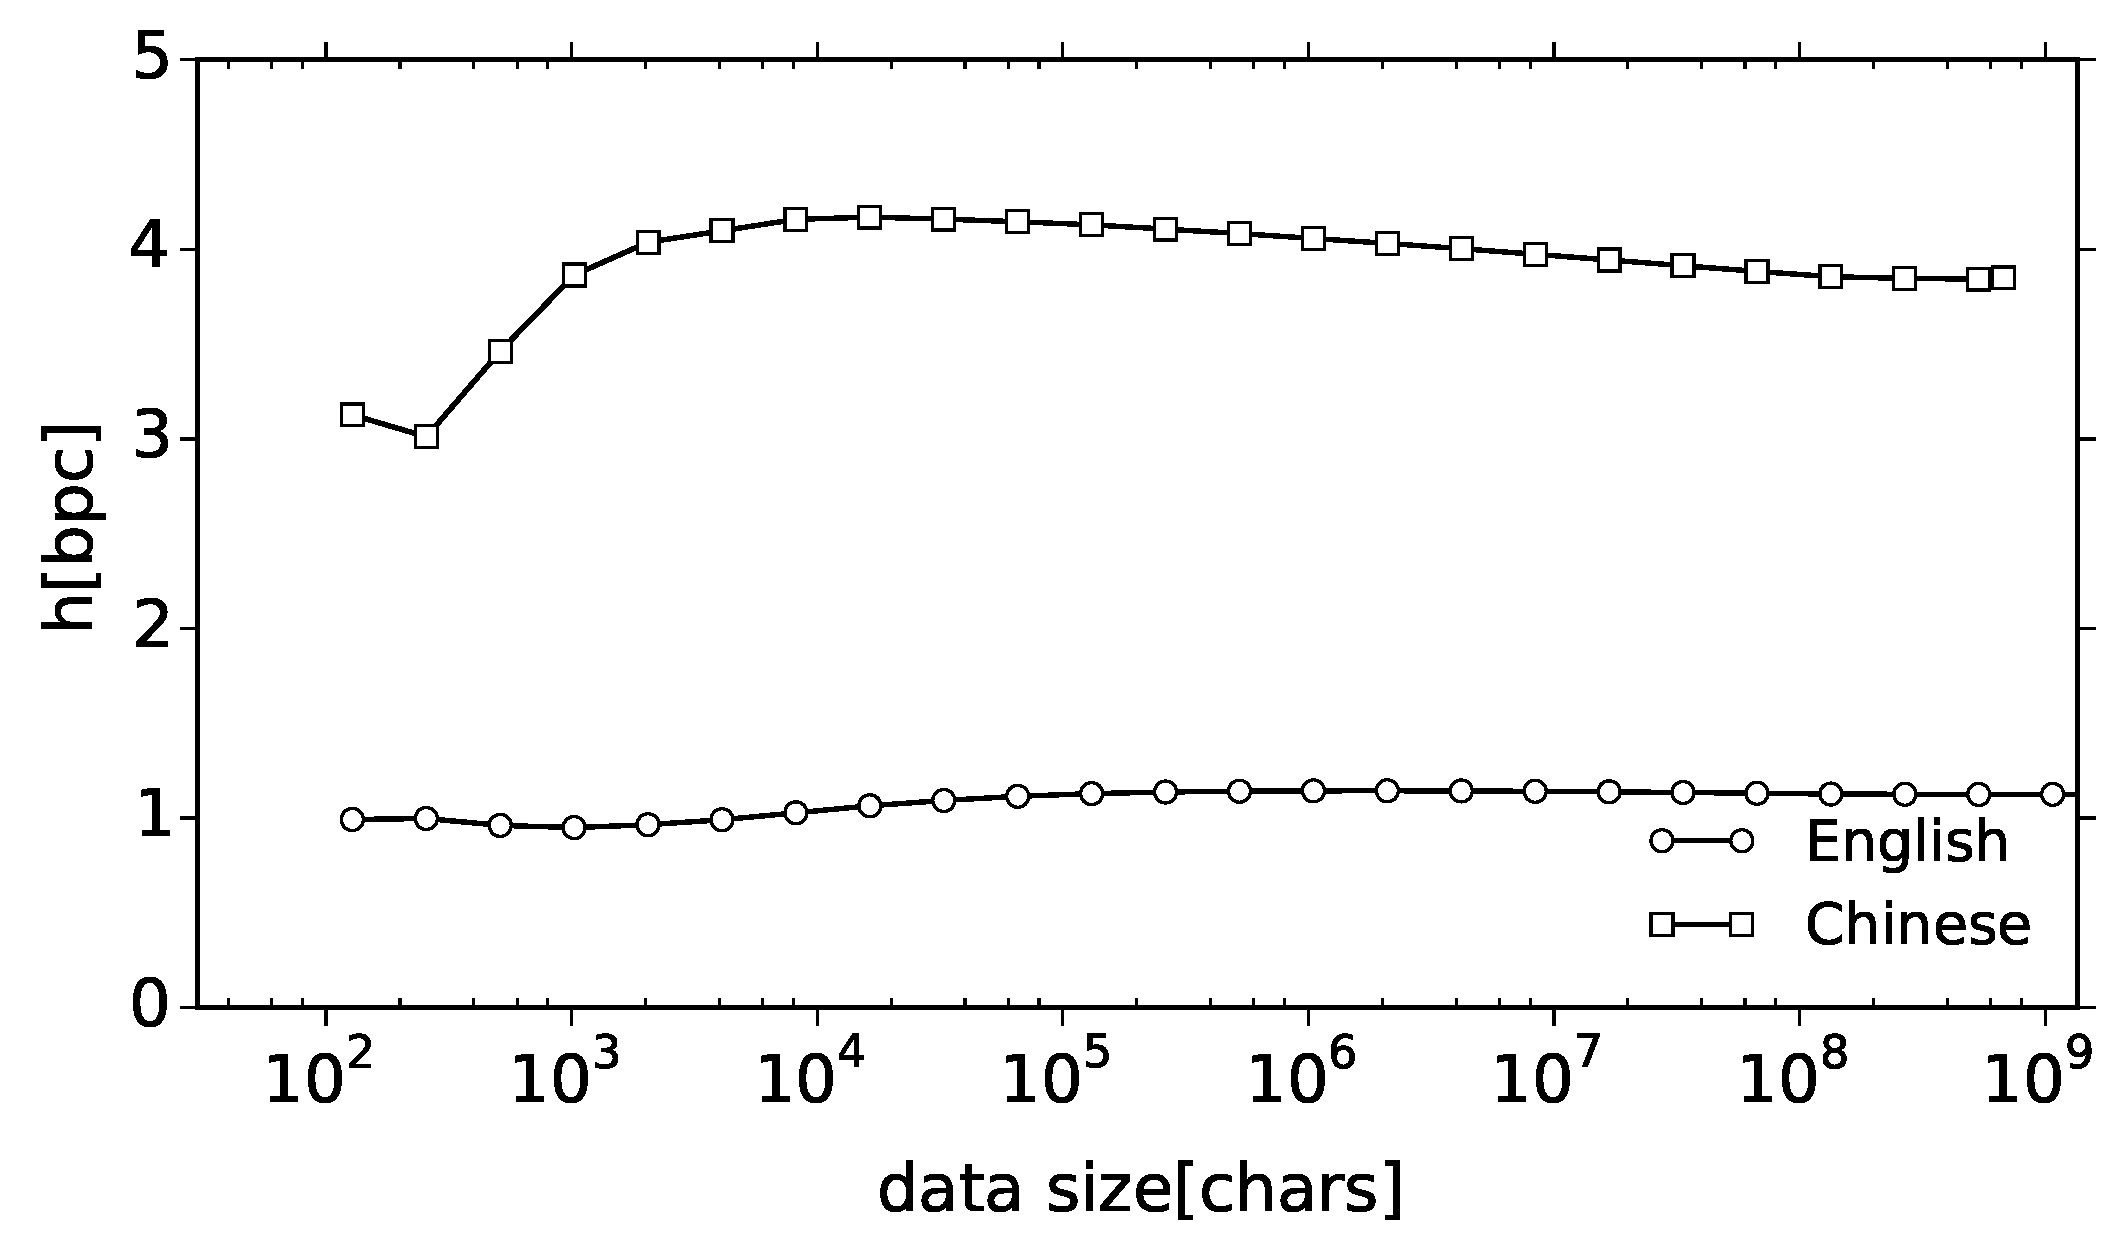
Among state-of-the-art compressors, we have considered zip, lzh, tar.xz, and 7-zip LZMA for the LZ methods and 7-zip PPMd for the PPM code. In
Figure 1 (right panel) we show how the encoding rate depends on the data length for a Bernoulli process with
(left panel, listed later in the first line of the third block of
Table 1) and for natural language data of Wall Street Journal corpus (right panel, listed in the third line of the third block of
Table 1). First, let us consider the Bernoulli process, which is a simple artificial source. Formally, the Bernoulli process is a sequence of independent random variables taking the value of 1 with probability
p and 0 with probability
. There are two known theoretical results for this process: The theoretically proven encoding rate of the LZ code is as much as
[
30], whereas the encoding rate for the PPM code is proved to be only
[
31,
32]. Thus the convergence is extremely slow for the LZ code and quite fast for the PPM code. This exactly can be seen in
Figure 1a, where all data points for the LZ code remain way above 1.0 bpc, the true entropy rate, while the data points for the PPM code practically converge to 1.0 bpc.
As for natural language data, whereas the empirical speed of convergence is much slower for the Wall Street Journal, the gradation of the compression algorithms remains the same. Algorithms such as zip and lzh get saturated probably because they are truncated in some way, whereas Sequitur, 7-zip LZMA and 7-zip PPMd gradually improve their compression rate the more data they read in. Since the encoding rate is visibly the smallest for 7-zip PPMd, in the following, we will use this compressor to estimate the entropy rate for other natural language data. Let us stress that we will be using an off-the-shelf compressor, 7-zip PPMd, since we are going to work with very large data and we need a computationally efficient and well-tested implementation of a universal code.
4. Extrapolation Functions
Many have attempted to estimate the entropy rate via compression. For example, paper [
21] reported
bpc for the collected works of Shakespeare in English. Majority of the previous works, however, reported only a single value of the encoding rate for the maximal size of the available data. Whereas any computation can handle only a finite amount of data, the true entropy rate is defined in formula (2) as a limit for infinite data. The later fact should be somehow taken into consideration, especially if convergence (4) is slow, which is the case of natural language. One way to fill this gap between the finite data and the infinite limit is to use extrapolation. In other words, the encoding rate
is calculated for many
n and the plots are extrapolated using some function
. One possibility could be to consider
in the form of polynomial series, but this does not describe the nature behind the problem in a functional form. Previously, function
has been considered so far in form of an ansatz, since the probabilistic model of natural language is unknown.
Previously, two ansatzes have been proposed, to the best of our knowledge. The first one was proposed by Hilberg [
9]. He examined the original paper of Shannon [
2], which gives a plot of some upper and lower bounds of
. Since Hilberg believed that the entropy rate vanishes,
, his ansatz was
with
, which apparently fits to the data by [
2], according to Hilberg. However, if we do not believe in a vanishing entropy rate, the above formula can be easily modified as
so that it converges to an arbitrary value of the entropy rate, cf., [
11]. Another ansatz was given in papers [
12] and [
8]. It reads
Using this ansatz, paper [
8] obtained
bpc for the collected works of Shakespeare and
bpc for the LOB corpus of English.
We have used up to 7.8 gigabytes of data for six different languages and quite many plots were available for fitting, as compared to previous works. As will be shown in
Section 6.2, function
does not fit well to our plots. Function
, however, is no more than
some ansatz. If we can devise another ansatz that fits better, then this should rather be used to estimate the entropy rate. In fact we have come across a better ansatz. The function we consider in this article is a stretched exponential function:
which embeds function
in an exponential function and yields the entropy rate
. In fact, function
converges to
h slower than
. In a way, this is desirable since slow convergence of the encoding rate is some general tendency of the natural language data. As a by-product, using function
we will obtain smaller estimates of the entropy rate than using function
.
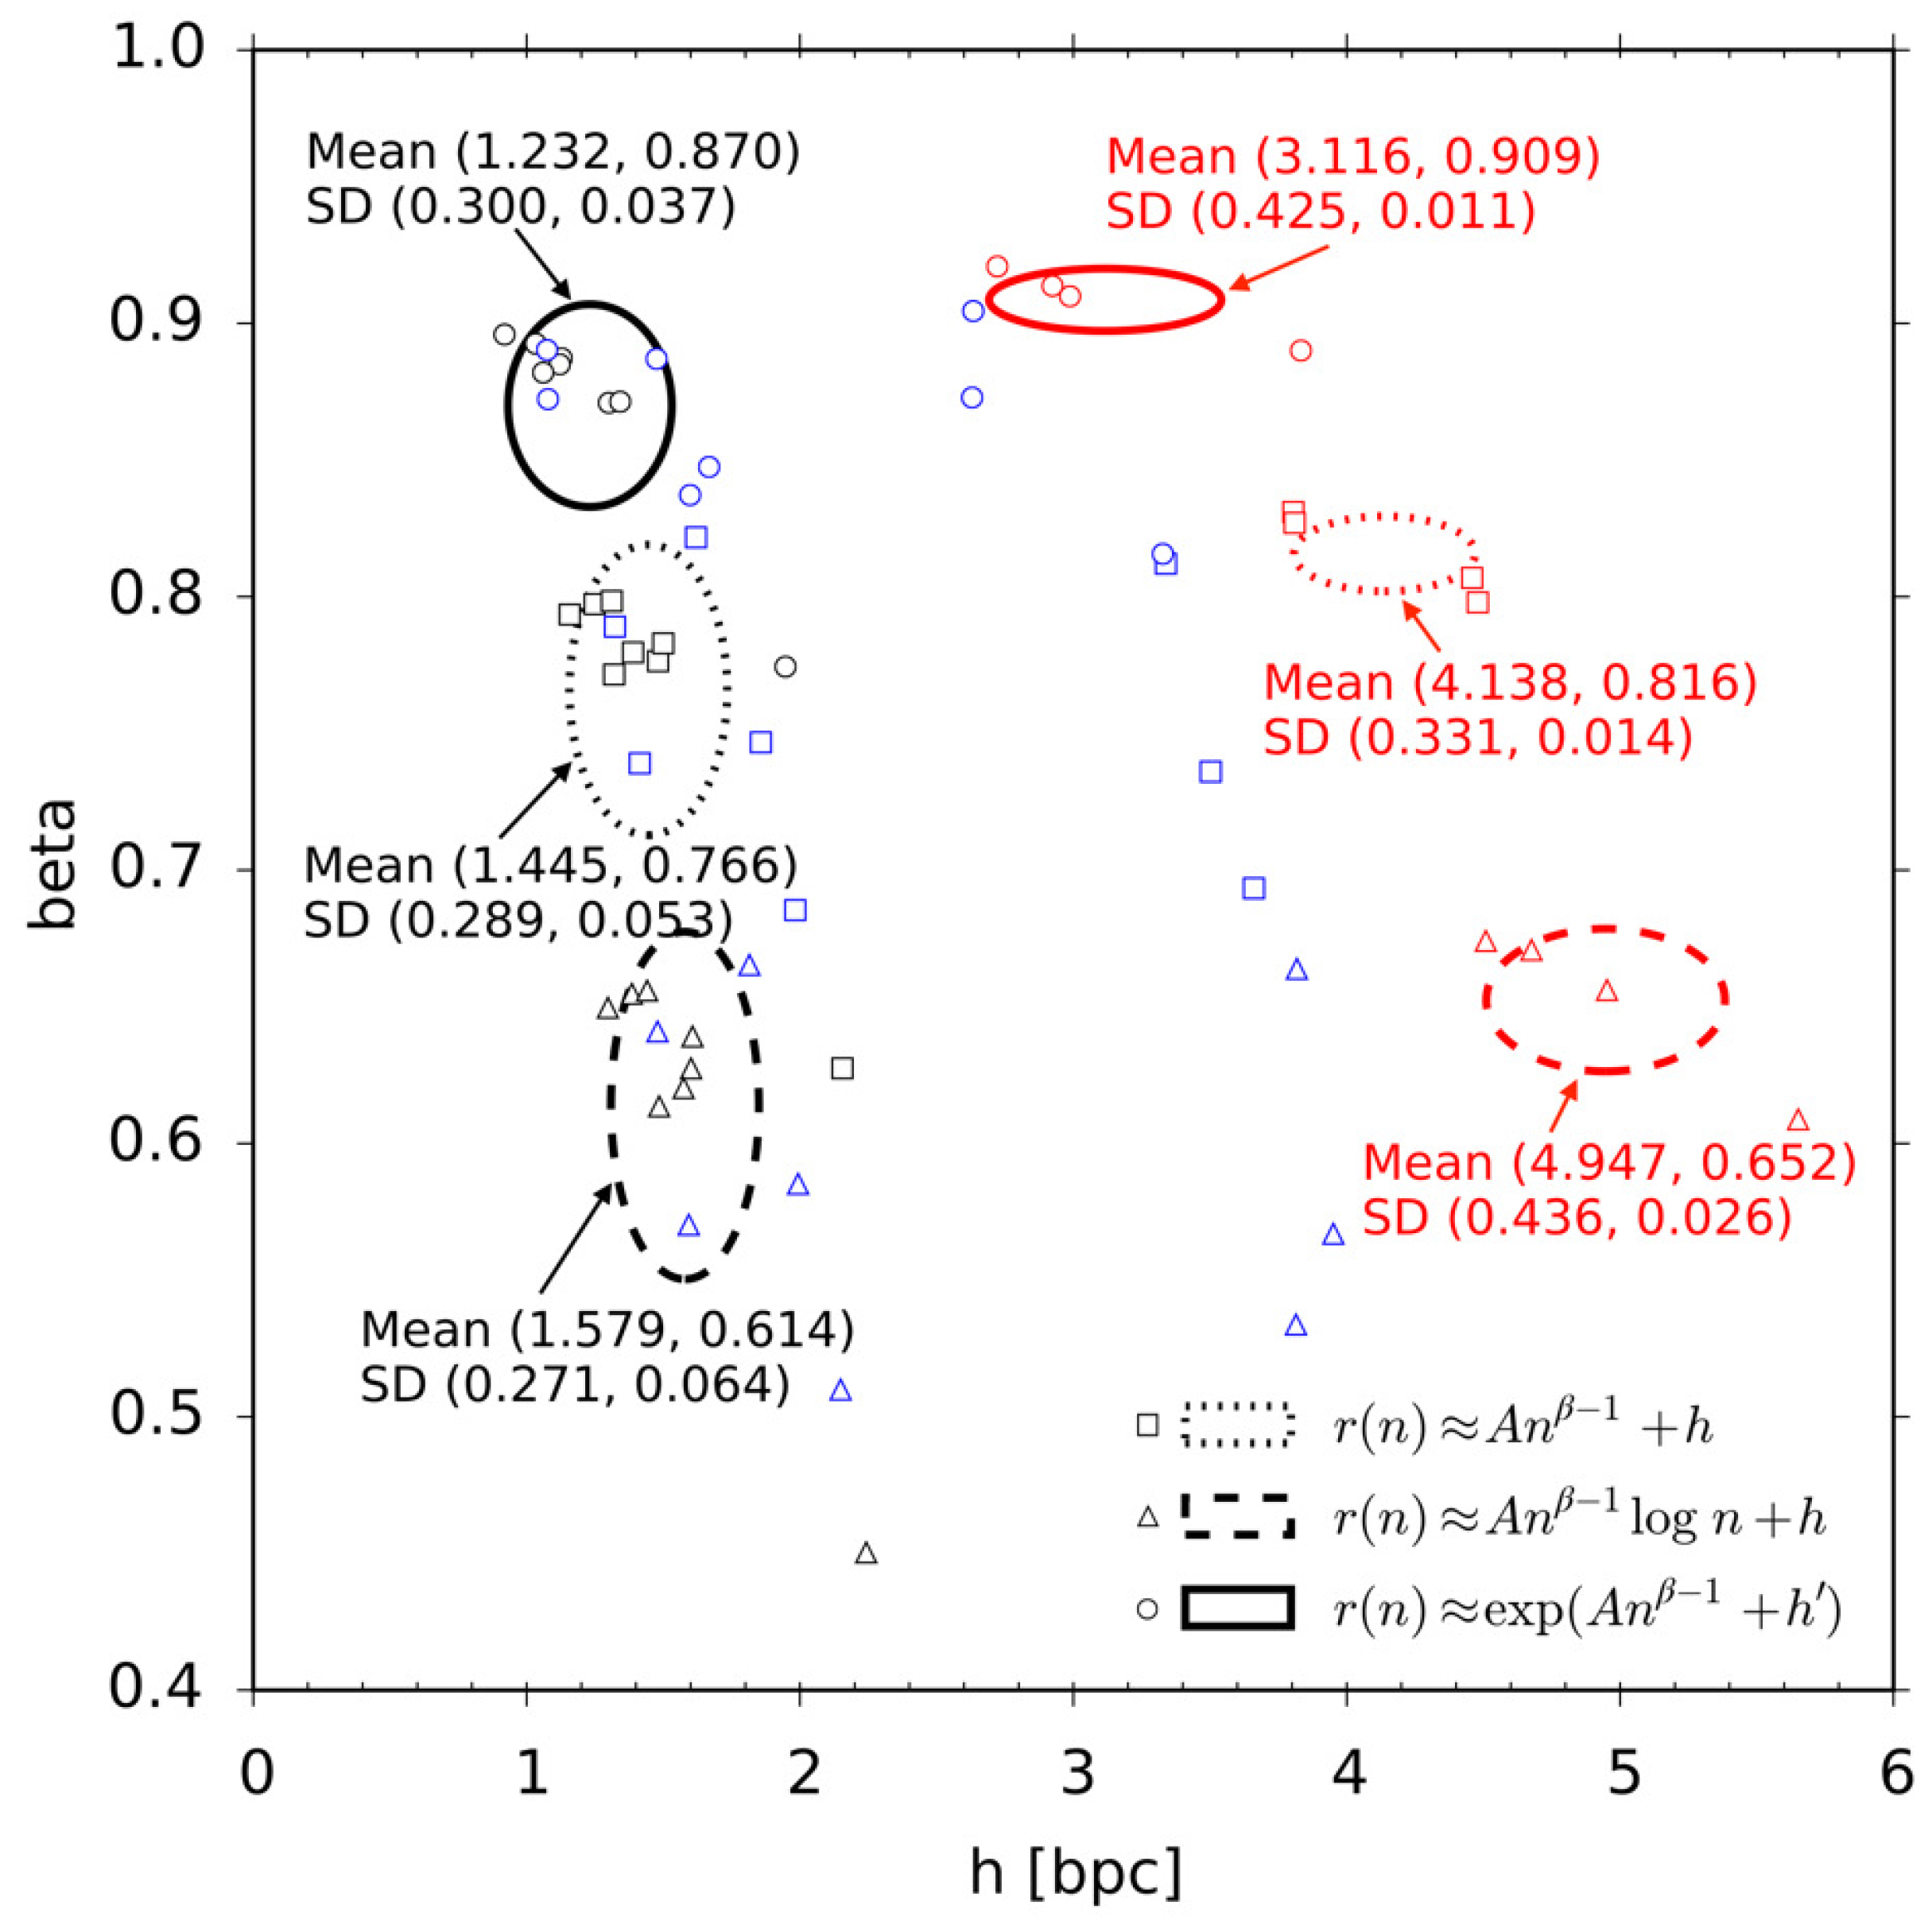
Hilberg [
9] and a few other researchers [
11,
12,
33] seemed to suppose that exponent
β is does not depend on a particular corpus of texts, i.e., it is some language universal which determines how hard it is to
learn to predict the text. Exponent
β is thus some important parameter of language, which is complementary to the entropy rate, which determines how hard it is to
predict the text once the optimal prediction scheme has been learned. Let us note, that if the exponent
β does not depend on a particular corpus of texts, then for all three functions
,
, and
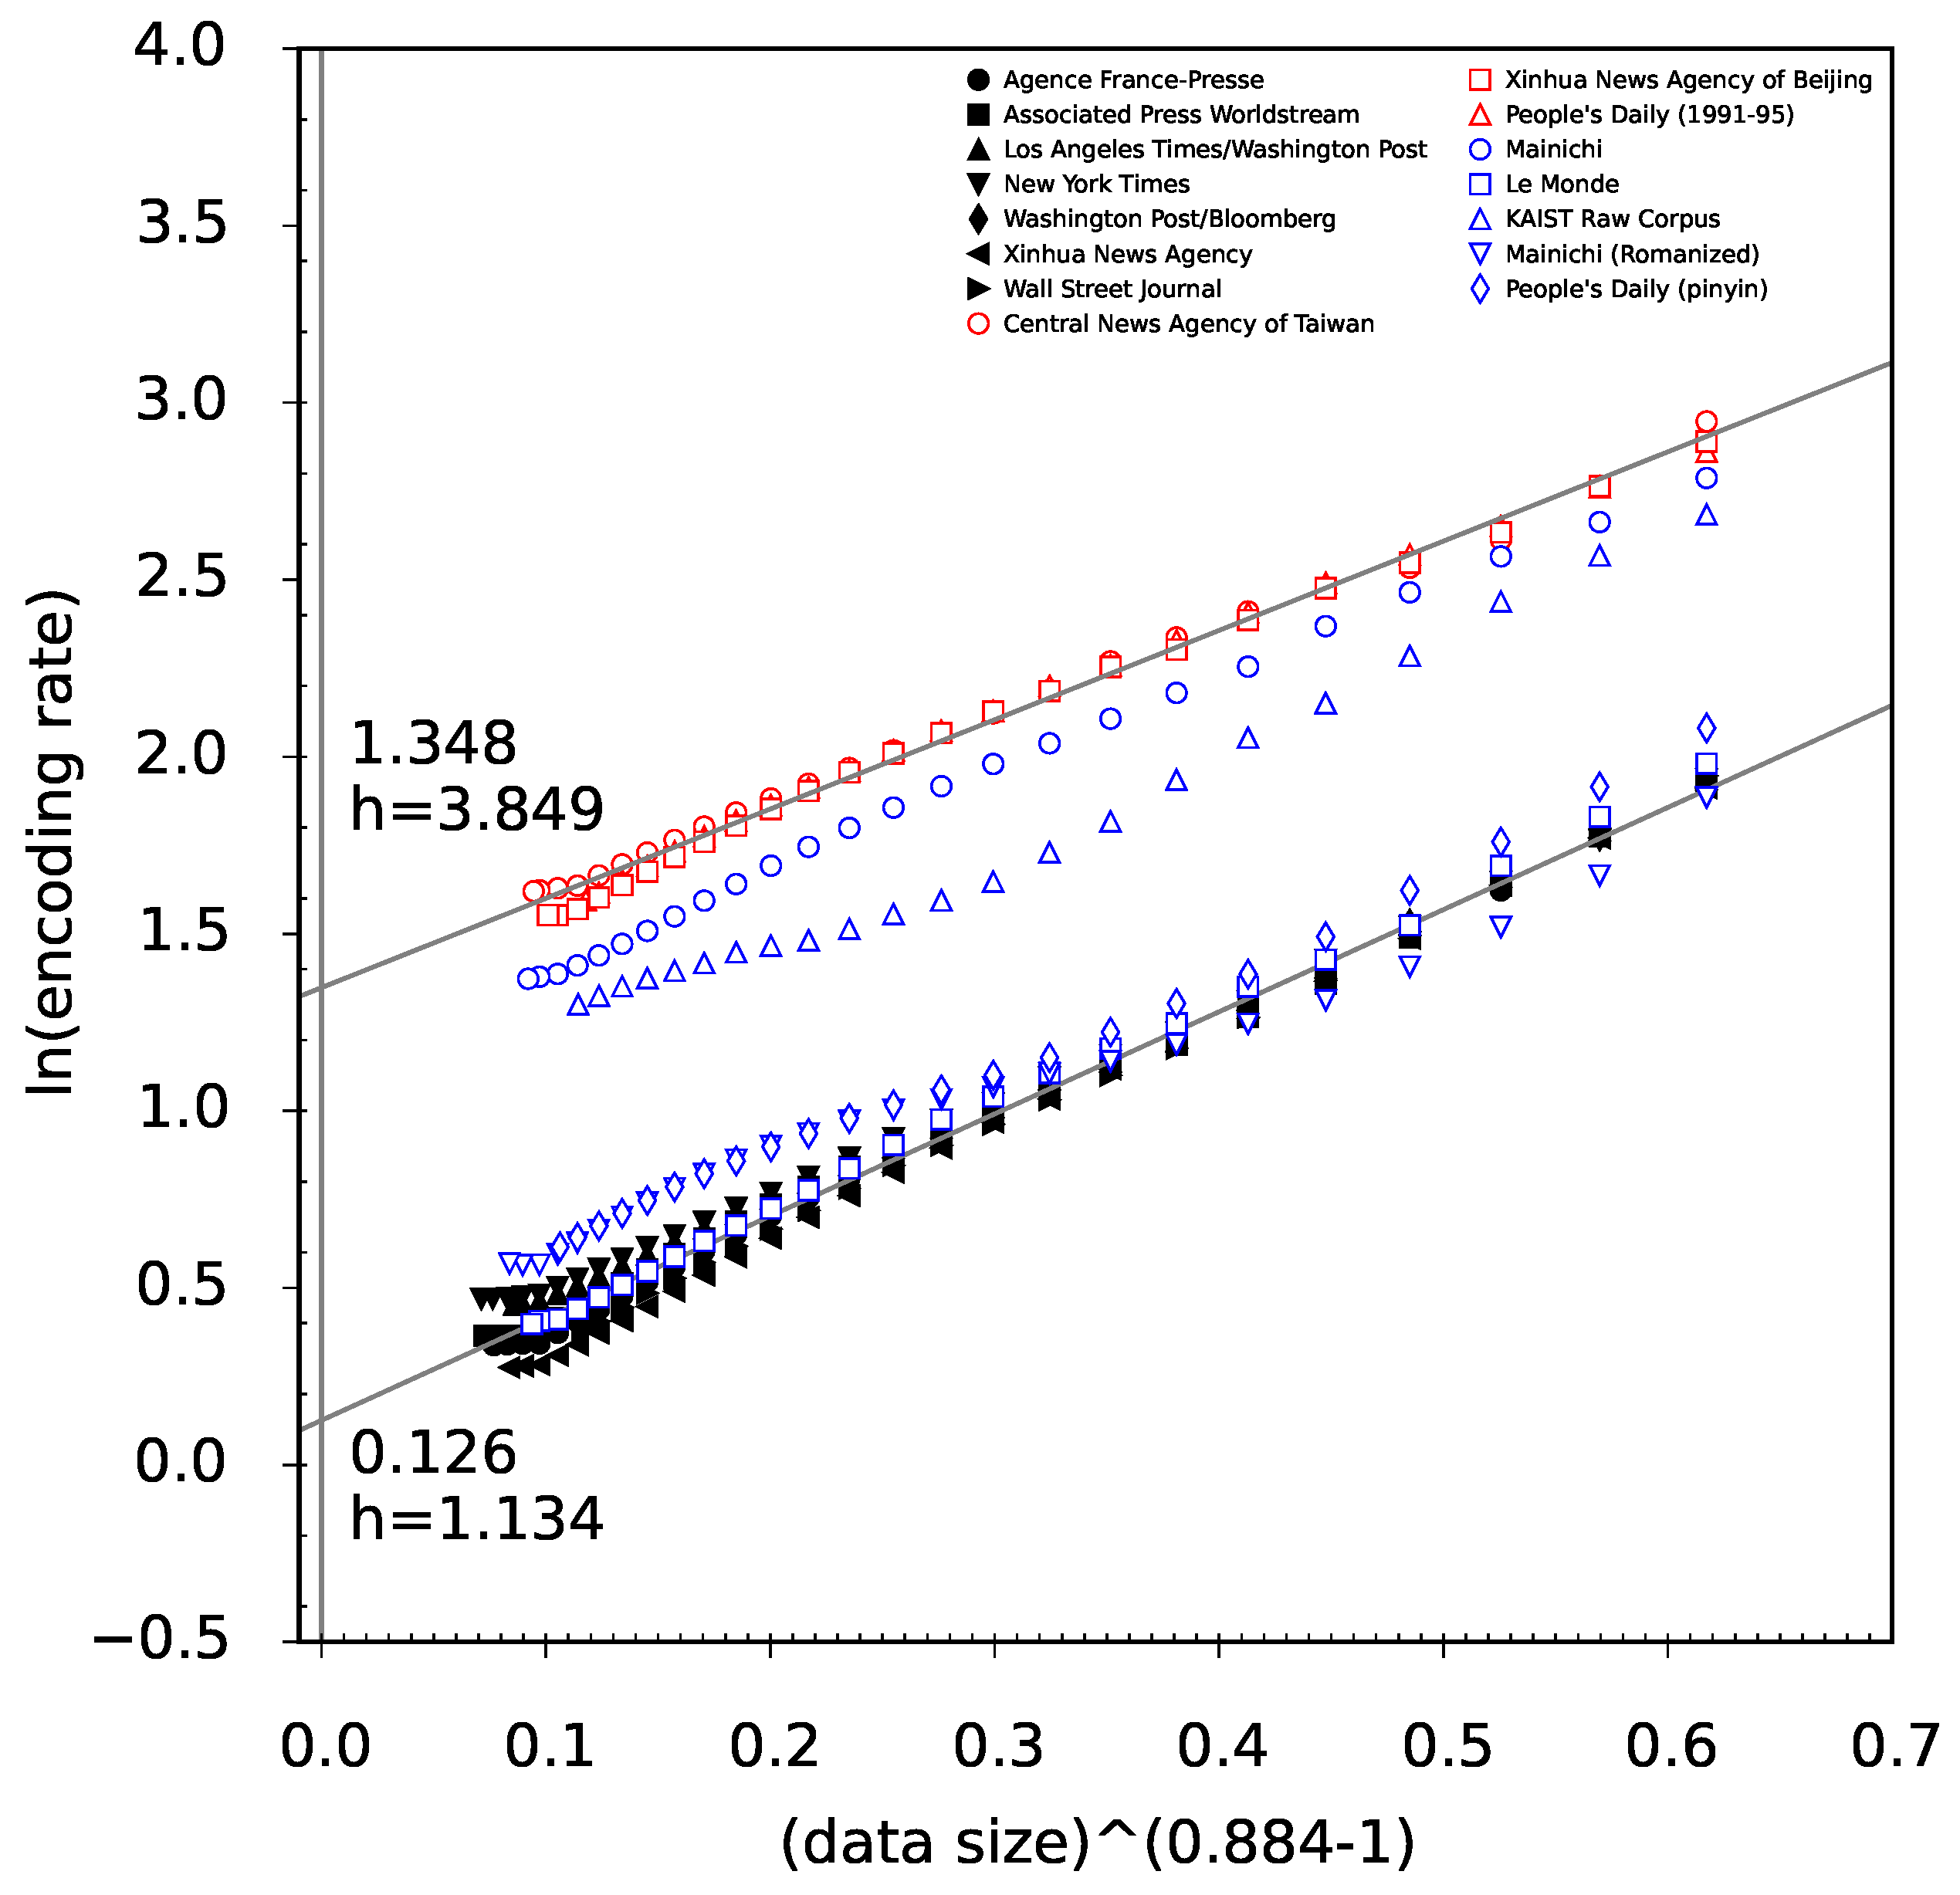
we can draw a diagnostic linear plot with axes:
and
for
,
and
for
, and
and
for
, respectively. In these diagnostic plots, the entropy rate corresponds to the intercept of the straight line on which the data points lie approximately. In fact we observe that exponent
β is indeed some language universal. For this reason we will use these diagnostic linear plots to compare different text corpora in
Section 6.4.
7. Conclusions
Motivated by some controversy whether the entropy rate of natural language is zero [
9,
10] or not [
2,
5,
6,
7,
8], in this article, we have evaluated the entropy rates of several human languages using the PPM algorithm, a state-of-the-art compression method. Compared to previous works, our contribution can be summarized as follows. First, we have calculated the compression rates for six different languages by using much larger, state-of-the-art corpora with sizes of up to 7.8 gigabytes. Second, we have extrapolated the empirical compression rates to some estimates of the entropy rate using a novel ansatz, which takes form of a stretched exponential function. This new ansatz function fits better than the previously proposed ansatzes and predicts entropy rates which are approximately 20% smaller than without extrapolation. Nonetheless, since these estimates are clearly positive, we falsify the original hypothesis by Hilberg [
9].
Still, we observe that there remains something true in Hilberg’s original hypothesis. Our newly proposed stretched exponential function ansatz has three parameters: the limiting entropy rate, a proportionality constant, and an exponent
β. Here, exponent
β controls the speed of convergence of the compression rate to the entropy rate. In simple words, whereas entropy rate measures how hard it is to
predict the text, exponent
β measures how hard it is to
learn to predict the text. Whereas the entropy rate strongly depends on the kind of the script, the exponent
β turned out to be approximately constant,
, across six languages, as supposed in [
9,
11,
12,
33]. Thus we suppose that the exponent
β is a language universal and it characterizes the general complexity of learning of natural language, all languages being equally hard to learn in spite of apparent differences.
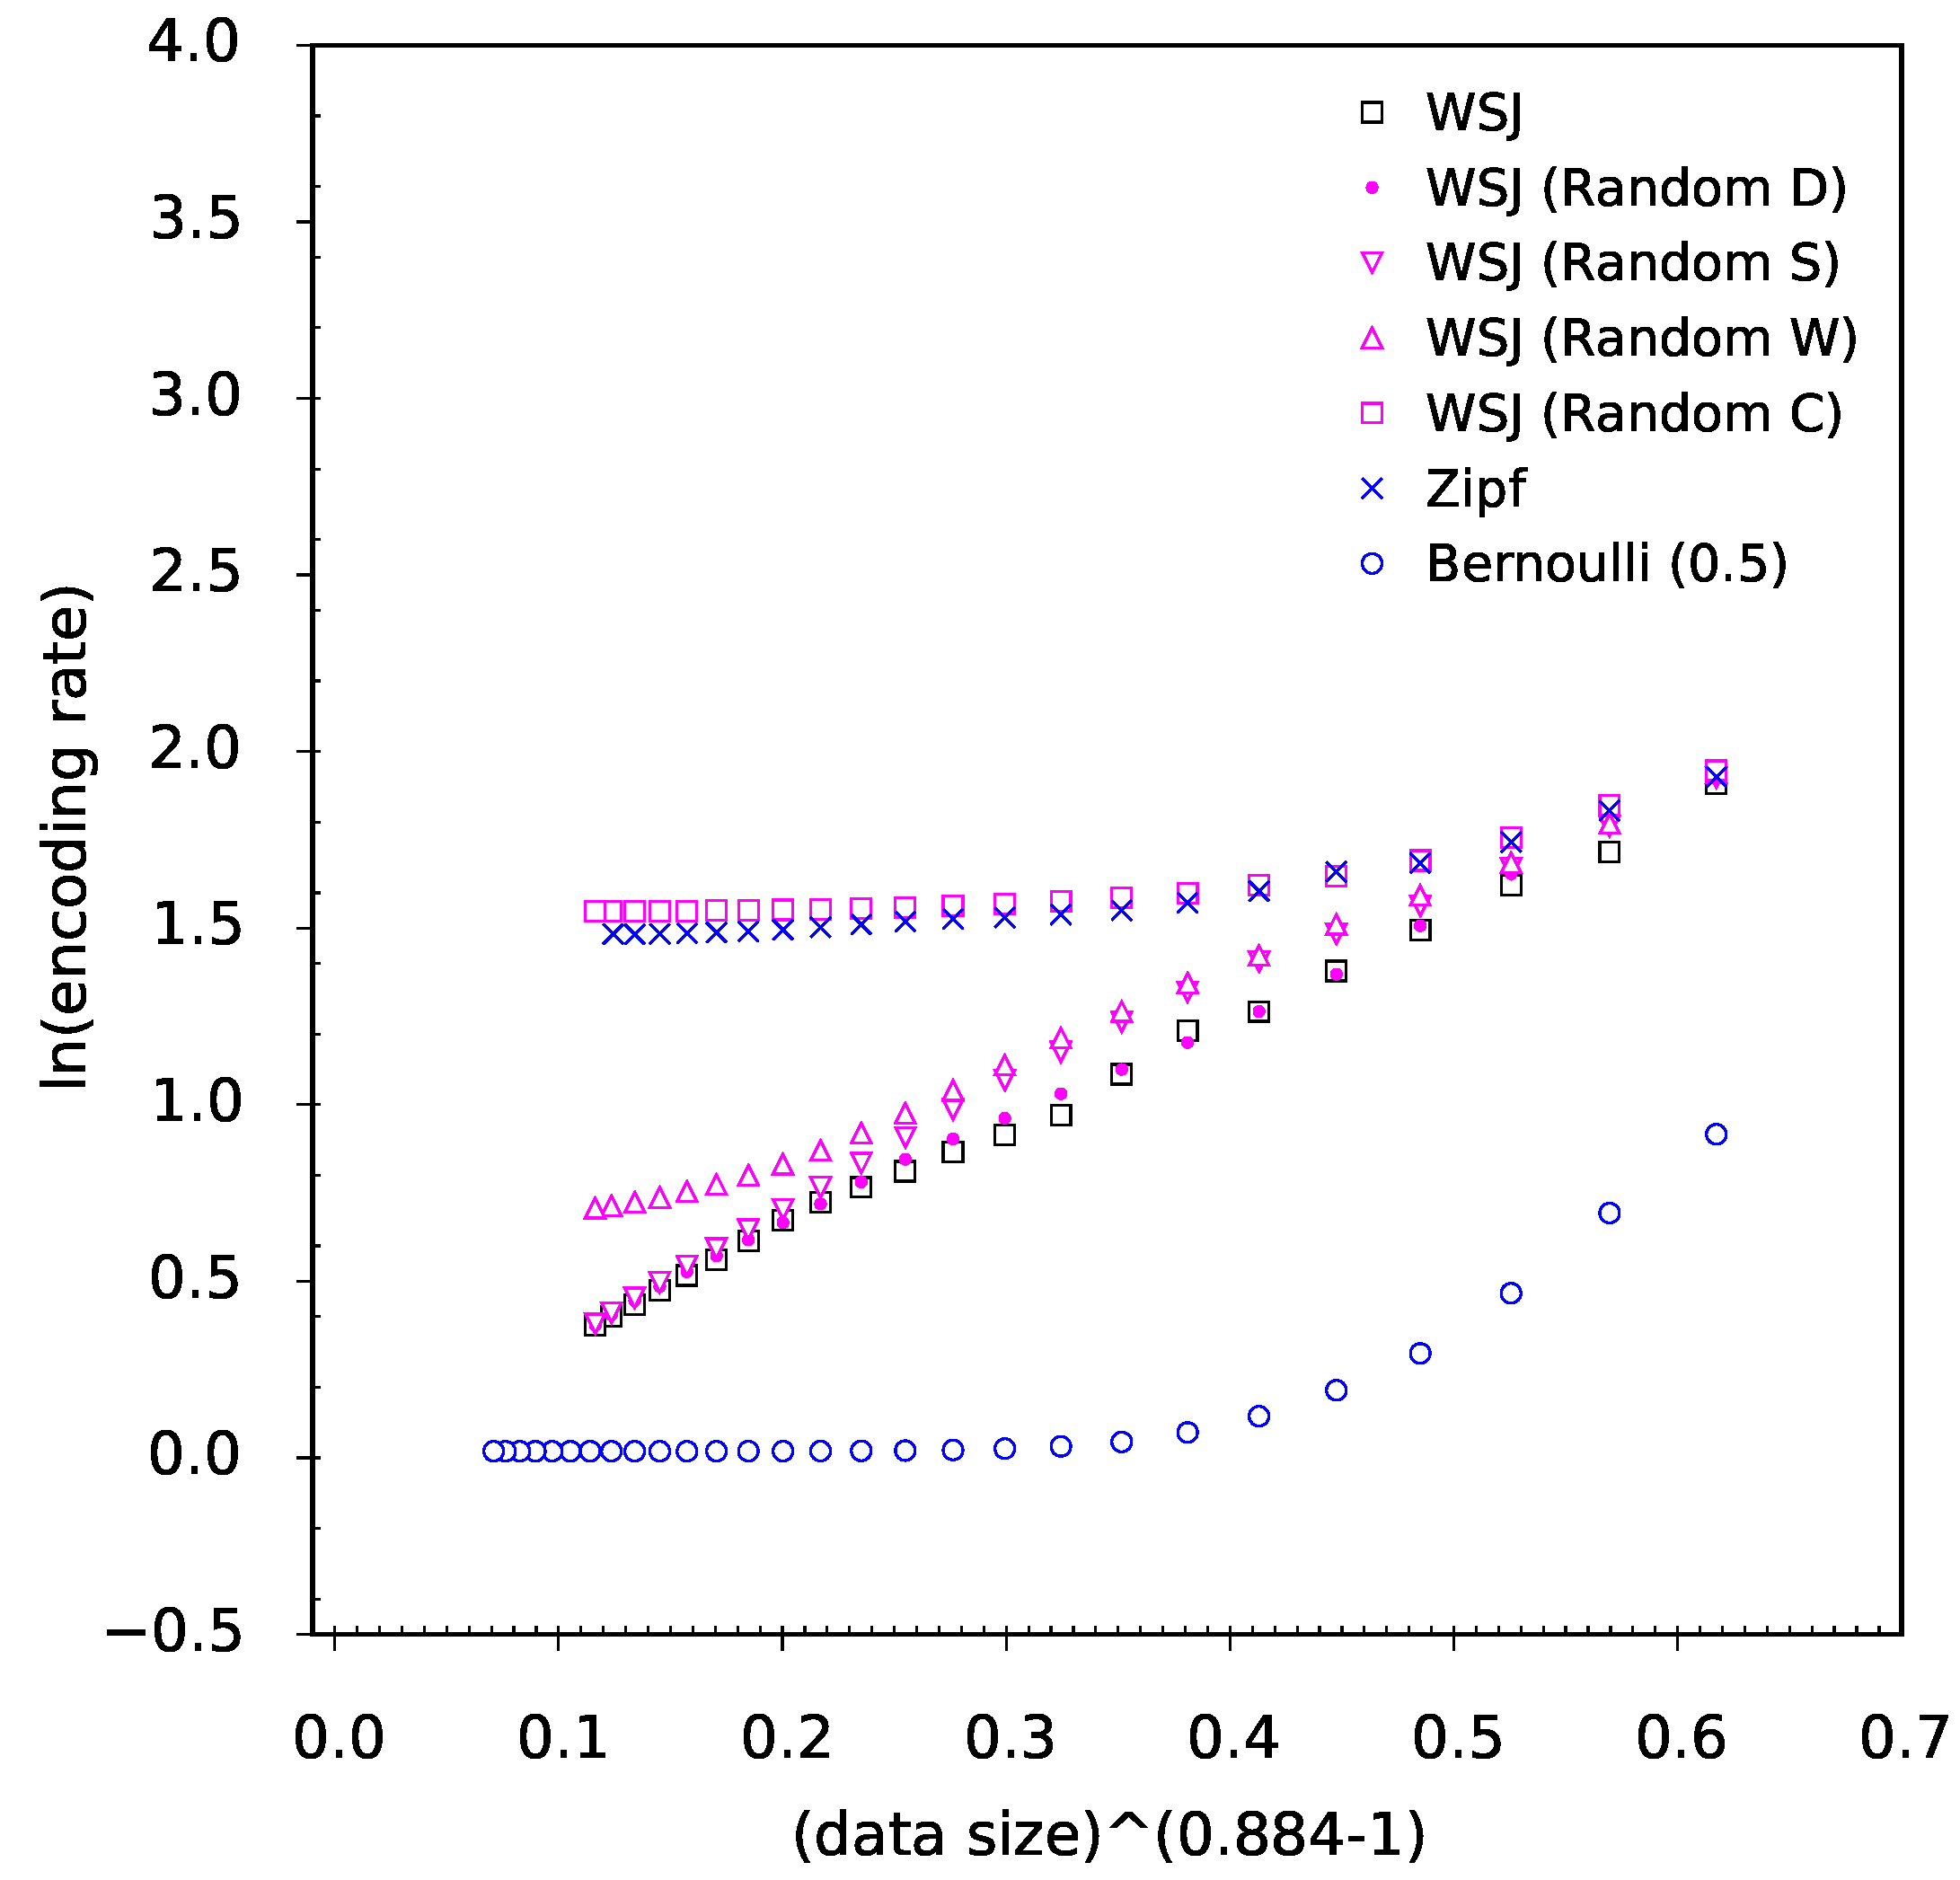
Considering the stretched exponential decay rate of entropy estimates, an objection can be made whether this decay is a property of language itself or a property of the PPM code. A quick look at
Figure 6 asserts that the decay rate for randomized data is ruled by very different functions. Thus the decay rate ruled by the stretched exponential decay is a specific
joint property of natural language and the PPM code. Whereas the decay of entropy rate estimates is different for simple stochastic sources, we suppose that the reported cross-linguistic and cross-textual universality of exponent
β does say something about complexity of natural language.
Some future extension of our work might be to simply enlarge the data, but it will not be trivial to obtain a uniform corpus of a larger scale. In the future work, it may be advisable to look for other computational approaches to the problem of entropy estimation.


