Tax Competitiveness of the New EU Member States


1
Agricultural Policy and Foreign Trade Division, Lithuanian Institute of Agrarian Economics, LT-03105 Vilnius, Lithuania
2
Economic Faculty, P. G. Demidov Yaroslavl State University, RU-150003 Yaroslavl, Russia
*
Author to whom correspondence should be addressed.
J. Risk Financial Manag. 2019, 12(1), 34; https://doi.org/10.3390/jrfm12010034
Submission received: 7 December 2018
/
Revised: 21 January 2019
/
Accepted: 21 January 2019
/
Published: 14 February 2019
(This article belongs to the Special Issue Quantitative Risk)
Abstract
:This paper investigates tax competitiveness among the EU member countries. The tax competition of countries causes both positive and negative effects on macroeconomic processes such as the effectiveness of government spending, the rationality of supply of externalities, and the length and amplitudes of business cycles. A considerable reduction of corporate tax in the EU is related to increased tax competition after new members entered the EU. Multiple criteria methods were chosen for the quantitative evaluation of EU countries from different regions of the EU. Criteria of evaluation were chosen and structured into a hierarchy. The convergence process of the new members of the EU is reinforced with the increasing tax competitiveness of such countries. Results of the multiple criteria evaluation revealed both the factors that increased the tax competitiveness of new members of the EU, and outlined the factors that hampered such competition.
1. Introduction
The process of globalization increasingly penetrates economic relations through all levels of the world’s economy. This phenomenon became especially evident in the 1990s while the interest of researchers on this topic peaked upon the breakup of the recent financial crisis (Podviezko 2016). The tax systems of countries in the context of increased globalization are now subject to intensive competition as the tax base becomes increasingly mobile. Nevertheless, the current state of globalization still implies a considerable degree of differentiation at both the country and regional level. Tax systems of countries are still among the few remaining pillars of national policies. Financial globalization has resulted in the unification of monetary policy in the EU. A major part of the particularities of national or spatial economies still stems from differences in tax systems. As particularities of national economic policies in the context of globalization are often viewed in light of the tax competitiveness of countries, this naturally induces interest in it. We note that variation in tax competitiveness decreases upon the convergence of tax systems, which, in turn, happens when tax competitiveness increases.
Increases in the competition between countries in terms of attractiveness of their own tax environment obviously depends on the current degree of globalization. The competition between countries for potential investors results in changes in the size of tax bases of competing countries. Consequently, the tax systems of countries need flexibility in order for them to be adopted in the globalized and digitalized environment, which is currently vital. The adoption, besides other factors, often implies modernization of tax collection systems and policies, especially when they are ineffective or unjustifiably complex. This modernization has an augmenting effect. It creates fewer possibilities for tax evasion, tightens constraints towards such illegal activities, creates an environment for fair taxation and, consequently, for higher rates of growth (Remeur 2015).
Both tax harmonization or tax competition are extremes, each having its own prominence. This does not allow for the formation of a uniform view towards making a better choice between one or the other. Tax harmonization would usually result in a reduction of tax risks, while an increase in tax competition would serve as a serious cause for vanishing the tax revenues of the state. The probable consequences are obvious, such as the reduction of the fiscal budget of a state, or undermining or weakening of the distribution system. A contraction of the budget to GDP ratio currently is taking place in the new EU member states, such as Bulgaria, Lithuania, Latvia, Romania, etc. Smaller budgets have negative consequences, such as hampering possibilities of social innovation (Kuklyte and Raisiene 2018; Raisiene 2015).
However, tax harmonization is viewed by some economists as a strong undermining factor of countries’ sovereignty, treason of national interests, and finally, as a negatively affecting growth factor. By taking large differences in the ratio of government spending into consideration, namely, of the state budget to GDP, differences between tax systems of countries become obvious and justified at present. In fact, government spending in each country depends on a different country-by-country demand of positive externalities, which, respectively, depends on the age structure of its citizens, the average income and GINI index, population density, culture, etc. (Boss 2011). The tax competition principle may also partly be supported by abundant cases of the empirical rejection of Tiebout (1956) hypothesis, stating that taxpayers are prone to vote with their feet (Taylor 1993).
The consequences of tax competition can be mitigated by means of regulation mechanisms or policies. The EU and the OECD can serve as examples of such a tax system regulation. It can be noted that, fortunately, tax competition within the member countries does not negatively affect tax revenues or government spending, thus allowing for generally sufficient tax collection and government spending (Brauckhoff 2012). In contrast to the theoretical monetary policy of full harmonization, tax harmonization processes in the EU are sluggish, while only the minor progress is noted in the VAT regulation. Consequently, EU members are unlikely to be prone to surrendering their tax regulation to the European Commission as it is one of their remaining pillars of sovereignty. Differences in taxes among the member countries may still serve as factors of adoption of new members to the EU by using stabilizers, which are estimated to absorb 15–20% of the GDP growth (Schadler et al. 2005).
In the context of the uniform monetary policy of the European Union, tax competition invokes a tangible additional self-regulation mechanism for the government (Llanes 1999). This still-available self-regulation feature is acclaimed by most member countries as it is known that in the case in which a member country has the choice of utilizing its sovereignty rights, it would usually opt to fulfill its national interest in the first place (Beetsma and Jensen 2005).
In view of the above context, it should be noted (in favor of tax competition) that the relationship between the magnitude of taxes paid and externalities received may be undermined. It was empirically proved that the ratio between tax rates and tax revenues is not as straightforward as the possibilities of either legally or illegally avoiding tax payments always remain (Bénassy-Quéré et al. 2014). Consequently, higher tax rates would not necessarily lead to higher tax revenues and the extensive financing of positive externalities.
The present research aims to evaluate the level of tax competition of a few major European economies, thus elaborating on both a monitoring tool for countries and a possibility to elicit prominent or lagging factors for each country evaluated. The international competition aimed at attracting new tax bases implies various, often contradicting, factors of different dimensions. For the present research, we will limit ourselves to the tax competition factors that are within the legal system of a country and we will exclude factors such as the creation of offshore zones or the size of the shadow economy.
2. Tax Competitiveness among the Countries of the EU: Dynamics of Corporate Income Tax
Tax competition between the countries of the EU emerged in 1957 when the European Union was founded. The Rome Treaty (1957) contains a chapter devoted to taxes, in which boundaries of tax competition for the participating countries were set. In 1965, the tax regulation was carried out by the European Commission, which commenced the process of harmonization of the tax systems of participating countries aiming to create the EU budget in the beginning of the 1980s. In 1997, the Economic and Social Committee expressed a concern about the fact that the installation of a common tax policy in the EU was lagging (Economic and Social Committee 1997). Nevertheless, back in 1980 the European Commission decided to distinguish tax sovereignty as the major pillar of sovereignty of countries because of two closely related reasons: differences in economic development among the participating countries, and effect of tax rates and tax policies on growth of a country’s economy (European Commission 1980). After this decision, tax competition started to rise. It peaked in 2004 and 2007, when 13 new countries joined the EU in two stages. The new member countries had a relatively low direct tax burden. After the recent financial crisis of 2008 an anti-crisis initiative of the European Commission was undertaken, and the tax competition was restrained. The initiative implied coordination of tax policies within the EU (European Commission 2010) and consolidation of budgets of countries. The latter action was anticipated by many in the EU and was considered to be vital for providing massive help to failing commercial banks and for invoking automatic stabilizers. Budget consolidation naturally reduces prerequisites for lowering taxes.
After exiting the recession, most of the countries increased their budget. Consequently, it became possible to deviate from the consolidation initiative and to revert to intensively using the instruments of tax competition. The process can be illustrated by the dynamics of the corporate income tax in the countries of the EU (Table 1).
In general, in 2008–2018 the rates of the corporate income tax were gradually decreased for the purpose of minimizing effects of the crisis (Table 1). The average rates decreased by 0.4%, from 18.4% to 18%, while they stabilized in the new member states. The maximal decrease of the rate by 7 p.p. was observed in Hungary, while the maximal increase by 5 p.p. was observed in Latvia. In the old member countries, the decrease of corporate income tax was more substantial. The average corporate tax rate in such countries decreased by 3.2 p.p., from 27.3% to 24.2%. The maximal decrease by 11 p.p. was observed in Great Britain, while the substantial decrease by 7.4 p.p. was observed in Italy, the decrease by 6.0 p.p. was observed in Sweden and Belgium, by 5 p.p. in Spain, and the increase by 4 p.p. in Greece. Data presented in Table 1 reveals stability of the general tendency of the decrease of the corporate tax over the past two decades.
It is worth attempting to analyze the changes of the corporate tax rate in groups of countries in the period of the past two decades. In EU-28 countries the average corporate tax rate decreased by 13.7 p.p. from 35% to 21.3%, while in the EU-15 group of countries the average corporate tax rate decreased from 38% to 24.2% by 13.8 p.p., and in the EU-13 group of countries the average corporate tax rate decreased by 13.5 p.p. from 31.4% to 18.2%. This change could be explained by increased tax competition and mobility of tax payers together with the economic integration. This tendency has two rationales. Firstly, economies of the old EU-15 members of the EU were much more powerful compared to the new members. Secondly, the former countries had considerably higher rates than the latter ones.
We point out that the coefficient of variation is small, ranging from 0.18 to 0.35, which demonstrates homogeneity of the tax rates. In the group of the old members of the EU, the coefficient of variation ranges from 0.18–0.23, which is smaller than the one in the group of the new members, which ranges from 0.18–0.35. Such a difference in the variation within the two groups is also observed from the average standard deviation, which is equal to 5.7 in the old members of the EU, while in the new members, it is equal to 6.1, and is slightly larger.
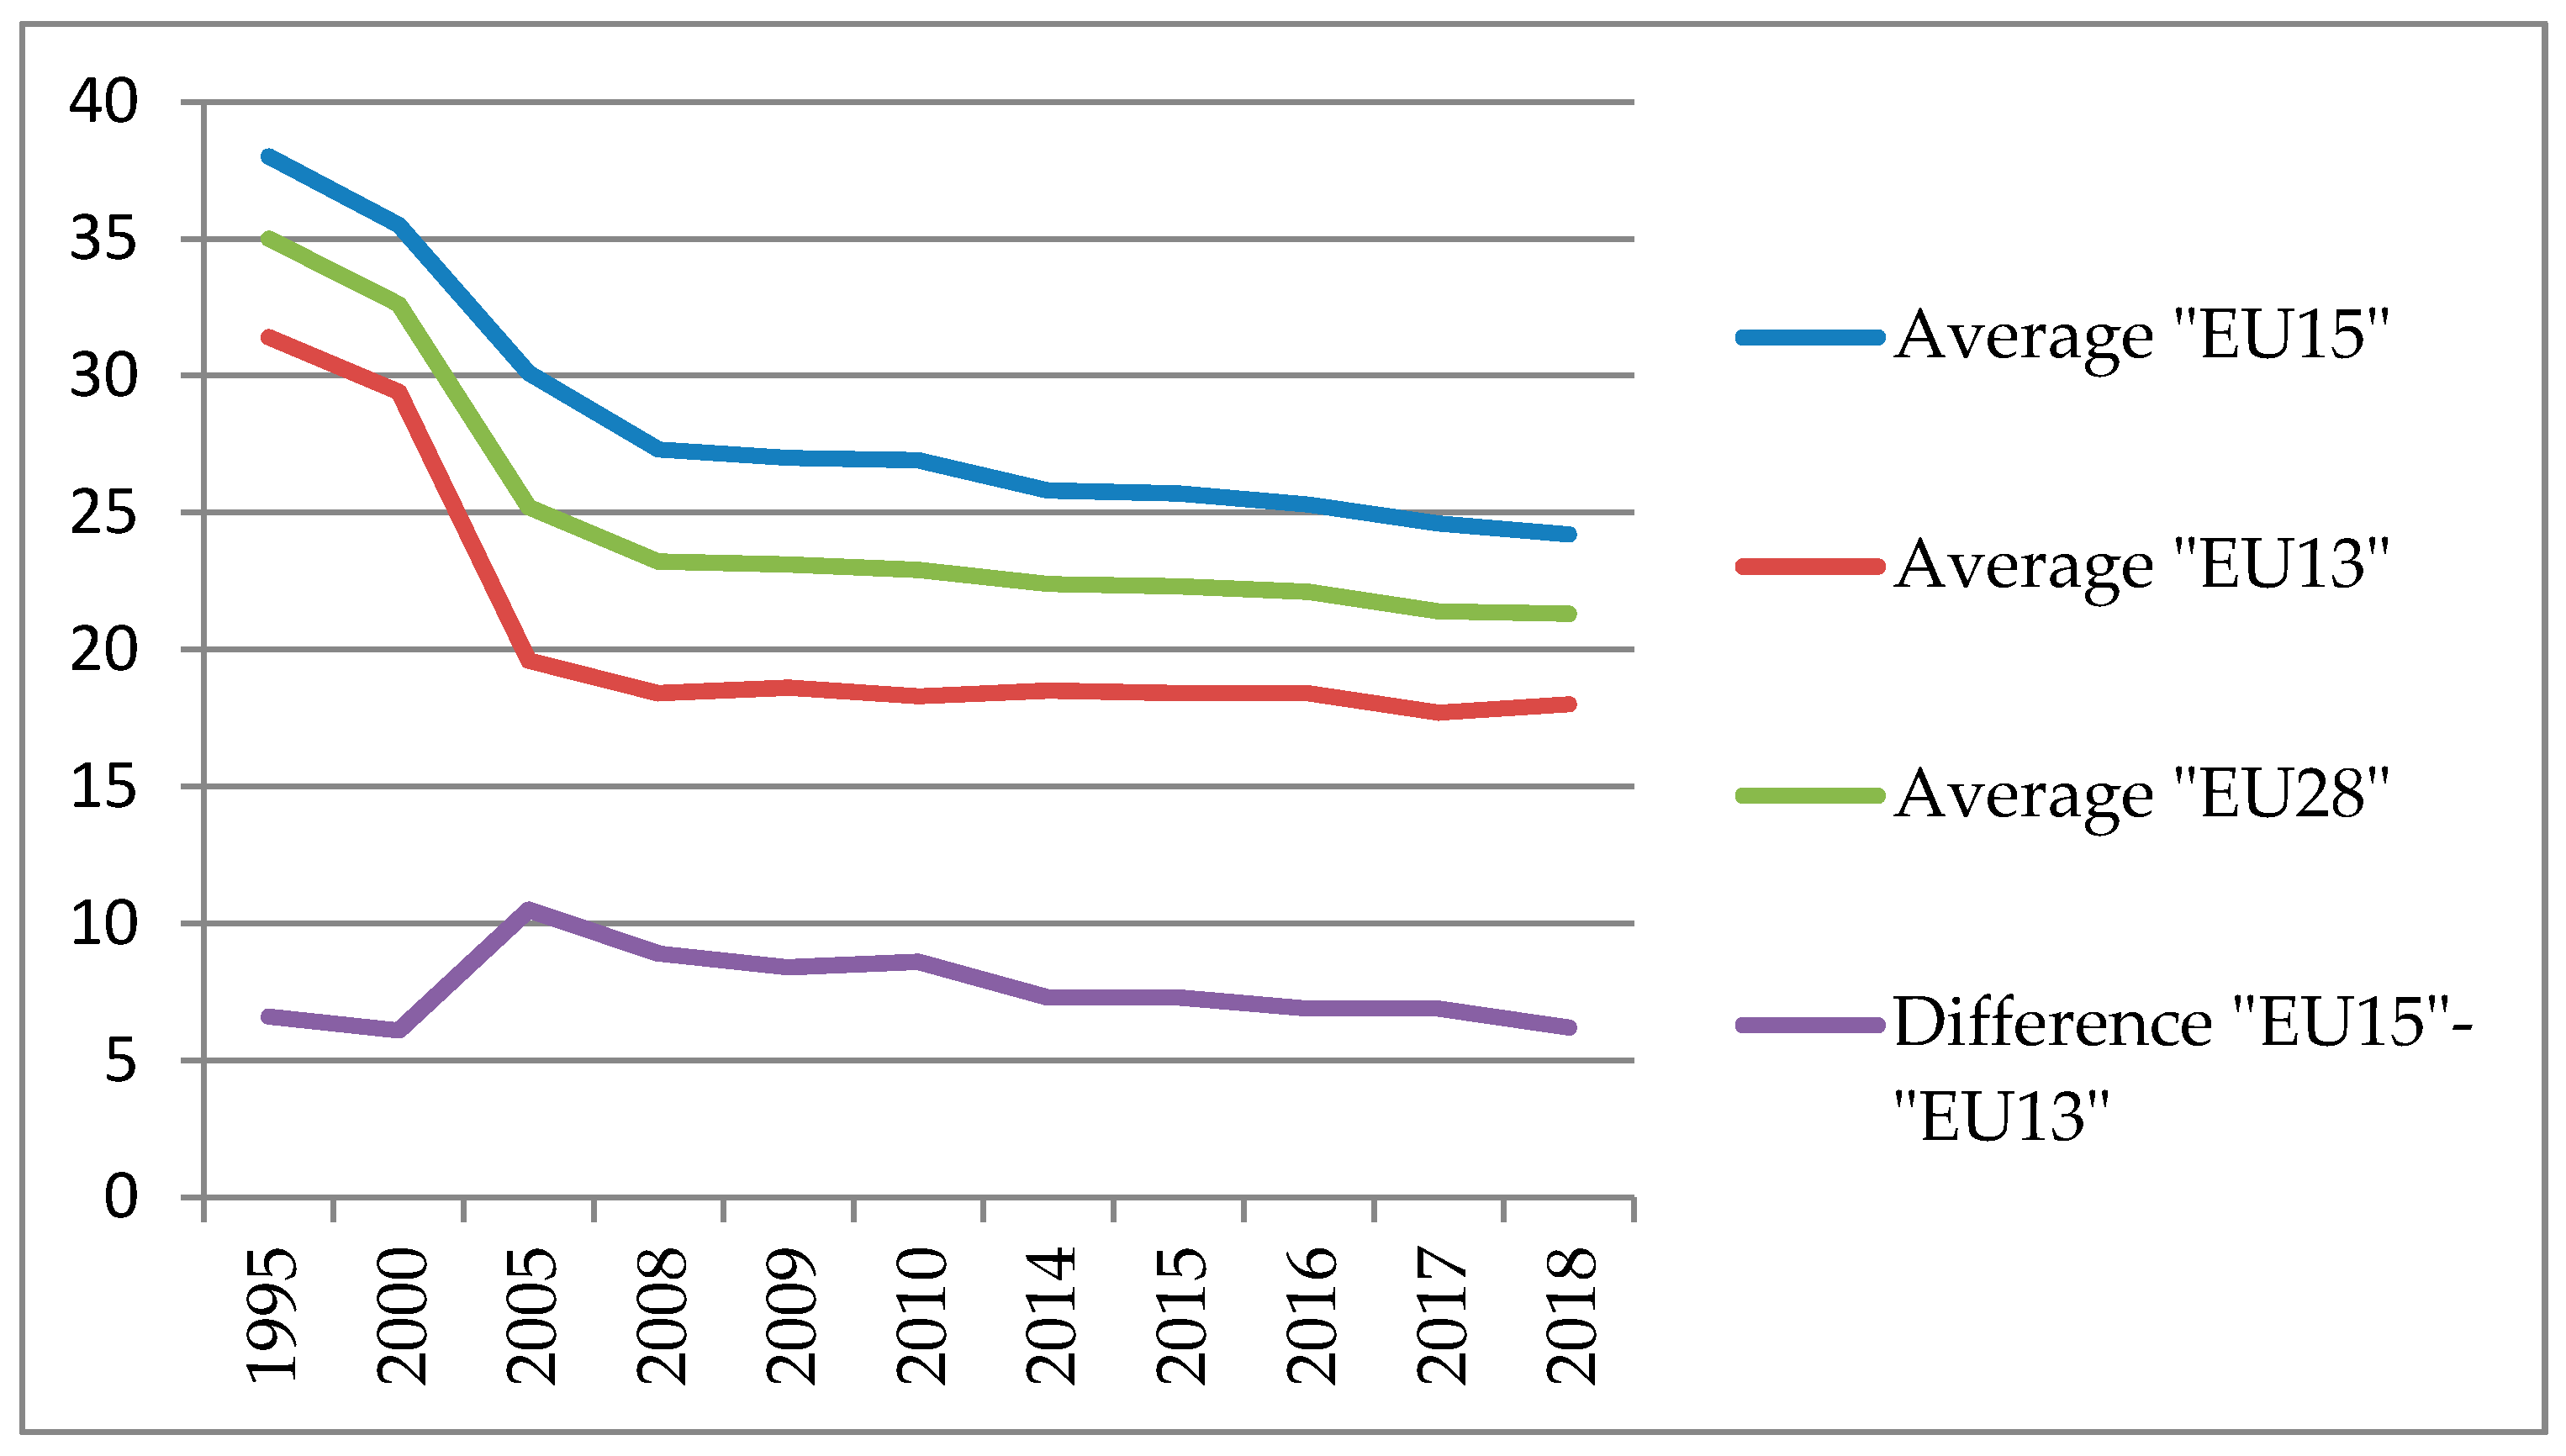
Figure 1 exposes the dynamics of the tax rate in different groups of countries of the EU over the period 1995–2018.
Dynamics of the difference of average corporate tax between the two groups of the old and new member countries of the EU indicates an increasing gap in the beginning of the period, peaking at 10.4 in 2005. Then the gap shrinks from the initial 6.6 p.p. to 6.2 (Figure 1).
The revealed dynamics of corporate tax illustrates the effects of increasing tax competition between the countries. The tax rates decrease while the gap between rates in both groups of countries—EU-15 (old EU members) and EU-13 (new EU member states)—also decreases.
3. Tax Competition
The global environment induces the necessity of tax risk management, which is becoming a vital tool of attaining the right balance between tax competitiveness and sovereignty of each country (Wunder 2009). There are three levels of tax risks: micro, intermediate, and macro. At the micro level, risks of both corporate taxpayers (Hanlon and Slemrod 2009; Wunder 2009; Shackelford et al. 2011) and individuals (Poterba and Samwick 2002) are observed. The topic of the present investigation requires boundaries on the scope of the research by setting the focus only on the intermediate and macro tax risk levels, or regions and countries, respectfully.
Presently, the following contemporary tax risk management theories could be observed in the literature:
- The probabilistic approach. This approach implies ex ante investigation of the probabilities of the risks of decreased tax collection caused by the behavior of taxpayers, who attempt to find possibilities of their tax minimization, usually because of shortcomings in the legal tax system (using tax minimization schemes) (Guenther et al. 2013; Neuman et al. 2013);
- Estimation of loss approach. Shrinking the tax base induces ex post losses of tax revenues, which in turn reduces the budget. The effect may be caused by business or investment withdrawals, or growth of the shadow economy (Graham and Smith 1999; Graham and Rogers 2002; Langenmayr and Lester 2018);
- Estimation of effects of other factors. The following risk factors are mentioned in the literature, such as ineffectiveness of tax privileges, unjustified changes in tax laws, ineffectiveness of tax or customs authorities, extensive and redundant reimbursements of collected taxes to taxpayers because of illegitimate actions of officers of the authorities (Arlinghaus 1998; Panskov 2013).
Realization of tax risks result in smaller tax revenues. The lower the tax risk, the higher the probability of attaining the planned level of tax revenues required for financing the budget. Shortcomings of tax policies result in increases of the tax burden, which are in turn caused by tax risks of the state. Factors of tax risks could be broadly categorized as follows (Pugachev 2014):
- decreases of the tax base;
- increases of the tax burden;
- tax evasion;
- utilization of tax minimization schemes by a considerable proportion of taxpayers;
- vague tax law regulations;
- abusing tax privileges, ineffectiveness of tax privileges;
- ineffectiveness or mistakes of tax authorities.
Each of the named categories of the tax risks is related to the tax competitiveness. Such an initial categorization of the tax risks will create preconditions of making the task of choosing the criteria of tax competitiveness and creation of a hierarchy structure easier.
It is clear that mobility of tax bases among the countries in question should be addressed for choosing factors that foster tax competition between countries. First, tax bases must be rather “compatible”. Second, they should be mobile. Third, tax bases must be elastic with respect to levels of the tax burden.
The first two factors are theoretical, while the third one is being investigated empirically. For example, De Mooij and Ederveen (2003) comprised more than 25 empirical studies and discovered that the average corporate tax rate elasticity is high: after the rate of corporate tax had decreased by 1% the foreign investment increased by 3.3%, in general.
Such a high level of average tax-rate elasticity of the foreign capital allocation explains the phenomenon of a considerably decreasing corporate tax rate in the countries of the EU. The factors fostering tax competition in the EU are described above in more detail. It could be predicted that the presence of such factors, coupled with the high tax-rate elasticity of foreign capital allocation should lead to a convergence of tax rates among the countries of the EU.
Does tax competition positively affect growth? There are different approaches among scholars working in this realm, while a consensus is far from being observed. A positive effect of tax competition is suggested primarily by authors working in the field of public choice theory. The predictable effects of tax competition are expected in the ineffective and rather erratic government sector (Brennan and Buchanan 1977). As Schratzenstaller (2011) pointed out, decreasing government spending made government sectors generally more effective in the countries of the EU.
In view of the fact that the relation between tax competition and growth is difficult to prove empirically, we may attempt to derive some theoretical deductions only. An increase in tax competition in the long run hampers the tax revenues of a state, and thus leads to smaller expenditures on positive externalities. In addition, a high degree of probability of a consequent decrease in scale of the economy usually leads to lower effectiveness of government purchases.
On the other hand, financial crises are a serious factor that at least temporarily notoriously block growth and considerably decreases the GDP of a country. In most Asia-Pacific countries, for example, very attractive growth rates vanished in two countries or even became negative in seven countries of twelve; both exports and imports decreased in spite of promising pre-crisis growth, immediately after the crisis (Filardo et al. 2009). Such a stabilizing factor as corporate revenue tax was an effective tool, but its rate had to be considerably reduced. After the reduction the tool became frail because of the fierce tax competition between countries, which made the amplitude of business cycles or crises more severe and protracted.
As has already been noted, tax competition in the EU has led to a considerable decrease in the corporate tax rate. Even if proofs or reliable studies of such effects are lacking in the literature, it could be observed that the policy of harmonization of the tax systems of the EU countries has a substantial regional integration effect on the member countries. Will this integration lead to the loss of the tax competitiveness in some countries? What are related dangers? We already named the existence of the high tax-rate elasticity of the foreign capital allocation by corporate tax rate. It suggests that the factor of the mobility of tax bases among countries is important. On the other hand, this mobility is not as substantial because the majority of researchers rejected the Tiebout hypothesis, as stated earlier in this paper.
Such a blend of various and often contradicting factors of the tax competition suggests that a decision on the optimal tax rate in a country should be made paying attention both to the problem of expansion or shrinking of the existing tax base, and to the risk of diminishing tax revenues. We propose to choose the ultimate criterion of competitiveness of a country’s tax system to be the integral magnitude of its tax revenues over a long-term period. In this paper, we used the MCDA approach to evaluate several countries in terms of tax competitiveness. An alternative approach of using genetic algorithms for finding the tax rates close to optimal could be used (Jacyna-Gołda et al. 2017).
Risks of having the negative (or positive) effects of tax competition are present in all different layers: the international, regional, horizontal, or vertical. Regional tax competition is present in federal states with political structures where decisions on tax rates are delegated to the federal governments. Horizontal tax competition attempts to widen tax bases. This type of competition is observed among countries, regions, states, or municipalities. Vertical tax competition strives to achieve stronger decision-making powers in the corresponding level of governmental management.
The effectiveness of altering tax rates could be observed in particular regions of the Federal Republic of Russia. In 2009, the government of the Perm region decided to decrease the corporate tax rate from 20% to 15.5%. The decrease of tax revenues of the region was foreseen by the public at the time of making the decision, but 43% decrease the same year exceeded the expectations. Such an effect was caused by the global financial crisis. Alteration of the tax rate reversed the trend of the diminishing tax revenues, and tax revenues of the Perm region increased by 34% in the subsequent year 2010. An increase by 25% was recorded in 2011, while tax revenues increased by 34% in 2012. In all following years, they were substantially higher than the average in the country. The increase was induced by extension of the tax base, as investment to the region increased by more than 4.5 times in the year of the alteration of the tax rate (Pugachev 2014). Effects of the regional tax competition can be observed from the fact that the government of the adjacent Sverdlovsk region had to follow the Perm region’s initiative and decrease the corporate income tax by 15.5%. Exact effects of the tax competition and ways of attracting tax payers to regions for the purpose of widening the tax base are being studied at both the international and federal levels (Parfenova et al. 2016; Fischel 1975; White 1975; Richter and Wellisch 1996), and are not yet known sufficiently well.
Economic environment factors are as important as the factors related to tax rates when a tax-paying firm is making a choice of residence (Pugachev et al. 2017). Such factors will be covered in the next section.
4. Multiple Criteria Evaluation of Tax Competition in the EU
In this section, we attempt to choose criteria for the evaluation of tax competitiveness. Initially, we summarize the ideas outlined above from the tax competitiveness literature. Researchers emphasize the importance of the favorable tax environment, tax rates, and the tax burden, as well as the quality of the state tax administration, growth rate, demographic characteristics, the level of remuneration, and the level of corruption. Thus, factors of tax competitiveness can be broadly divided to two categories: directly related to taxes or economic factors. The first group of factors influence the magnitude of the funds that are retained by firms after full payment of taxes. These factors are considered in the first place by decision-makers in tax-paying firms when making decisions about choosing the geographic location of firm registration or allocation of their production. Other important factors in this group are the quality of tax administration and ease of paying taxes. The second—economic—group of factors describes the country’s development in terms of growth, demographic characteristics, the level of remuneration, and corruption. This group reveals the conditions associated with conducting business in a country. The economic factors also affect firms’ decision-makers: demographic factors indicate the availability of qualified employees, the level of remuneration directly relates to costs incurred by businesses and to their competitiveness, and corruption hampers businesses and negatively affects the business environment. Choosing criteria from all of the mentioned dimensions allows a comprehensive evaluation of the tax competitiveness of countries to be made, as well as a comparative analysis of the chosen countries by each criterion in order to derive causes of their prominence or lagging in detail.
To make a quantitative evaluation of socio-economic objects, we need a comprehensive set of criteria (Podviezko and Ginevicius 2010; Burinskiene et al. 2017). We will select criteria for describing the attractiveness and competitiveness of national tax systems, which comprise the following topics: (1) the favorable tax environment; (2) the business tax burden; (3) the quantity of different taxes and convenience of settlements with tax authorities; (4) economic and demographic factors; (5) the quality of tax administration; and (6) the level of remuneration or corruption (Goodspeed 1998; Devereux and Loretz 2013; Garrett and Mitchell 2001; Baskaran and Lopes da Fonseca 2014; Swank 2016). In order to simplify the task of criteria selection, a hierarchy structure was formed with the following categories: (1) the tax burden and convenience of settlement; (2) quality of tax system governance; (3) the growth rate; (4) the remuneration of labor; (5) the level of corruption. This categorization made the task of choosing criteria considerably easier. With the help of experts, one or two representative criteria were chosen within each category. The hierarchy structure of the chosen criteria is presented in Table 2. The direction of the criteria shown in the right-hand column of the table should be interpreted as: the greater the value of the corresponding maximizing criterion, the better the state of the corresponding object; and the case is opposite for the minimizing criteria. The values contained in the criteria decision-matrix are presented in Table 3. Sources for the data are shown in Table 4.
Competition between countries naturally implies the existence of a set of several competing countries. The MCDA (multiple criteria decision-aid) methods were designed to compare several objects (in our case, countries) using a set of quantitative evaluation criteria. Thus, the methods are suitable for the task of gauging the relative competitiveness in the group of countries. Within the MCDA framework, competing countries are to be called “alternatives”. They are compared using one or another MCDA method (Ranjan et al. 2016; Hossein Razavi et al. 2013). For the absolute MCDA evaluation of a single alternative, the methodology proposed in Podviezko and Podvezko (2014) can also be used.
Currently, researchers are concerned about the stability of MCDA methods. One dimension that affects the stability of the ranking of alternatives is criteria weights. Introducing some variations to weights that are originally elicited from experts affects the results of the evaluation. Another dimension of the magnitude of such variations is the choice of MCDA method (Mulliner et. al 2016; Maliene et al. 2018; Diciunaite-Rauktiene et al. 2018). It was also noted that in the case of a large number of alternatives, results of MCDA evaluation become less stable (Bielinskas et al. 2018). This is rather logical since values of the cumulative criterion of MCDA methods usually lie in a small range of the interval, for example [0, 1] for the SAW method, and even small changes in the value of the cumulative criterion may cause considerable changes in the rankings of larger sets of alternatives. Consequently, we have chosen a reasonable number of eight alternatives for our analysis, two from each region of Europe by the EuroVoc geographical classification (Table 5).
The macroeconomic variables that affect the tax environment of the chosen countries are presented in Table 6: the budget deficit/surplus-to-GDP, government debt-to-GDP, and government expenditure-to-GDP ratios. The first two ratios affect the stability of political and economic decisions of countries’ governments, while the third one reflects countries’ tax revenues. While the first criterion reveals a high variety of approaches towards budget discipline with clear bottom-leader countries of Southern Europe and France, the remaining two criteria show that new member states have better government debt-to-GDP ratios and much lower distribution of the GDP.
Two general approaches in establishing criteria weights are currently available. Namely, estimation of subjective weights by eliciting them from experts, and deriving objective weights from data (Zavadskas and Podvezko 2016). In order to estimate criteria weights, experts were invited to express their opinions on the importance of the chosen criteria. Opinions on the magnitudes of importance of criteria were elicited from 10 experts. All of the experts held a PhD degree; six were working in the field of finance at universities; two were working in the field of finance at commercial banks; one at a government entity that provides statistical information; and one at a commercial financial firm. The experts were asked to rank criteria and then to assign weights to each of the criteria, in per cent. In every case, it was checked that the sum of weights for each expert made 100%. Weights assigned by each expert and final weights are presented in Table 7.
The concordance level of expert opinions was gauged using the theory of concordance by Kendall (1955). Ranks of criteria are denoted as eik, where i = 1, 2, …, m is the index of criteria (in our case, m is equal to 8) while k = 1, 2, …, r is the index denoting experts (r is the number of responding experts, 10 in our case). In accordance with the theory, the sum of squared deviations of all ranks eik by all experts is calculated by the formula:
then the mean of such sums is found:
Kendall’s variable W equals to the ratio between the sum S, calculated by Formula (3), and its largest deviation, denoted by Smax, calculated by Formula (4). The latter sum is observed in the case of the absolute concordance of expert opinions in terms of ranks of importance of criteria.
Consequently,
The Chi-squared test statistic for this variable is calculated as:
The number of degrees of freedom υ = m − 1 = 7. For the purpose of performing the test statistics, the level of significance α = 0.05 was chosen. The threshold value that corresponds to this level of significance is .
Next, we need an adjustment of the coefficient of concordance in the case that equal ranks are found:
Here φ denotes the set of equal ranks, and tφ denotes the number of equal ranks within a set φ. In our case φ = 6, while the number of equal ranks ranges from 2 to 5 (5 for the 8th expert).
The non-adjusted test statistic appeared to be , while the adjusted test statistic was . Both values are well above the threshold . We may therefore reject the hypothesis of non-concordance of expert opinions and use the weights of criteria presented in the Table 6 in our research.
The evaluation of the alternatives was carried out using two MCDA methods, the SAW (simple additive weighting) and the PROMETHEE II (preference ranking organization method for enrichment evaluation) methods. The former method is classical, simple, and implies explicit normalization, while the latter method has a special prominence of the pairwise comparison and implies making a choice of preference functions and their parameters (Podvezko and Podviezko 2010a).
The SAW method (8) yields the cumulative criterion as a sum that is formed in accordance with the following formula, where normalized values of criteria are multiplied by the weights of significance of each criterion:
We chose such a normalization, which can be used later for explaining the results of the evaluation:
for the maximizing criteria, and
for the minimizing criteria. Here i denotes the index for criteria; j is the index for alternatives (the chosen countries); is the weight of criterion i; and are the normalized values of criteria.
The normalized values in accordance with Formulae (9) and (10) appear to be as follows in Table 8.
Such normalized values will help to analyze the causes of countries’ prominence and lagging by each of the eight criteria, as a normalized value close to zero indicates a weak position in the market, while a normalized value close to one indicates a strong position in terms of the chosen criterion (see Formulae (9) and (10)).
The PROMETHEE II method could well be regarded as somewhat descending from its simpler predecessor SAW method. The PROMETHEE II method uses preference functions of chosen shapes for the normalization. There may be different shapes of preference functions (the particular function is denoted by the index t). In the case where the utility of a decision-maker with a higher perception of smaller values and lower perception of larger values has to be adequately replicated, a C-shape utility function should be used (Podvezko and Podviezko 2010b). The linear ascending V-shape function replicates differences between criteria represented by two alternatives that most adequately participate in the pairwise comparison (Podvezko and Podviezko 2010a). The parameters q and s may be chosen in accordance with the algorithm described in Podvezko and Podviezko (2010b). There is a convenient possibility to mitigate the effects of noise in data by choosing a slightly larger parameter q and a smaller parameter q than was described in the algorithm. We chose 5% of the largest distance between values of criteria as a reasonable size for the flanks of the preference function to be added to the minimal distance and correspondingly subtracted from the maximal distance in order to obtain the adjusted parameters q and s. For other cases, the choice of the preference function is upon the decision-maker based on the noise observed in the data.
Preference functions take values between 0 and 1. The cumulative criterion of PROMETHEE II is calculated in two steps (Palevicius et al. 2018). First, for every alternative Aj and all other alternatives Ak, two inward and backward aggregated preference indices are calculated in accordance with the following Formula (11):
where the increment preferences of over are accounted for each criterion i. They are multiplied by the weights of each criterion in order to replicate the influence of the importance of each criterion, which is expressed by the corresponding weight.
For every alternative , positive and negative outranking flows are calculated by summing inward and backward aggregated preference indices over all alternatives:
The cumulative criterion naturally appears to be the difference between the positive flow and the negative flow for the j-th alternative:
5. Results
First, for the purpose of additional analysis and making conclusions we present the decision matrix with normalized values used for calculations of the SAW method (Table 9).
By multiplication by weights and summing in accordance with Formula (8), we obtain the results of the cumulative criterion and ranking as shown in Table 11.
Calculations for the PROMETHEE II method start from finding parameters of the V-shape preference function in accordance with the algorithm described in Podvezko and Podviezko (2010b). Both the initial parameters and adjusted ones for the purpose of diminishing effects of noise are presented in Table 10.
Table 11 presents results obtained by both MCDA methods as ranks. The ranks obtained by the two methods were combined by taking their average (Palevicius et al. 2016, 2017). Despite having different intrinsic logic, both methods yielded quite similar results. Both the normalized values shown in Table 7, and the positive and negative flows F− and F+ are suitable for deriving explanations of the final ranks obtained, which is essential for making analysis and conclusion.
For the initial checking of robustness, we decided to swap the criteria values of one country in the set, finding a country with quite different criteria values that would appear to be of the same rank. The swapping of Sweden with Finland, a country from the same region (values of its criteria can be found in Table 12), satisfied the outlined initial condition: the new country had to be chosen in a way that it again appeared in the same rank as Sweden did previously (rank 1).
The value of the cumulative criterion for Finland appeared to be 0.697; and for the PROMETHEE II method 0.684. Ranks of the countries in this evaluation remained unchanged, which reinforced the idea of the robustness of the MCDA methods chosen.
For an additional and more explicit analysis of robustness, we present an evaluation of all 28 EU countries in the Appendix A using the same MCDA methods used in the paper: SAW and PROMETHEE II (Table A1). The results presented in Table A1 of the eight countries covered in the paper were extracted to Table A2 along with processing the rank adjustment to relate the ranks to the set of eight countries. For ease of comparison, the ranks from Table 11 are shown in parentheses. Discrepancies between ranks of the three evaluation cases (Table 11 and Table 12; Table A1) did not appear to exceed a single rank, thus a good level of robustness was again observed.
6. Conclusions
Tax competition between countries directly relates to creating ways of attracting tax payers to register their businesses by creating favorable tax rates and lowering tax burden. The process was illustrated in terms of tax competition, taking a set of 28 countries of the EU, with newly added members in 2004 and 2007. Because of tax competitiveness, corporate income tax was lowered on average from 35.5% to 27.3% in the old-member countries, and from 29.4% to 18.4% in the new-member countries. After the recent crisis, the rate of decrease of tax rates was reduced.
The problem of how tax competition affects tax revenues and growth is still not solved. At present, we are lacking sufficiently grounded theories, frameworks, and empirical evidence explaining this relationship. The management of the instruments of tax competition aims at increasing tax revenue, but it can lead to the opposite result because of lowering tax competition, losing tax base, experiencing long time lags between amendments to tax policies and their effects, etc.
It was shown that tax competitiveness is driving tax rates down, which in turn diminishes tax revenues and consequently the budget. This process was illustrated by retrieving corporate income tax among the member states of the EU, which clearly showed a diminishing trend. Along with tax competition, this trend was reinforced by the entry of new member states. Such countries historically belonged to the USSR (i.e., Lithuania, Latvia, and Estonia) or to the block of socialist countries (i.e., Poland, Czechia, Slovakia, Slovenia, Croatia, Hungary, Bulgaria, and Romania), and upon their entry to the EU their economies were in rather poor states. The countries had to create attractive conditions for investing businesses by creating low tax rates. The consequence of this policy is that these countries still have mediocre budget-to-GDP ratios.
It is not yet clear how tax competition affects growth. It is important to monitor the tax competitiveness of countries in order to conduct further research and make conclusions on this topic. The methodology proposed in this paper creates a powerful decision-making tool for the effective monitoring of levels of tax competition for solving a trade-off between tax revenues and tax competition in a country. In more detail, the decision-support system could help manage the trade-off between falling tax revenues in a more competitive tax system and insufficient increase of tax base, in gauging time lags between amendments of tax policies and their effects, etc.
The viability of the proposed methodology was demonstrated by evaluating eight countries, taking two countries from each region of the EU. Results were obtained by two MCDA methods, SAW and PROMETHEE II. The results using these very different methods appeared to match sufficiently with each other. Criteria weights, which were elicited from experts, appeared to be concordant and were used in the proposed methodology. Additional robustness checks were carried out.
Lithuania and Poland, the new member states included in the set of evaluated countries, appear to be attractive in terms of tax competitiveness, but this may not necessarily be true, because they try to keep their tax rates more competitive than the old members of the EU. In Table 8, the new members Lithuania and Poland appear to be in the middle in terms of criteria 1 and 2, as the normalized values were close to 0.5 on average (0.52 and 0.77 for the case of Lithuania, and 0.84 and 0.38 for the case of Poland for the first two criteria). Lithuania and Poland appear to be attractive in terms of easiness of complying with requirements of the tax system, labor costs, and ease of doing business (in Lithuania). Time required to prepare a tax report and the rate of growth are the best in Lithuania among the countries in question.
Favorable tax rates did not help Bulgaria to achieve a competitive position among the analyzed countries (normalized values of the first two criteria for Bulgaria were 1 and 0.81, respectively). Causes are clearly seen from the same table: the most inconvenient environment in the market for paying taxes, and the highest level of corruption among the countries evaluated.
Lithuania showed high tax competitiveness. Its cumulative criteria of the SAW and TOPSIS methods were very close to the ones belonging to Sweden, the winner. Corruption Index and inconvenience of paying taxes in many instalments preclude that country from attaining the first position.
High growth rates and low labor costs make the new member countries Lithuania and Poland tax competitive. For the new member states, tax competitiveness is vital in order to increase their chances of making the process of convergence at least theoretically possible. Attaining the highest positions in tax competitiveness could increase investment and mitigate very high emigration rates.
Author Contributions
A.P. (Askoldas Podviezko) developed the model of quantitative and qualitative evaluation; performed calculations of weights and multiple criteria analysis; performed validation; structured the paper; contributed to draft the paper; and was responsible for the final paper revision, and improvement. L.P. provided extensive advice throughout the study, regarding the research design, methodology, findings. A.P. (Andrey Pugachev) created and developed the project idea, collected the data, contributed to draft the paper.
Funding
This research received no external funding.
Acknowledgments
We would like to thank the anonymous referees for their helpful comments and suggestions. The authors are responsible for any remaining errors or shortcomings.
Conflicts of Interest
The authors declare no conflict of interest.
Appendix A

Table A1.
Results of the evaluation of 28 EU countries by the SAW and the PROMETHEE II methods.
| Criteria | Sj | Rank (SAW) | F− | F+ | F | Rank (PROMETHEE) | |
|---|---|---|---|---|---|---|---|
| Countries | |||||||
| Austria | 0.602 | 13 | 2.959 | 3.318 | 0.359 | 13 | |
| Belgium | 0.500 | 25 | 4.817 | 2.292 | −2.525 | 26 | |
| Bulgaria | 0.520 | 24 | 5.357 | 3.273 | −2.083 | 25 | |
| Croatia | 0.521 | 23 | 5.590 | 3.574 | −2.015 | 24 | |
| Cyprus | 0.575 | 17 | 3.976 | 3.468 | −0.508 | 18 | |
| Czech Republic | 0.554 | 19 | 3.524 | 2.449 | −1.075 | 19 | |
| Denmark | 0.745 | 2 | 2.691 | 6.921 | 4.230 | 1 | |
| Estonia | 0.690 | 6 | 2.048 | 4.575 | 2.527 | 6 | |
| Finland | 0.712 | 4 | 1.959 | 5.243 | 3.284 | 4 | |
| France | 0.589 | 16 | 4.006 | 3.851 | −0.155 | 16 | |
| Germany | 0.609 | 11 | 3.251 | 3.726 | 0.475 | 12 | |
| Greece | 0.354 | 28 | 3.251 | 1.298 | −1.953 | 23 | |
| Hungary | 0.536 | 21 | 3.794 | 2.236 | −1.558 | 21 | |
| Ireland | 0.748 | 1 | 1.304 | 5.479 | 4.175 | 2 | |
| Italy | 0.408 | 27 | 6.080 | 1.069 | −5.012 | 28 | |
| Latvia | 0.646 | 9 | 2.546 | 3.903 | 1.357 | 9 | |
| Lithuania | 0.652 | 8 | 2.726 | 4.193 | 1.467 | 8 | |
| Luxembourg | 0.675 | 7 | 3.308 | 5.454 | 2.146 | 7 | |
| Malta | 0.489 | 26 | 6.645 | 3.570 | −3.075 | 27 | |
| Netherlands | 0.628 | 10 | 2.959 | 4.006 | 1.047 | 10 | |
| Poland | 0.599 | 14 | 2.854 | 3.021 | 0.167 | 14 | |
| Portugal | 0.590 | 15 | 2.737 | 2.816 | 0.079 | 15 | |
| Romania | 0.528 | 22 | 4.271 | 2.556 | −1.715 | 22 | |
| Slovakia | 0.545 | 20 | 3.696 | 2.414 | −1.283 | 20 | |
| Slovenia | 0.608 | 12 | 2.309 | 2.898 | 0.589 | 11 | |
| Spain | 0.574 | 18 | 3.006 | 2.541 | −0.466 | 17 | |
| Sweden | 0.692 | 5 | 2.544 | 5.221 | 2.677 | 5 | |
| United Kingdom | 0.722 | 3 | 1.900 | 5.378 | 3.478 | 3 | |
Table A2.
Excerpt of results of the evaluation of eight EU countries from Table A1 with ranks within the group.
Table A2.
Excerpt of results of the evaluation of eight EU countries from Table A1 with ranks within the group.
| Criteria | Sj | Rank (SAW) | F− | F+ | F | Rank (PROMETHEE) | |
|---|---|---|---|---|---|---|---|
| Countries | |||||||
| Northern Europe | |||||||
| Sweden | 0.692 | 1(1) | 2.544 | 5.221 | 2.677 | 1(2) | |
| Lithuania | 0.652 | 2(2) | 2.726 | 4.193 | 1.467 | 2(1) | |
| Western Europe | |||||||
| Germany | 0.609 | 3(4) | 3.251 | 3.726 | 0.475 | 3(4) | |
| France | 0.589 | 5(5) | 4.006 | 3.851 | −0.155 | 5(5) | |
| Central and Eastern Europe | |||||||
| Poland | 0.599 | 4(3) | 2.854 | 3.021 | 0.167 | 4(3) | |
| Bulgaria | 0.520 | 7(7) | 5.357 | 3.273 | −2.083 | 7(7) | |
| Southern Europe | |||||||
| Spain | 0.574 | 6(6) | 3.006 | 2.541 | −0.466 | 6(6) | |
| Italy | 0.408 | 8(8) | 6.080 | 1.069 | −5.012 | 8(8) | |
References
- Arlinghaus, Barry. 1998. Goal Setting and Performance Measures—By Tax Professionals in Fortune 500 Companies. The Tax Executive 50: 434–42. [Google Scholar]
- Baskaran, Thushyanthan, and Mariana Lopes da Fonseca. 2014. The Economics and Empirics of Tax Competition: A Survey and Lessons for the EU. Erasmus Law Review 1: 3–12. [Google Scholar] [CrossRef]
- Beetsma, Roel, and Henrik Jensen. 2005. Monetary and Fiscal Policy Interactions in a Micro-Founded Model of a Monetary Union. Journal of International Economics 67: 320–52. [Google Scholar] [CrossRef]
- Bénassy-Quéré, Agnès, Alain Trannoy, and Guntram Wolff. 2014. Tax Harmonization in Europe. Paris: The French Conseil d’analyse économique. [Google Scholar]
- Bielinskas, Vytautas, Marija Burinskiene, and Askoldas Podviezko. 2018. Choice of Abandoned Territories Conversion Scenario According to MCDA Methods. Journal of Civil Engineering and Management 24: 79–92. [Google Scholar] [CrossRef]
- Boss, Alfred. 2011. Weder Eine Harmonisierung Der Besteuerung Noch Eine Europa—Steuer Sind Nötig. Wirtschaftsdienst 2: 94–97. [Google Scholar]
- Brauckhoff, Kerstin. 2012. Steuerwettbewerb in Der Europäischen Union. Brussels: European Liberal Forum. [Google Scholar]
- Brennan, Geoffrey, and James M. Buchanan. 1977. Towards a Tax Constitution for Leviathan. Journal of Public Economics 8: 255–73. [Google Scholar] [CrossRef]
- Burinskiene, Marija, Vytautas Bielinskas, Askoldas Podviezko, Virginija Gurskiene, and Vida Maliene. 2017. Evaluating the Significance of Criteria Contributing to Decision-Making on Brownfield Land Redevelopment Strategies in Urban Areas. Sustainability 9: 759. [Google Scholar] [CrossRef]
- De Mooij, Ruud, and Sjef Ederveen. 2003. Taxation and Foreign Direct Investment: A Synthesis of Empirical Research. International Tax and Public Finance 10: 673–693. [Google Scholar] [CrossRef]
- Devereux, Michael, and Simon Loretz. 2013. What Do We Know About Corporate Tax Competition? National Tax Journal 66: 745–74. [Google Scholar] [CrossRef]
- Diciunaite-Rauktiene, Ruta, Virginija Gurskiene, Marija Burinskiene, and Vida Maliene. 2018. The Usage and Perception of Pedestrian Zones in Lithuanian Cities: Multiple Criteria and Comparative Analysis. Sustainability 10: 818. [Google Scholar] [CrossRef]
- Economic and Social Committee. 1997. Opinion of the Economic and Social Committee on ‘Taxation in the European Union—Report on the development of tax systems’. Official Journal of the European Communities C 296: 37–51. [Google Scholar]
- European Commission. 1980. Report from the Commission to the Council on Scope for Convergence of Tax Systems in the Community. Brussels: Office for Official Publications of the European Communities. [Google Scholar]
- European Commission. 2010. Monitoring Tax Revenues and Tax Reforms in EU Member States. Brussels: European Union. [Google Scholar]
- Filardo, Andrew, Jason George, Mico Loretan, Guonan Ma, Anella Munro, Ilhyock Shim, Philip Wooldridge, James Yetman, and Haibin Zhu. 2009. The International Financial Crisis and Policy Challenges in Asia and the Pacific. Basel: Bank for International Settlements. [Google Scholar]
- Fischel, William. 1975. Fiscal and Environmental Considerations in the Location of Firms in Suburban Communities. In Fiscal Zoning and Land Use Controls. Edited by Edwin Mills and Wallace Oates. Lexington: D. C. Heath, pp. 119–74. [Google Scholar]
- Garrett, Geoffrey, and Deborah Mitchell. 2001. Globalization, Government Spending and Taxation in the OECD. European Journal of Political Research 39: 145–77. [Google Scholar] [CrossRef]
- Goodspeed, Timothy. 1998. Tax Competition, Benefit Taxes, and Fiscal Federalism. National Tax Journal 51: 579–86. [Google Scholar]
- Graham, John R., and Daniel A. Rogers. 2002. Do Firms Hedge in Response to Tax Incentives? Journal of Finance 57: 815–39. [Google Scholar] [CrossRef]
- Graham, John R., and Clifford W. Smith. 1999. Tax Incentives to Hedge. Journal of Finance 54: 2241–62. [Google Scholar] [CrossRef]
- Guenther, David, Steven Matsunaga, and Brian Williams. 2013. Tax Avoidance, Tax Aggressiveness, Tax Risk and Firm Risk. Working paper. Eugene: University of Oregon, pp. 1–42. [Google Scholar]
- Hanlon, Michelle, and Joel Slemrod. 2009. What does tax aggressiveness signal? Evidence from stock price reactions to news about tax shelter involvement. Journal of Public Economics 93: 126–41. [Google Scholar] [CrossRef]
- Hossein Razavi, Seyed, Shide Sadat Hashemi, and Edmundas Kazimieras Zavadskas. 2013. Prioritization of Export Promotion Programs by Fuzzy Linear Assignment Method. Engineering Economics 23. [Google Scholar] [CrossRef]
- Jacyna-Gołda, Ilona, Mariusz Izdebski, and Askoldas Podviezko. 2017. Assessment of Efficiency of Assignment of Vehicles to Tasks in Supply Chains: A Case Study of a Municipal Company. Transport 32: 243–251. [Google Scholar] [CrossRef]
- Kendall, Maurice. 1955. Rank Correlation Methods. New York: Hafner Publishing House. [Google Scholar]
- Kuklyte, Jurate, and Agota Giedre Raisiene. 2018. Assessment of Social Business Model in Lithuania by Using Factor Analysis. In Drivers for Progress in the Global Society. Edited by Agota Giedre Raisiene and Yuriy Bilan. Bologna: Editografika, pp. 35–42. [Google Scholar]
- Langenmayr, Dominika, and Rebecca Lester. 2018. Taxation and Corporate Risk-Taking. The Accounting Review 93: 237–66. [Google Scholar] [CrossRef]
- Llanes, Gregorio Izquierdo. 1999. Harmonization and Tax Competition: Efficiency versus Fairness. Diskussionsbeiträge 2: 1–20. [Google Scholar]
- Maliene, Vida, Robert Dixon-Gough, and Naglis Malys. 2018. Dispersion of Relative Importance Values Contributes to the Ranking Uncertainty: Sensitivity Analysis of Multiple Criteria Decision-Making Methods. Applied Soft Computing 67: 286–98. [Google Scholar] [CrossRef]
- Mulliner, Emma, Naglis Malys, and Vida Maliene. 2016. Comparative Analysis of MCDM Methods for the Assessment of Sustainable Housing Affordability. Omega 59: 146–56. [Google Scholar] [CrossRef]
- Neuman, Stevanie, Thomas Omer, and Andrew Schmidt. 2013. Risk and Return: Does Tax Risk Reduce Firms’ Effective Tax Rates? Texas A&M University, University of Nebraska-Lincoln, North Carolina State University Working paper. Raleigh: North Carolina State University, pp. 1–69. [Google Scholar]
- Palevicius, Vytautas, Vytautas Grigonis, Askoldas Podviezko, and Greta Barauskaitė. 2016. Developmental Analysis of Park-and-Ride Facilities in Vilnius. Promet Traffic Traffico 28: 163–76. [Google Scholar] [CrossRef]
- Palevicius, Vytautas, Henrikas Sivilevicius, Askoldas Podviezko, Ausrine Griskeviciute-Geciene, and Tomas Karpavicius. 2017. Evaluation of Park and Ride Facilities at Communication Corridors in a Middle-Sized City. Economic Computation & Economic Cybernetics Studies & Research 51: 231–48. [Google Scholar] [CrossRef]
- Palevicius, Vytautas, Askoldas Podviezko, Henrikas Sivilevicius, and Olegas Prentkovskis. 2018. Decision-Aiding Evaluation of Public Infrastructure for Electric Vehicles in Cities and Resorts of Lithuania. Sustainability 10: 904. [Google Scholar] [CrossRef]
- Panskov, Vladimir. 2013. Tax Risks: Manifestation and Possible Ways of Risk Minimization. Economics, Taxes & Law 4: 74–80. [Google Scholar]
- Parfenova, Lyudmila, Andrey Pugachev, and Askoldas Podviezko. 2016. Comparative Analysis of Tax Capacity in Regions of Russia. Technological and Economic Development of Economy 22: 905–25. [Google Scholar] [CrossRef]
- Podviezko, Askoldas. 2012. Augmenting Multicriteria Decision Aid Methods by Graphical and Analytical Reporting Tools. In Lecture Notes in Business Information Processing. Edited by Laila Niedrite, Renate Strazdina and Benkt Wangler. Berlin and Heidelberg: Springer Verlag, vol. 106, pp. 236–51. [Google Scholar]
- Podviezko, Askoldas. 2016. On Multiple Dimensions of Criteria Representing Financial Globalisation. In 9th International Scientific Conference “Business and Management 2016”. Edited by Jelena Stankeviciene and Toma Lankauskiene. Vilnius: Technika, pp. 1–8. [Google Scholar] [CrossRef]
- Podvezko, Valentinas, and Askoldas Podviezko. 2010a. Use and Choice of Preference Functions for Evaluation of Characteristics of Socio-Economical Processes. In The 6th International Scientific Conference “Business and Management 2010”. Selected Papers. Edited by Romualdas Ginevicius, Aleksandras Rutkauskas and Remigijs Pocs. Vilnius: Technika, pp. 1066–71. [Google Scholar]
- Podvezko, Valentinas, and Askoldas Podviezko. 2010b. Dependence of Multi-criteria Evaluation Result on Choice of Preference Functions and Their Parameters. Technological and Economic Development of Economy 16: 143–58. [Google Scholar] [CrossRef]
- Podviezko, Askoldas, and Romualdas Ginevicius. 2010. Economic Criteria Characterising Bank Soundness and Stability. In The 6th International Scientific Conference “Business and Management 2010”. Selected Papers. Edited by Romualdas Ginevicius, Aleksandras Rutkauskas and Remigijs Pocs. Vilnius: Technika, pp. 1072–79. [Google Scholar]
- Podviezko, Askoldas, and Valentinas Podvezko. 2014. Absolute and Relative Evaluation of Socio-Economic Objects Based on Multiple Criteria Decision Making Methods. Engineering Economics 25: 522–29. [Google Scholar] [CrossRef]
- Poterba, James, and Andrew Samwick. 2002. Taxation and household portfolio composition: Us evidence from the 1980s and 1990s. Journal of Public Economics 87: 5–38. [Google Scholar] [CrossRef]
- Pugachev, Andrey. 2014. Discussion Problems of the Tax Nature: Definition on the Example of Tax Competition and Regional Tax Rotational. Vestnik of Tver State University. Series: Economy and Management 23: 77–86. [Google Scholar]
- Pugachev, Andrey, Lyudmila Parfenova, Dmitry Vakhrushev, Andrey Volkov, and Andrey Kalsin. 2017. Minimization of the Competitive Risk of the Tax System for Improving Public Administration at National and Regional Levels. European Research Studies Journal XX: 515–30. [Google Scholar]
- Raisiene, Agota Giedre. 2015. Business and Management Success: What Course Is Supported by Sustainable Organization Managers. Transformations in Business & Economics 3: 68–91. [Google Scholar]
- Ranjan, Rajeev, Prasenjit Chatterjee, and Shankar Chakraborty. 2016. Performance Evaluation of Indian States in Tourism Using an Integrated PROMETHEE-GAIA Approach. Opsearch 53: 63–84. [Google Scholar] [CrossRef]
- Remeur, Cécile. 2015. Tax Policy in the EU: Issues and Challenges. Brussels: European Parliament. [Google Scholar]
- Richter, Wolfram F., and Dietmar Wellisch. 1996. The Provision of Local Public Goods and Factors in the Presence of Firm and Household Mobility. Journal of Public Economics 60: 73–93. [Google Scholar] [CrossRef]
- Schadler, Susan, Paulo Drummond, Louis Kuijs, Zuzana Murgasova, and Rachel van Elkan. 2005. Adopting the Euro in Central Europe: Challenges of the Next Step in European Integration. Washington, DC: International Monetary Fund. [Google Scholar]
- Schratzenstaller, Margit. 2011. From Tax Competition to Tax Consolidation in the EU? WSI-Messages 6: 304–13. [Google Scholar] [CrossRef]
- Shackelford, Douglas A., Joel Slemrod, and James M. Sallee. 2011. Financial Reporting, Tax, and Real Decisions: Toward a Unifying Framework. International Tax and Public Finance 18: 461–94. [Google Scholar] [CrossRef]
- Swank, Duane. 2016. The New Political Economy of Taxation in the Developing World. Review of International Political Economy 23: 185–207. [Google Scholar] [CrossRef]
- Taylor, Lori L. 1993. Allocative Inefficiency and Local Government: Evidence Rejecting the Tiebout Hypothesis. Federal Reserve Bank of Dallas Research Paper 9319: 1–21. [Google Scholar]
- Tiebout, Charles M. 1956. A Pure Theory of Local Expenditures. Journal of Political Economy 64: 416–24. [Google Scholar] [CrossRef]
- White, Michelle. 1975. Firm Location in a Zoned Metropolitan Area. In Fiscal Zoning and Land Use Controls. Edited by E Mills and W Oates. Lexington: D. C. Heath, pp. 175–201. [Google Scholar]
- Wunder, Haroldene. 2009. Tax risk management and the multinational enterprise. Journal of International Accounting Auditing & Taxation 18: 14–28. [Google Scholar]
- Zavadskas, Edmundas Kazimieras, and Valentinas Podvezko. 2016. Integrated Determination of Objective Criteria Weights in MCDM. International Journal of Information Technology & Decision Making 15: 267–83. [Google Scholar] [CrossRef]
Figure 1.
Dynamics of the corporate tax in the EU.

Table 1.
The corporate income tax rate dynamics in the EU, 1995–2018.
| Country | 1995 | 2000 | 2005 | 2008 | 2009 | 2010 | 2014 | 2015 | 2016 | 2017 | 2018 | 1995–2018 | 2008–2018 |
|---|---|---|---|---|---|---|---|---|---|---|---|---|---|
| Belgium | 40.2 | 40.2 | 34.0 | 34.0 | 34.0 | 34.0 | 34.0 | 34.0 | 34.0 | 34.0 | 29.0 | −11.2 | −5.0 |
| Denmark | 34.0 | 32.0 | 28.0 | 25.0 | 25.0 | 25.0 | 24.5 | 23.5 | 22.0 | 22.0 | 22.0 | −12.0 | −3.0 |
| Finland | 25.0 | 29.0 | 26.0 | 26.0 | 26.0 | 26.0 | 20.0 | 20.0 | 20.0 | 20.0 | 20.0 | −5.0 | −6.0 |
| Germany | 56.8 | 51.6 | 38.6 | 29.5 | 29.4 | 29.4 | 29.6 | 29.7 | 29.7 | 30.2 | 30.0 | −26.8 | 0.5 |
| Greece | 40.0 | 40.0 | 32.0 | 25.0 | 25.0 | 24.0 | 26.0 | 29.0 | 29.0 | 29.0 | 29.0 | −11.0 | 4.0 |
| Spain | 35.0 | 35.0 | 35.0 | 30.0 | 30.0 | 30.0 | 30.0 | 28.0 | 25.0 | 25.0 | 25.0 | −10.0 | −5.0 |
| France | 36.7 | 36.7 | 35.0 | 33.3 | 33.3 | 33.3 | 33.3 | 33.3 | 33.3 | 33.3 | 33.0 | −3.7 | −0.3 |
| Ireland | 40.0 | 24.0 | 12.5 | 12.5 | 12.5 | 12.5 | 12.5 | 12.5 | 12.5 | 12.5 | 12.5 | −27.5 | 0 |
| Italy | 52.2 | 41.3 | 37.3 | 31.4 | 31.4 | 31.4 | 31.4 | 31.4 | 31.4 | 24.0 | 24.0 | −28.2 | −7.4 |
| Luxembourg | 40.9 | 37.5 | 30.4 | 29.6 | 28.6 | 28.6 | 29.2 | 29.2 | 29.2 | 27.1 | 26.0 | −14.9 | −3.6 |
| Netherlands | 35.0 | 35.0 | 31.5 | 25.5 | 25.5 | 25.5 | 25.0 | 25.0 | 25.0 | 25.0 | 25.0 | −10.0 | −0.5 |
| Austria | 34.0 | 34.0 | 25.0 | 25.0 | 25.0 | 25.0 | 25.0 | 25.0 | 25.0 | 25.0 | 25.0 | −9.0 | 0 |
| Portugal | 39.6 | 35.2 | 27.5 | 25.0 | 25.0 | 25.0 | 23.0 | 23.0 | 21.0 | 21.0 | 21.0 | −18.6 | −4.0 |
| Sweden | 28.0 | 28.0 | 28.0 | 28.0 | 26.3 | 26.3 | 22.0 | 22.0 | 22.0 | 22.0 | 22.0 | −6.0 | −6.0 |
| U.K. | 33.0 | 33.0 | 30.0 | 30.0 | 28.0 | 28.0 | 21.0 | 20.0 | 20.0 | 19.0 | 19.0 | −14.0 | −11.0 |
| Average (EU-15) | 38.0 | 35.5 | 30.1 | 27.3 | 27.0 | 26.9 | 25.8 | 25.7 | 25.3 | 24.6 | 24.2 | −13.9 | −3.2 |
| Czech Republic | 41.0 | 31.0 | 26.0 | 21.0 | 20.0 | 19.0 | 19.0 | 19.0 | 19.0 | 19.0 | 19.0 | −22.0 | −2.0 |
| Estonia | 26.0 | 26.0 | 24.0 | 21.0 | 21.0 | 21.0 | 21.0 | 20.0 | 20.0 | 20.0 | 20.0 | −6.0 | −1.0 |
| Latvia | 25.0 | 25.0 | 15.0 | 15.0 | 15.0 | 15.0 | 15.0 | 15.0 | 15.0 | 15.0 | 20.0 | −5.0 | 5.0 |
| Lithuania | 29.0 | 24.0 | 15.0 | 15.0 | 20.0 | 15.0 | 15.0 | 15.0 | 15.0 | 15.0 | 15.0 | −14.0 | 0 |
| Hungary | 19.6 | 19.6 | 16.0 | 16.0 | 16.0 | 19.0 | 19.0 | 19.0 | 19.0 | 9.0 | 9.0 | −10.6 | −7.0 |
| Slovenia | 25.0 | 25.0 | 25.0 | 22.0 | 21.0 | 20.0 | 17.0 | 17.0 | 17.0 | 19.0 | 19.0 | −6.0 | −3.0 |
| Slovakia | 40.0 | 29.0 | 19.0 | 19.0 | 19.0 | 19.0 | 22.0 | 22.0 | 22.0 | 21.0 | 21.0 | −19.0 | 2.0 |
| Poland | 40.0 | 30.0 | 19.0 | 19.0 | 19.0 | 19.0 | 19.0 | 19.0 | 19.0 | 19.0 | 19.0 | −21.0 | 0 |
| Malta | 35.0 | 35.0 | 35.0 | 35.0 | 35.0 | 35.0 | 35.0 | 35.0 | 35.0 | 35.0 | 35.0 | 0 | 0 |
| Cyprus | 25.0 | 29.0 | 10.0 | 10.0 | 10.0 | 10.0 | 12.5 | 12.5 | 12.5 | 12.5 | 12.5 | −12.5 | 2.5 |
| Bulgaria | 40.0 | 35.0 | 15.0 | 10.0 | 10.0 | 10.0 | 10.0 | 10.0 | 10.0 | 10.0 | 10.0 | −30.0 | 0 |
| Romania | 38.0 | 38.0 | 16.0 | 16.0 | 16.0 | 16.0 | 16.0 | 16.0 | 16.0 | 16.0 | 16.0 | −22.0 | 0 |
| Croatia | 25.0 | 35.0 | 20.0 | 20.0 | 20.0 | 20.0 | 20.0 | 20.0 | 20.0 | 20.0 | 18.0 | −7.0 | −2.0 |
| Average (EU-13) | 31.4 | 29.4 | 19.6 | 18.4 | 18.6 | 18.3 | 18.5 | 18.4 | 18.4 | 17.7 | 18.0 | −13.5 | −0.4 |
Source: KPMG, Corporate tax rates table.
Table 2.
Hierarchy structure of the tax competitiveness criteria.
| Category | Criterion | Direction |
|---|---|---|
| Tax burden | 1. Income tax, % | min |
| 2. Profit tax, % | min | |
| Settlement convenience | 3. Number of payments required for settlement with tax authorities | min |
| Quality of tax system governance | 4. Time required to prepare a tax report, hours | min |
| 5. Ease of doing business, Rank | min | |
| Growth rate | 6. Average Annual Growth of the Gross Domestic Product 2009–2015, % | max |
| Remuneration of labor | 7. Labor costs per hour, in euros | min |
| Level of corruption | 8. Corruption Index | min |
Table 3.
Values of criteria of the tax competitiveness.
| Criteria | 1 | 2 | 3 | 4 | 5 | 6 | 7 | 8 | |
|---|---|---|---|---|---|---|---|---|---|
| Countries | |||||||||
| Northern Europe | |||||||||
| Sweden | 35.4 | 13.1 | 6 | 122 | 10 | 2.9 | 40.0 | 0.335 | |
| Lithuania | 35.2 | 5.9 | 11 | 109 | 16 | 3.6 | 6.9 | 2401 | |
| Western Europe | |||||||||
| Germany | 21.4 | 23.2 | 9 | 218 | 20 | 1.8 | 32.7 | 0.741 | |
| France | 51.1 | 0.7 | 9 | 139 | 31 | 1.0 | 35.7 | 1.214 | |
| Central and Eastern Europe | |||||||||
| Poland | 25.0 | 14.5 | 7 | 260 | 27 | 2.9 | 8.4 | 2.179 | |
| Bulgaria | 20.2 | 5.0 | 14 | 453 | 50 | 1.2 | 4.1 | 2.803 | |
| Southern Europe | |||||||||
| Spain | 36.5 | 10.6 | 9 | 152 | 28 | −0.6 | 21.1 | 1.478 | |
| Italy | 23.2 | 23.3 | 14 | 238 | 46 | −0.6 | 27.3 | 2.305 | |
Table 4.
Data sources.
| Criteria | Source |
|---|---|
| 1. Income tax, % | PwC, the World Bank and International Finance Corporation (2017) |
| 2. Profit tax, % | PwC, the World Bank and International Finance Corporation (2017) |
| 3. Number of payments required for settlement with tax authorities | PwC, the World Bank and International Finance Corporation (2017) |
| 4. Time required to prepare a tax report, hours | PwC, the World Bank and International Finance Corporation (2017) |
| 5. Ease of Doing Business, Rank | World Bank (2019) |
| 6. Average Annual Growth of the Gross Domestic Product 2009–2015, % | World Bank (2017) |
| 7. Labor costs per hour, in euros | Eurostat (2017) |
| 8. Corruption Index | European Added Value Unit (2016) |
Table 5.
Classification of the chosen countries.
| Region | Country | Quantity |
|---|---|---|
| Northern Europe | Sweden, Lithuania | 2 |
| Western Europe | Germany, France | 2 |
| Central and Eastern Europe | Poland, Bulgaria | 2 |
| Southern Europe | Spain, Italy | 2 |
| Total | 8 |
Table 6.
Values of macroeconomic variables.
| Criteria | The Budget Deficit/Surplus to GDP, 2017 | Government Debt to GDP, 2017, % | Government Expenditure to GDP, 2016 | |
|---|---|---|---|---|
| Countries | ||||
| Northern Europe | ||||
| Sweden | 1.6 | 40.8 | 49.4 | |
| Lithuania | 0.5 | 39.4 | 34.2 | |
| Western Europe | ||||
| Germany | 1.0 | 63.9 | 44.2 | |
| France | −2.7 | 98.5 | 56.4 | |
| Central and Eastern Europe | ||||
| Poland | −1.4 | 50.6 | 41.2 | |
| Bulgaria | 1.1 | 25.6 | 35.0 | |
| Southern Europe | ||||
| Spain | −3.1 | 98.1 | 42.2 | |
| Italy | −2.4 | 131.2 | 49.4 | |
Source: Eurostat.
Table 7.
Weights elicited from experts, %.
| Expert | 1 | 2 | 3 | 4 | 5 | 6 | 7 | 8 | 9 | 10 | Final Weights | |
|---|---|---|---|---|---|---|---|---|---|---|---|---|
| Criteria | ||||||||||||
| 1 | 10 | 20 | 22 | 5 | 5 | 12 | 18 | 20 | 10 | 15 | 13.7 | |
| 2 | 30 | 20 | 22 | 12 | 9 | 17 | 7 | 25 | 20 | 18 | 18 | |
| 3 | 5 | 5 | 7 | 4 | 2 | 3 | 12 | 5 | 9 | 5 | 5.7 | |
| 4 | 7 | 5 | 6 | 8 | 1 | 10 | 9 | 10 | 6 | 5 | 6.7 | |
| 5 | 8 | 15 | 10 | 20 | 18 | 20 | 20 | 10 | 18 | 7 | 14.6 | |
| 6 | 10 | 10 | 5 | 15 | 27 | 8 | 8 | 10 | 15 | 10 | 11.8 | |
| 7 | 10 | 10 | 12 | 6 | 3 | 5 | 11 | 10 | 10 | 18 | 9.5 | |
| 8 | 20 | 15 | 16 | 30 | 35 | 25 | 15 | 10 | 12 | 22 | 20 | |
Table 8.
Normalized values of criteria.
| Country | Sweden | Lithuania | Germany | France | Poland | Bulgaria | Spain | Italy | |
|---|---|---|---|---|---|---|---|---|---|
| Criteria | |||||||||
| 1 | 0.508 | 0.515 | 0.961 | 0.000 | 0.845 | 1.000 | 0.472 | 0.903 | |
| 2 | 0.451 | 0.770 | 0.004 | 1.000 | 0.389 | 0.810 | 0.562 | 0.000 | |
| 3 | 1.000 | 0.375 | 0.625 | 0.625 | 0.875 | 0.000 | 0.625 | 0.000 | |
| 4 | 0.962 | 1.000 | 0.683 | 0.913 | 0.561 | 0.000 | 0.875 | 0.625 | |
| 5 | 1.000 | 0.850 | 0.750 | 0.475 | 0.575 | 0.000 | 0.550 | 0.100 | |
| 6 | 0.833 | 1.000 | 0.571 | 0.381 | 0.833 | 0.429 | 0.000 | 0.000 | |
| 7 | 0.000 | 0.922 | 0.203 | 0.120 | 0.880 | 1.000 | 0.526 | 0.354 | |
| 8 | 1.000 | 0.163 | 0.835 | 0.644 | 0.253 | 0.000 | 0.537 | 0.202 | |
Table 9.
The normalized decision matrix for the simple additive weighting (SAW) method.
| Criteria | 1 | 2 | 3 | 4 | 5 | 6 | 7 | 8 | |
|---|---|---|---|---|---|---|---|---|---|
| Countries | |||||||||
| Northern Europe | |||||||||
| Sweden | 0.508 | 0.451 | 1.000 | 0.962 | 1.000 | 0.833 | 0.000 | 1.000 | |
| Lithuania | 0.515 | 0.770 | 0.375 | 1.000 | 0.850 | 1.000 | 0.922 | 0.163 | |
| Western Europe | |||||||||
| Germany | 0.961 | 0.004 | 0.625 | 0.683 | 0.750 | 0.571 | 0.203 | 0.835 | |
| France | 0.000 | 1.000 | 0.625 | 0.913 | 0.475 | 0.381 | 0.120 | 0.644 | |
| Central and Eastern Europe | |||||||||
| Poland | 0.845 | 0.389 | 0.875 | 0.561 | 0.575 | 0.833 | 0.880 | 0.253 | |
| Bulgaria | 1.000 | 0.810 | 0.000 | 0.000 | 0.000 | 0.429 | 1.000 | 0.000 | |
| Southern Europe | |||||||||
| Spain | 0.472 | 0.562 | 0.625 | 0.875 | 0.550 | 0.000 | 0.526 | 0.537 | |
| Italy | 0.903 | 0.000 | 0.000 | 0.625 | 0.100 | 0.000 | 0.354 | 0.202 | |
Table 10.
Initial and adjusted parameters q and s.
| Criteria | q-Initial | s-Initial | q-Adjusted | s-Adjusted |
|---|---|---|---|---|
| 1 | 0.2 | 30.9 | 1.7 | 29.4 |
| 2 | 0.1 | 22.6 | 1.2 | 21.5 |
| 3 | 0.0 | 7.0 | 0.4 | 6.7 |
| 4 | 13.0 | 344.0 | 29.6 | 327.5 |
| 5 | 1.0 | 34.0 | 2.7 | 32.4 |
| 6 | 0.0 | 4.2 | 0.2 | 4.0 |
| 7 | 1.5 | 31.6 | 3.0 | 30.1 |
| 8 | 0.2 | 5.1 | 0.5 | 4.9 |
Table 11.
Results of evaluation by the SAW and the PROMETHEE (preference ranking organization method for enrichment evaluation) II methods.
Table 11.
Results of evaluation by the SAW and the PROMETHEE (preference ranking organization method for enrichment evaluation) II methods.
| Criteria | Sj | Rank (SAW) | F− | F+ | F | Rank (PROMETHEE) | |
|---|---|---|---|---|---|---|---|
| Countries | |||||||
| Northern Europe | |||||||
| Sweden | 0.717 | 1 | 0.96 | 1.78 | 0.82 | 2 | |
| Lithuania | 0.660 | 2 | 0.76 | 1.95 | 1.19 | 1 | |
| Western Europe | |||||||
| Germany | 0.577 | 4 | 1.36 | 1.19 | −0.17 | 4 | |
| France | 0.531 | 5 | 1.65 | 1.26 | −0.39 | 5 | |
| Central and Eastern Europe | |||||||
| Poland | 0.590 | 3 | 0.88 | 1.49 | 0.61 | 3 | |
| Bulgaria | 0.428 | 7 | 2.02 | 1.34 | −0.68 | 7 | |
| Southern Europe | |||||||
| Spain | 0.498 | 6 | 1.38 | 0.88 | −0.50 | 6 | |
| Italy | 0.254 | 8 | 2.36 | 1.48 | −0.88 | 8 | |
Table 12.
Values of tax competitiveness criteria for Finland.
| Criteria | 1 | 2 | 3 | 4 | 5 | 6 | 7 | 8 | |
|---|---|---|---|---|---|---|---|---|---|
| Country | |||||||||
| Northern Europe | |||||||||
| Finland | 25.4 | 11.7 | 8 | 93 | 13 | 0.2 | 33.5 | 0.219 | |
© 2019 by the authors. Licensee MDPI, Basel, Switzerland. This article is an open access article distributed under the terms and conditions of the Creative Commons Attribution (CC BY) license (http://creativecommons.org/licenses/by/4.0/).
Share and Cite
MDPI and ACS Style
Podviezko, A.; Parfenova, L.; Pugachev, A. Tax Competitiveness of the New EU Member States. J. Risk Financial Manag. 2019, 12, 34. https://doi.org/10.3390/jrfm12010034
AMA Style
Podviezko A, Parfenova L, Pugachev A. Tax Competitiveness of the New EU Member States. Journal of Risk and Financial Management. 2019; 12(1):34. https://doi.org/10.3390/jrfm12010034
Chicago/Turabian StylePodviezko, Askoldas, Lyudmila Parfenova, and Andrey Pugachev. 2019. "Tax Competitiveness of the New EU Member States" Journal of Risk and Financial Management 12, no. 1: 34. https://doi.org/10.3390/jrfm12010034