Effects of 462 nm Light-Emitting Diode on the Inactivation of Escherichia coli and a Multidrug-Resistant by Tetracycline Photoreaction

 and
and 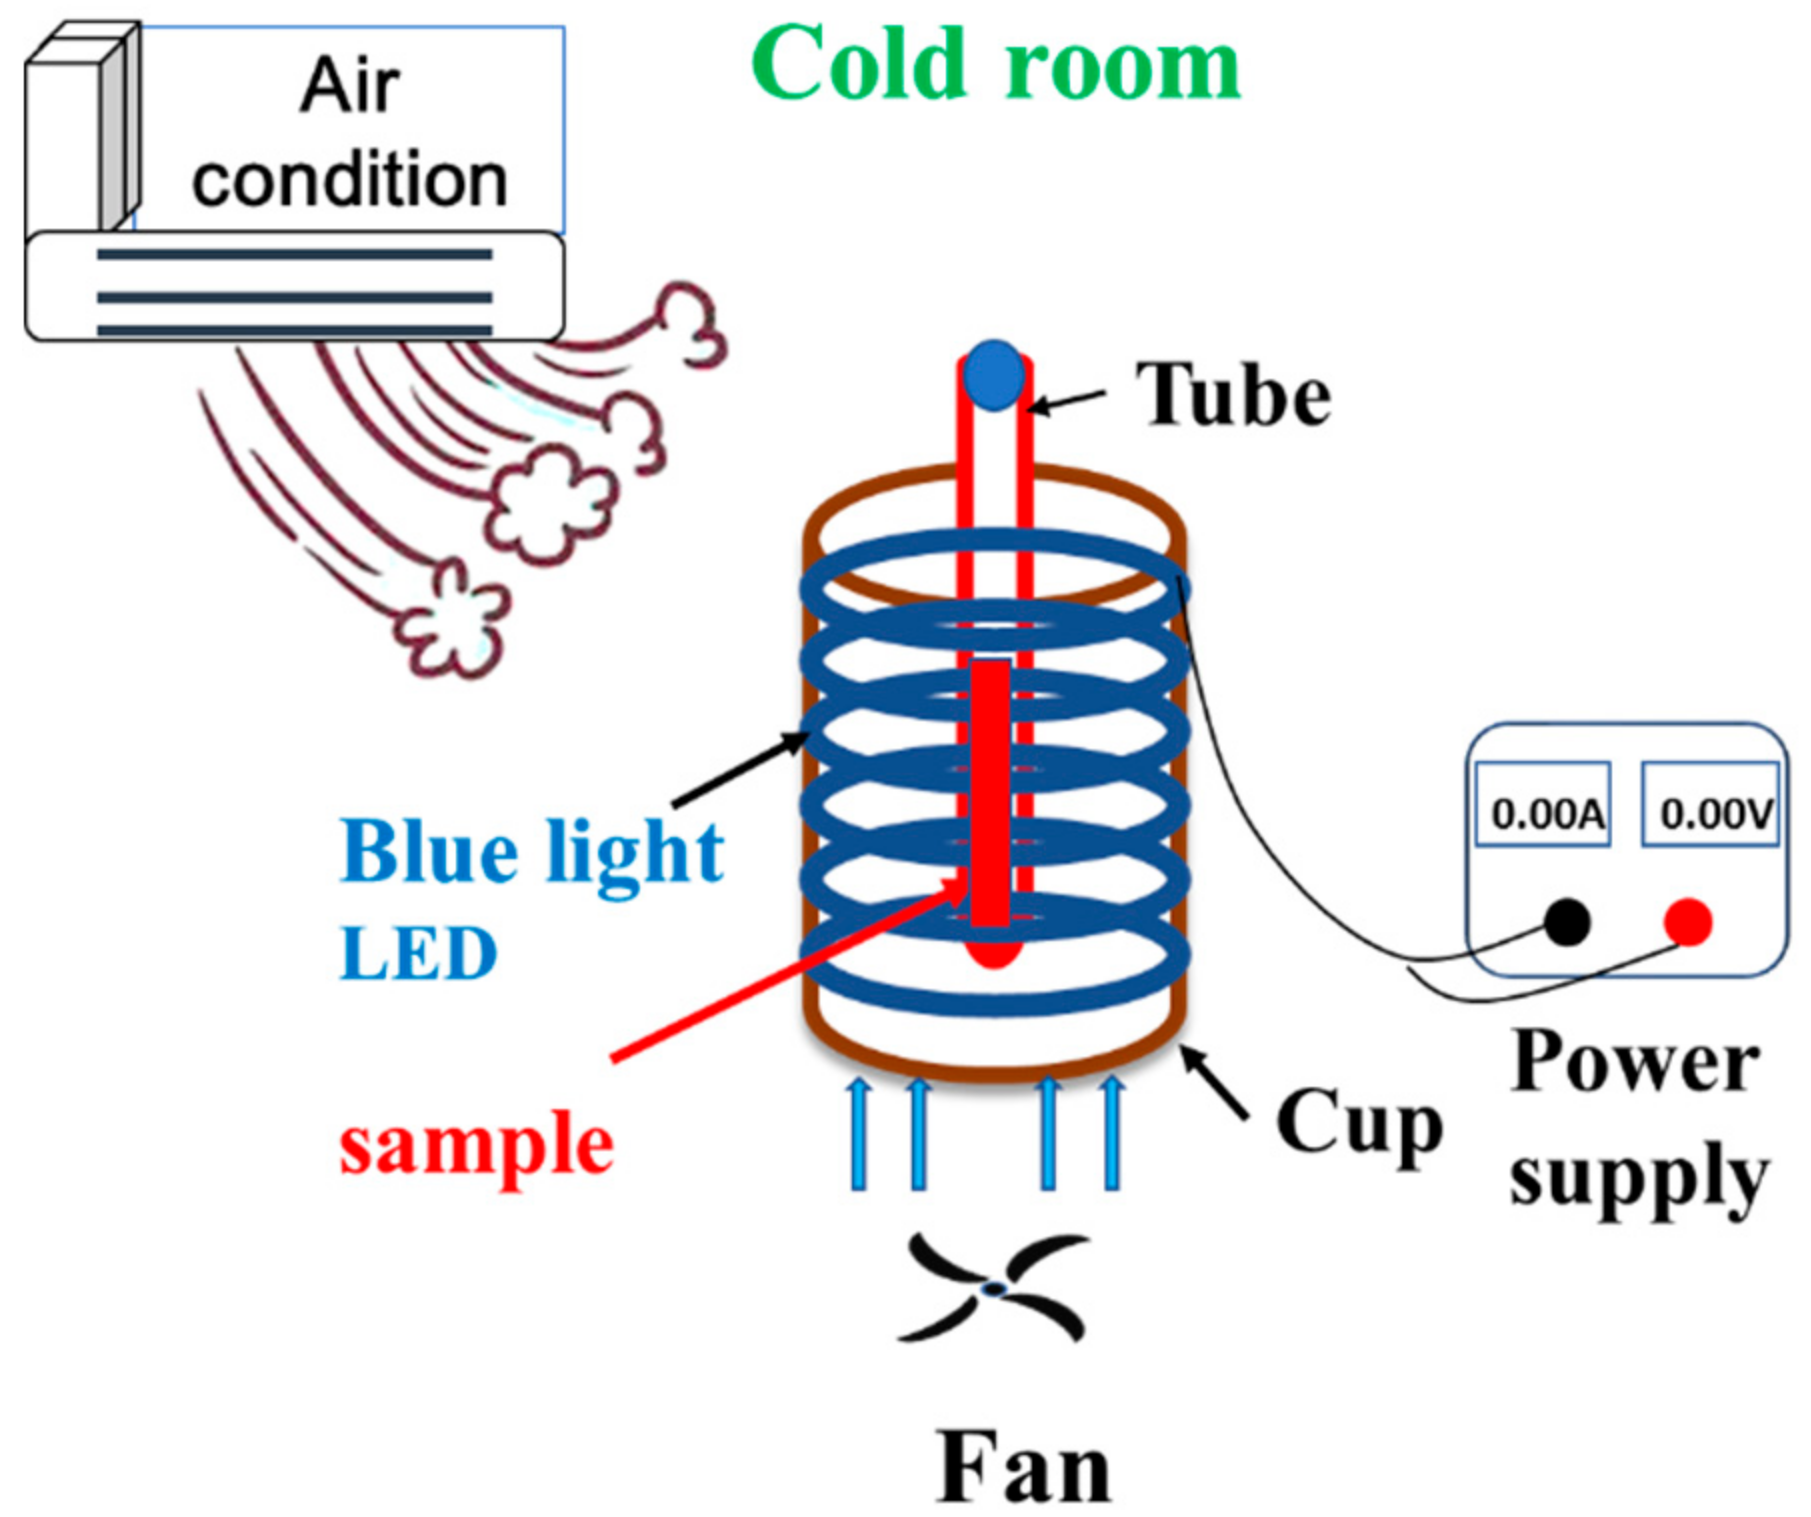
Abstract
:1. Introduction
2. Materials and Methods
2.1. Organization of the Photoreaction System
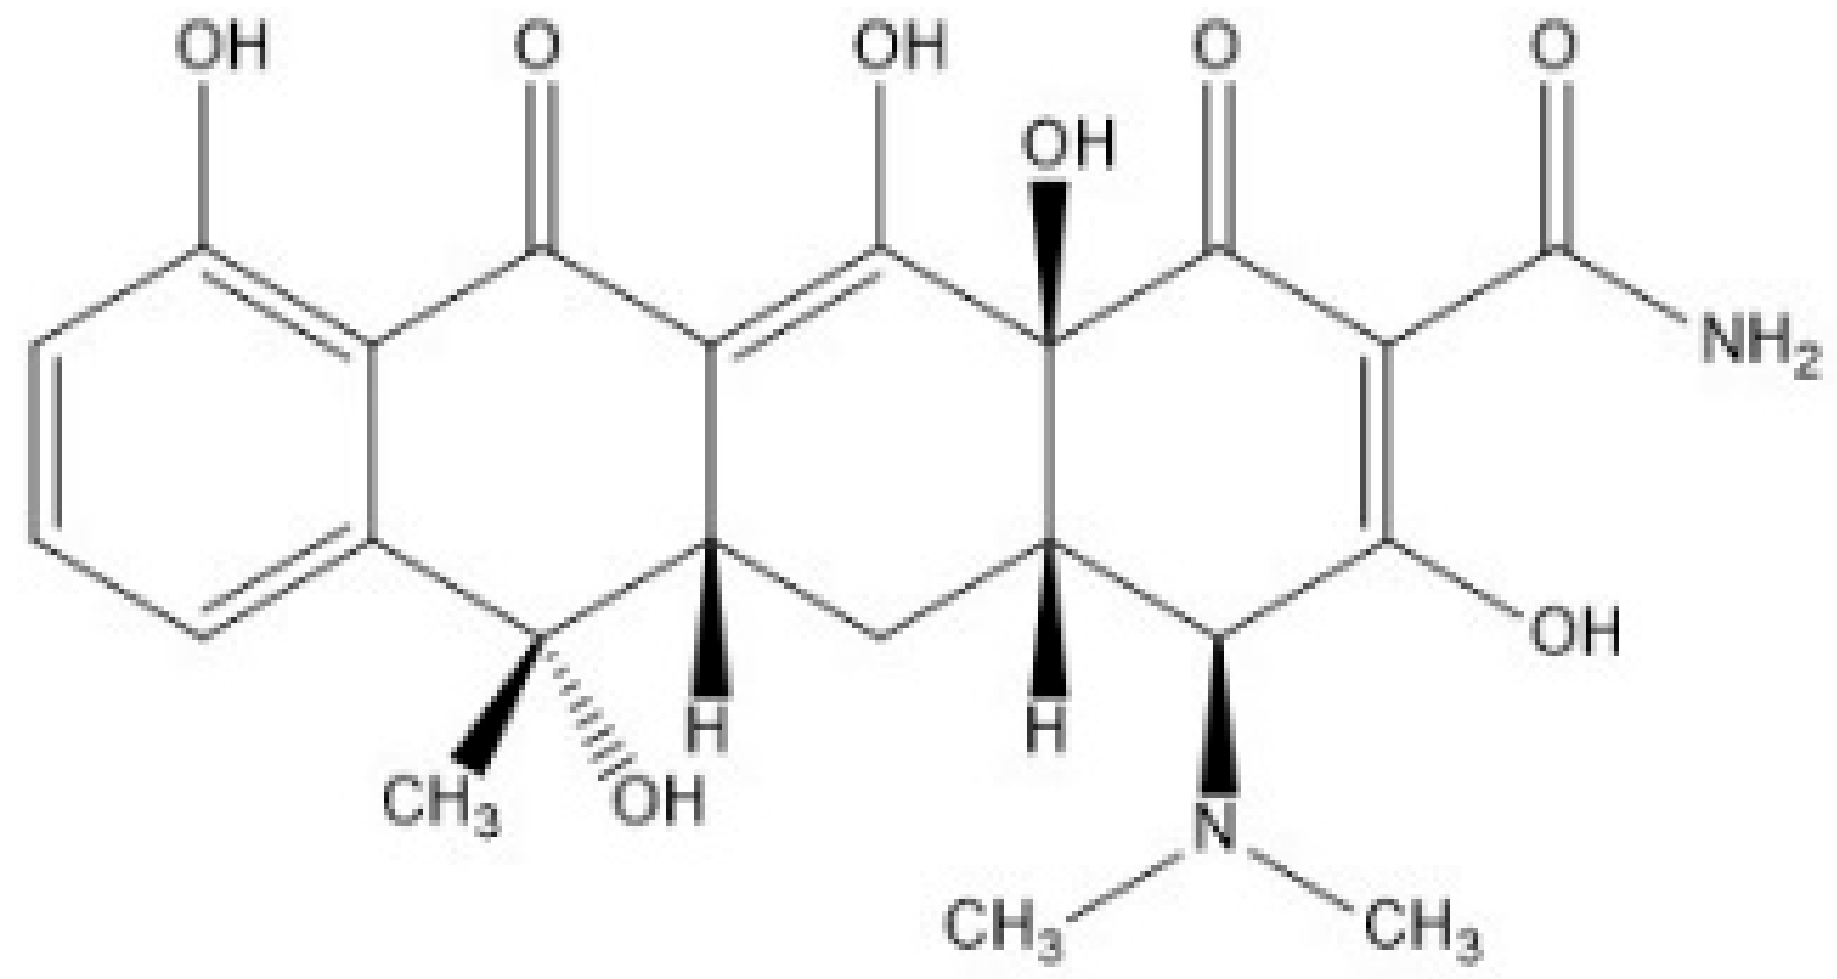
2.2. Chemicals
2.3. Effects of Colour Lights on TC Photolysis
2.4. LC-MS/MS Analysis of TC Photolysis
2.5. Detection of O2•−
2.6. Effects of TC on E. coli and MDR E. coli Under Blue Light Illumination (During Illumination)
2.7. Effects of TC Photo-Products on the Viability of E. coli and MDR E. coli (After Illumination)
2.8. Statistics
3. Results
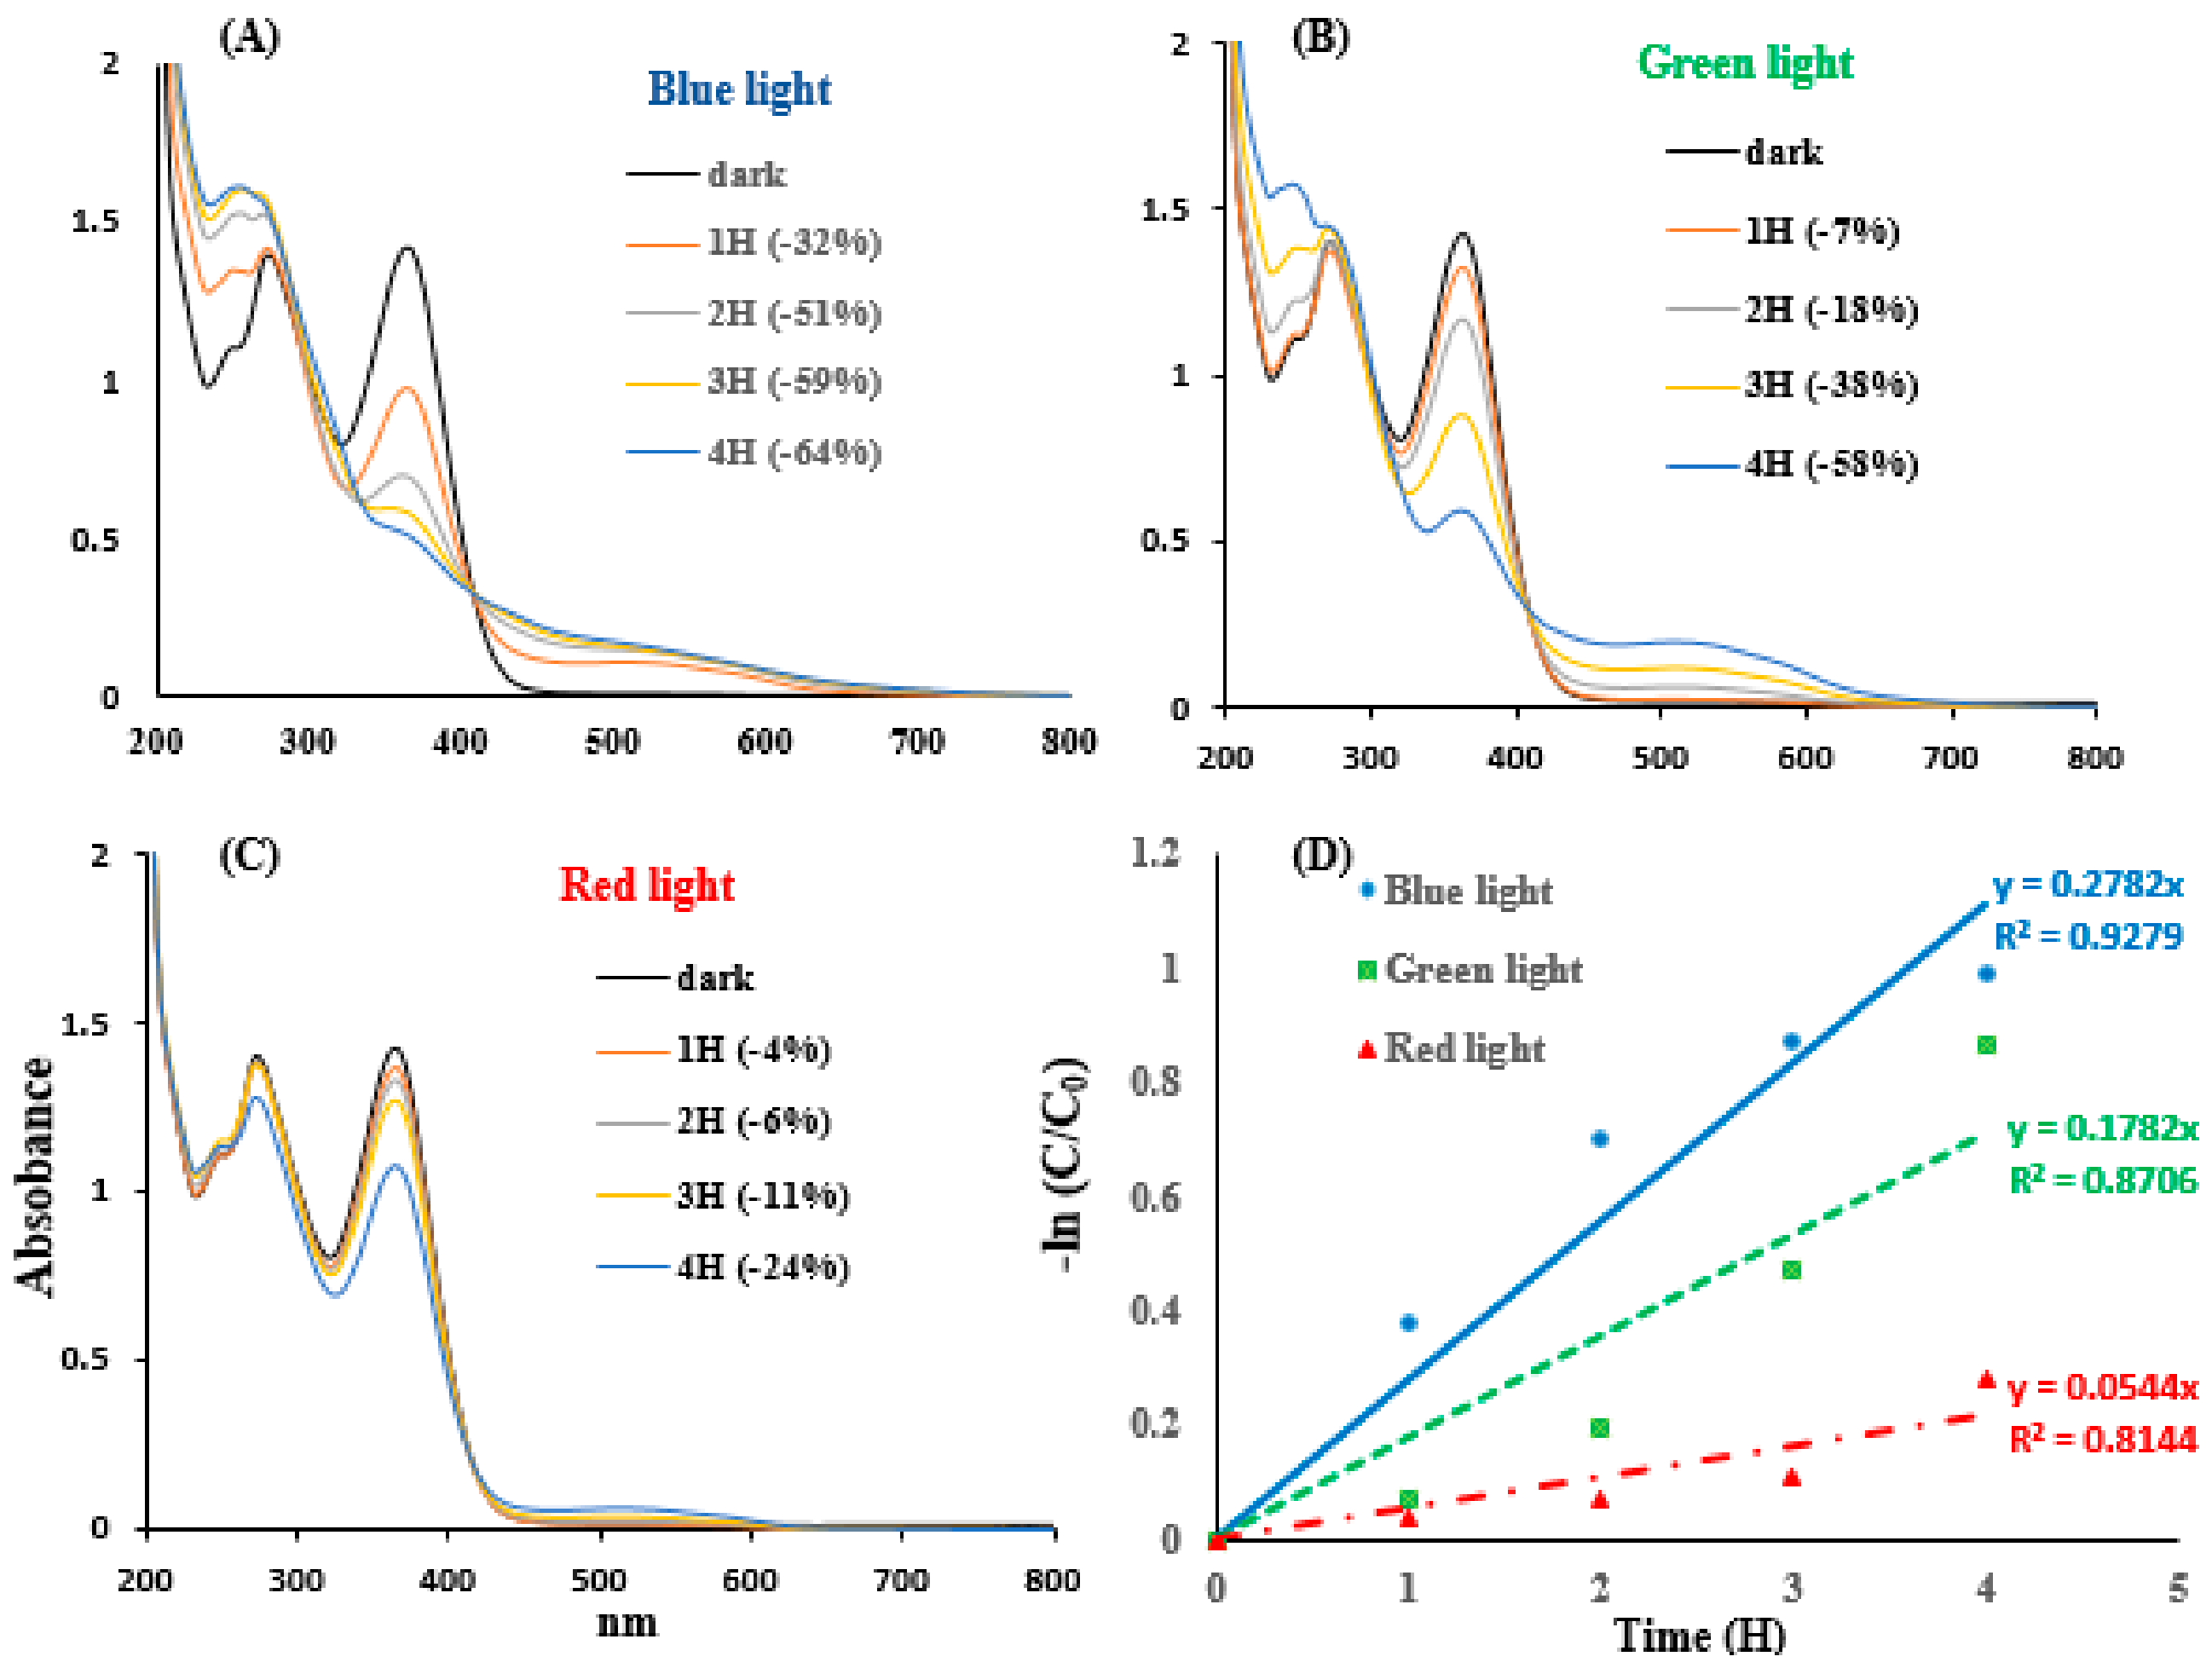
3.1. Effect of Different Wavelengths of Visible Light on the Photolysis of TC
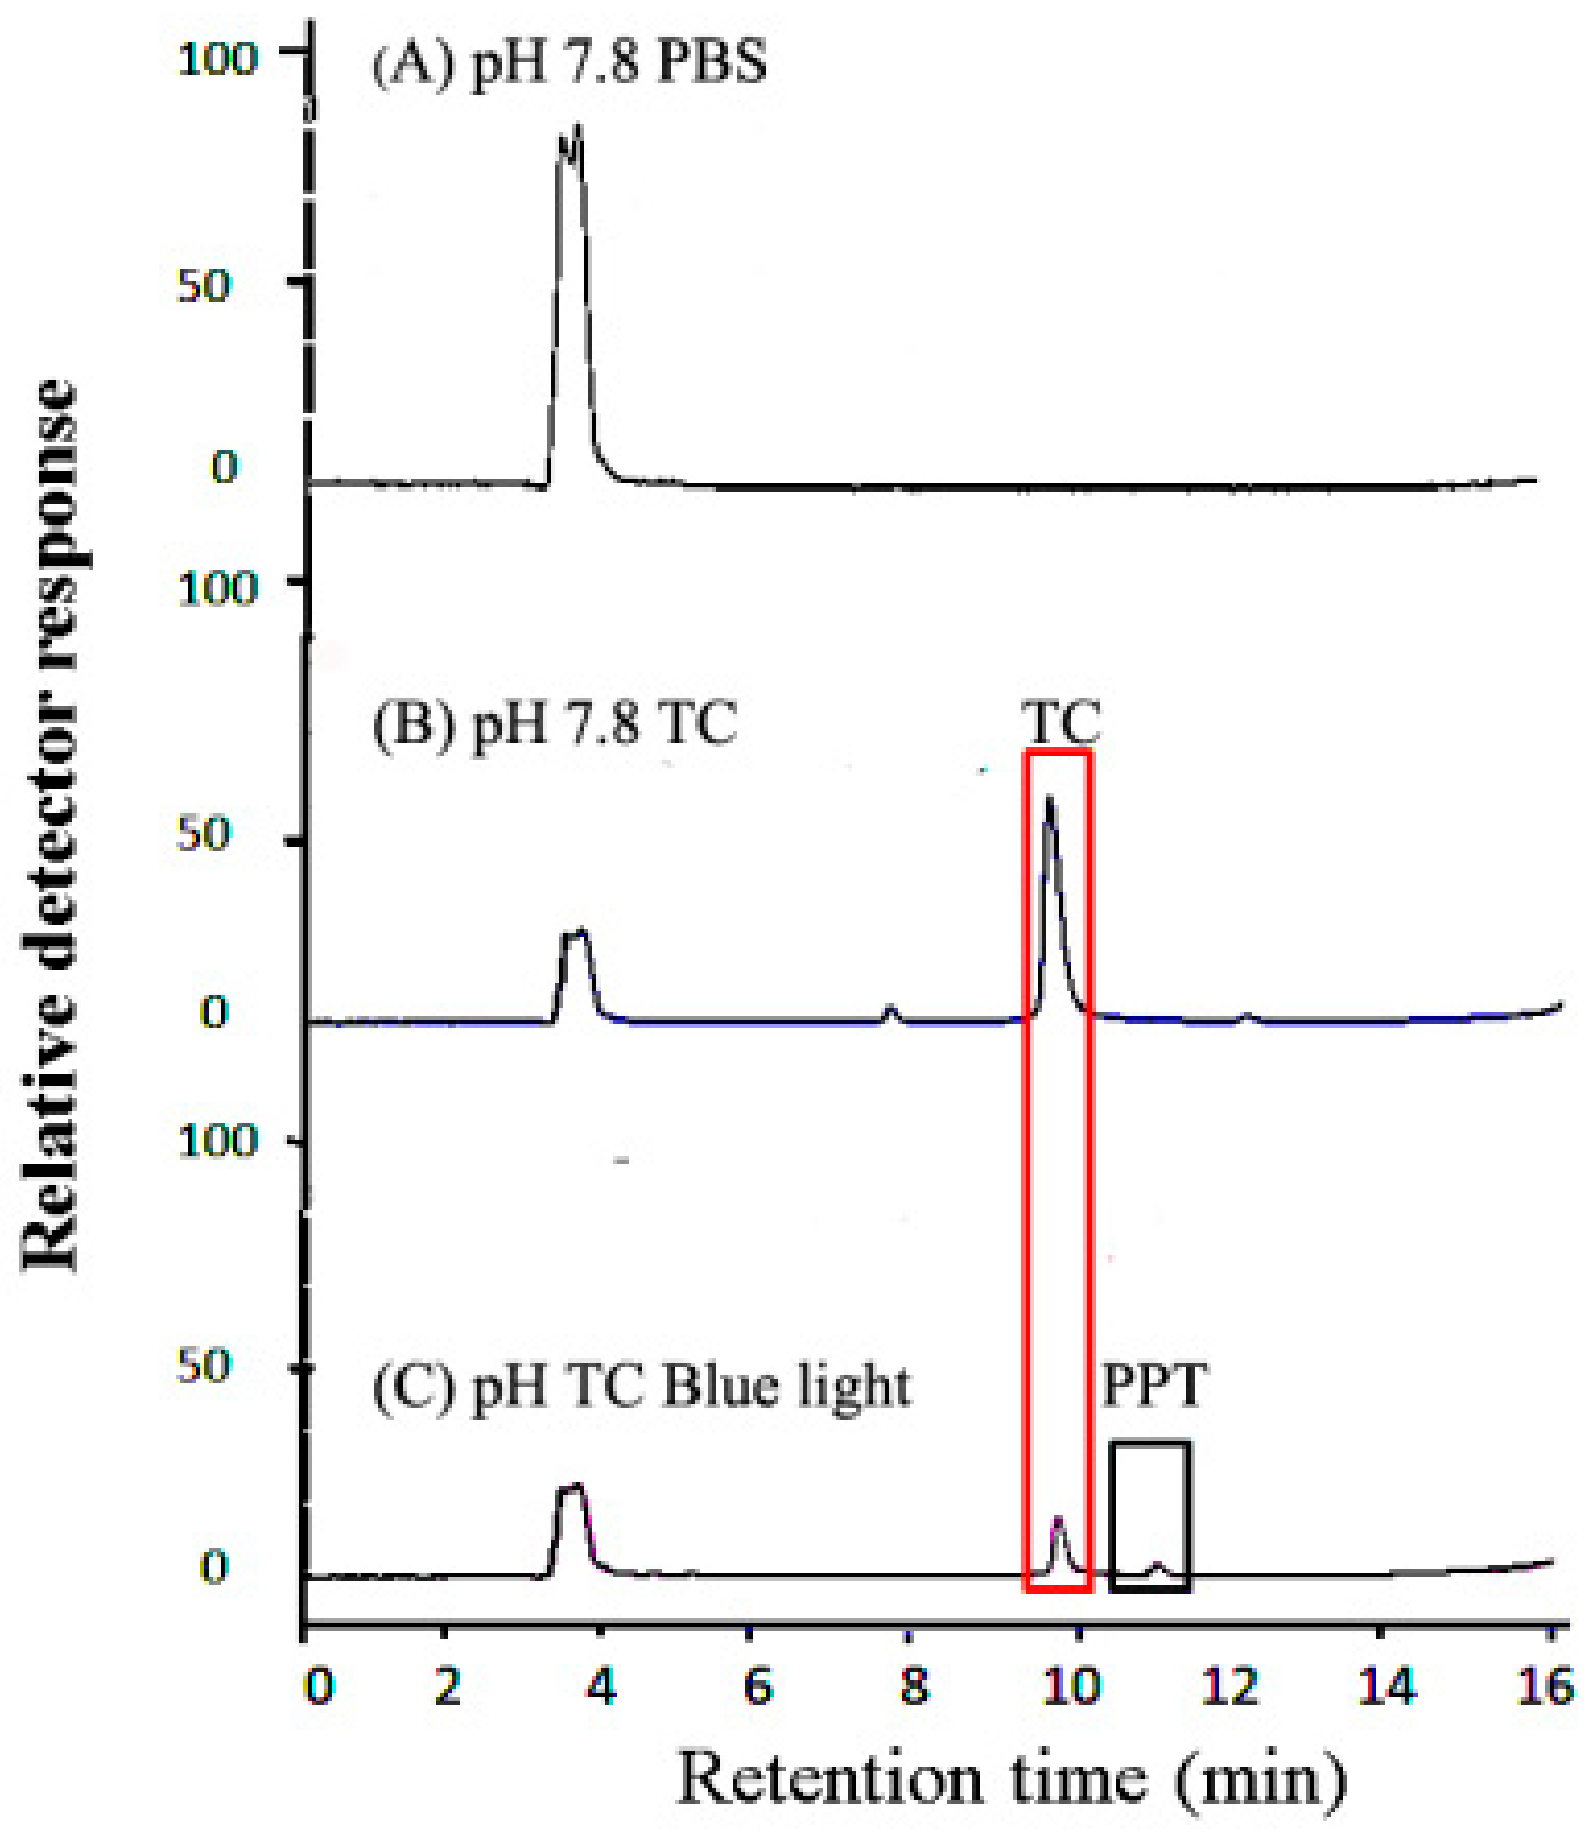
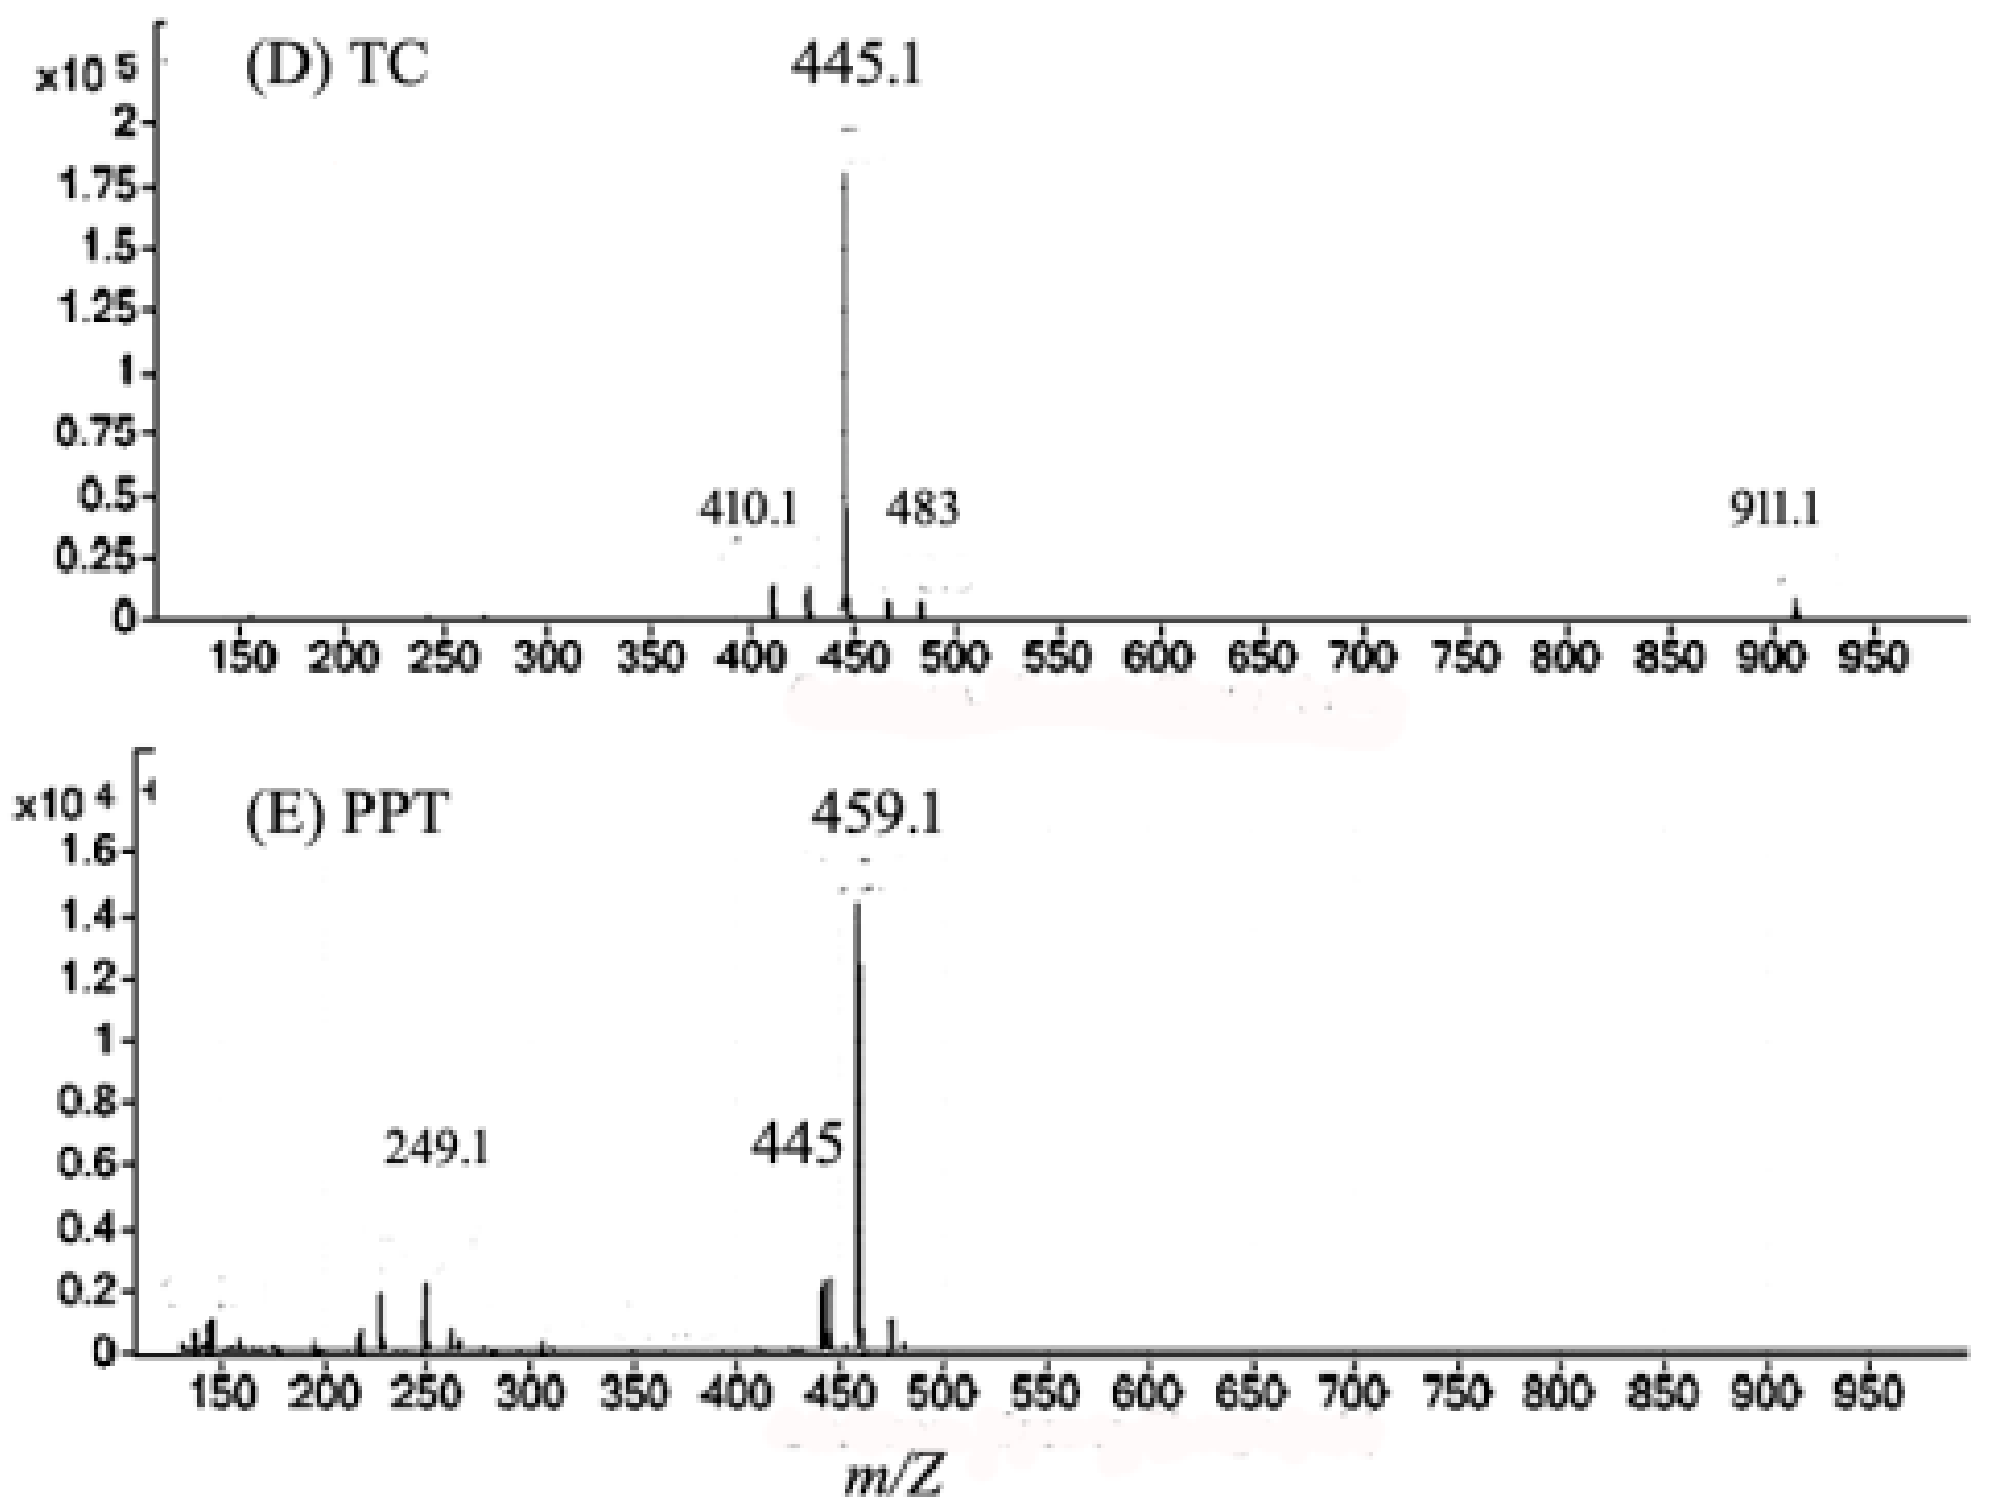
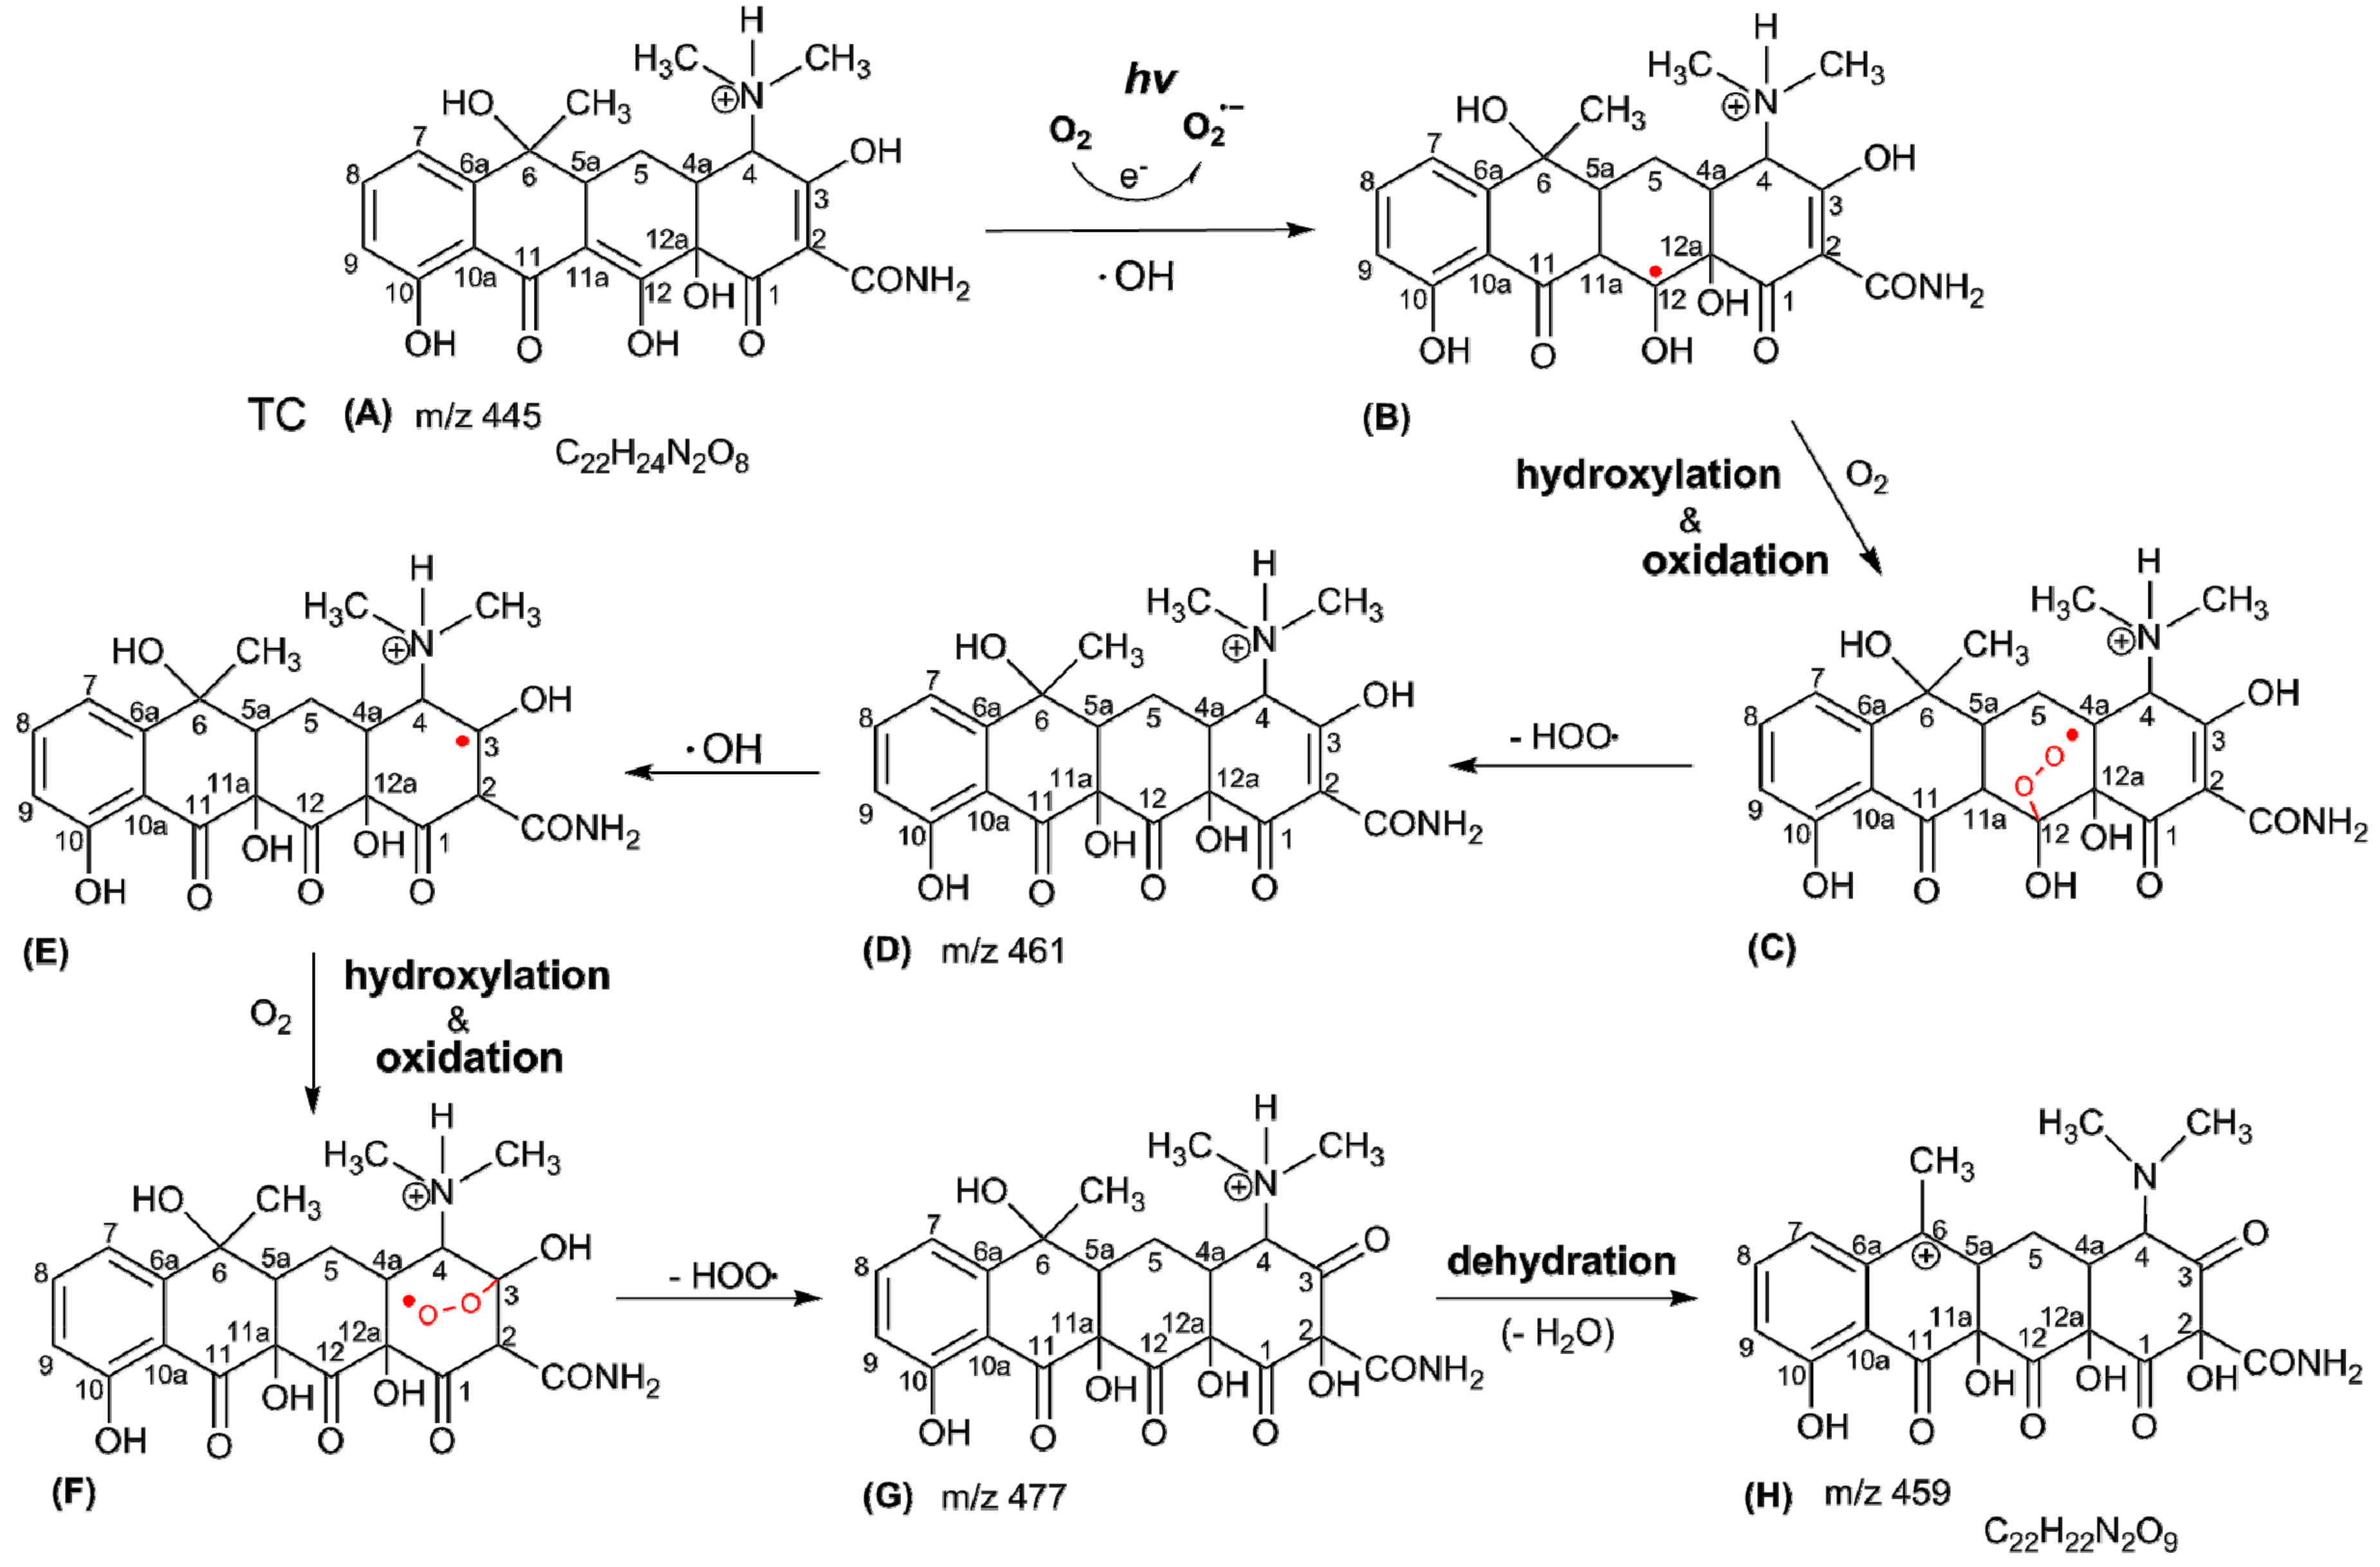
3.2. Molecule Identification by LC-MS/MS Analysis
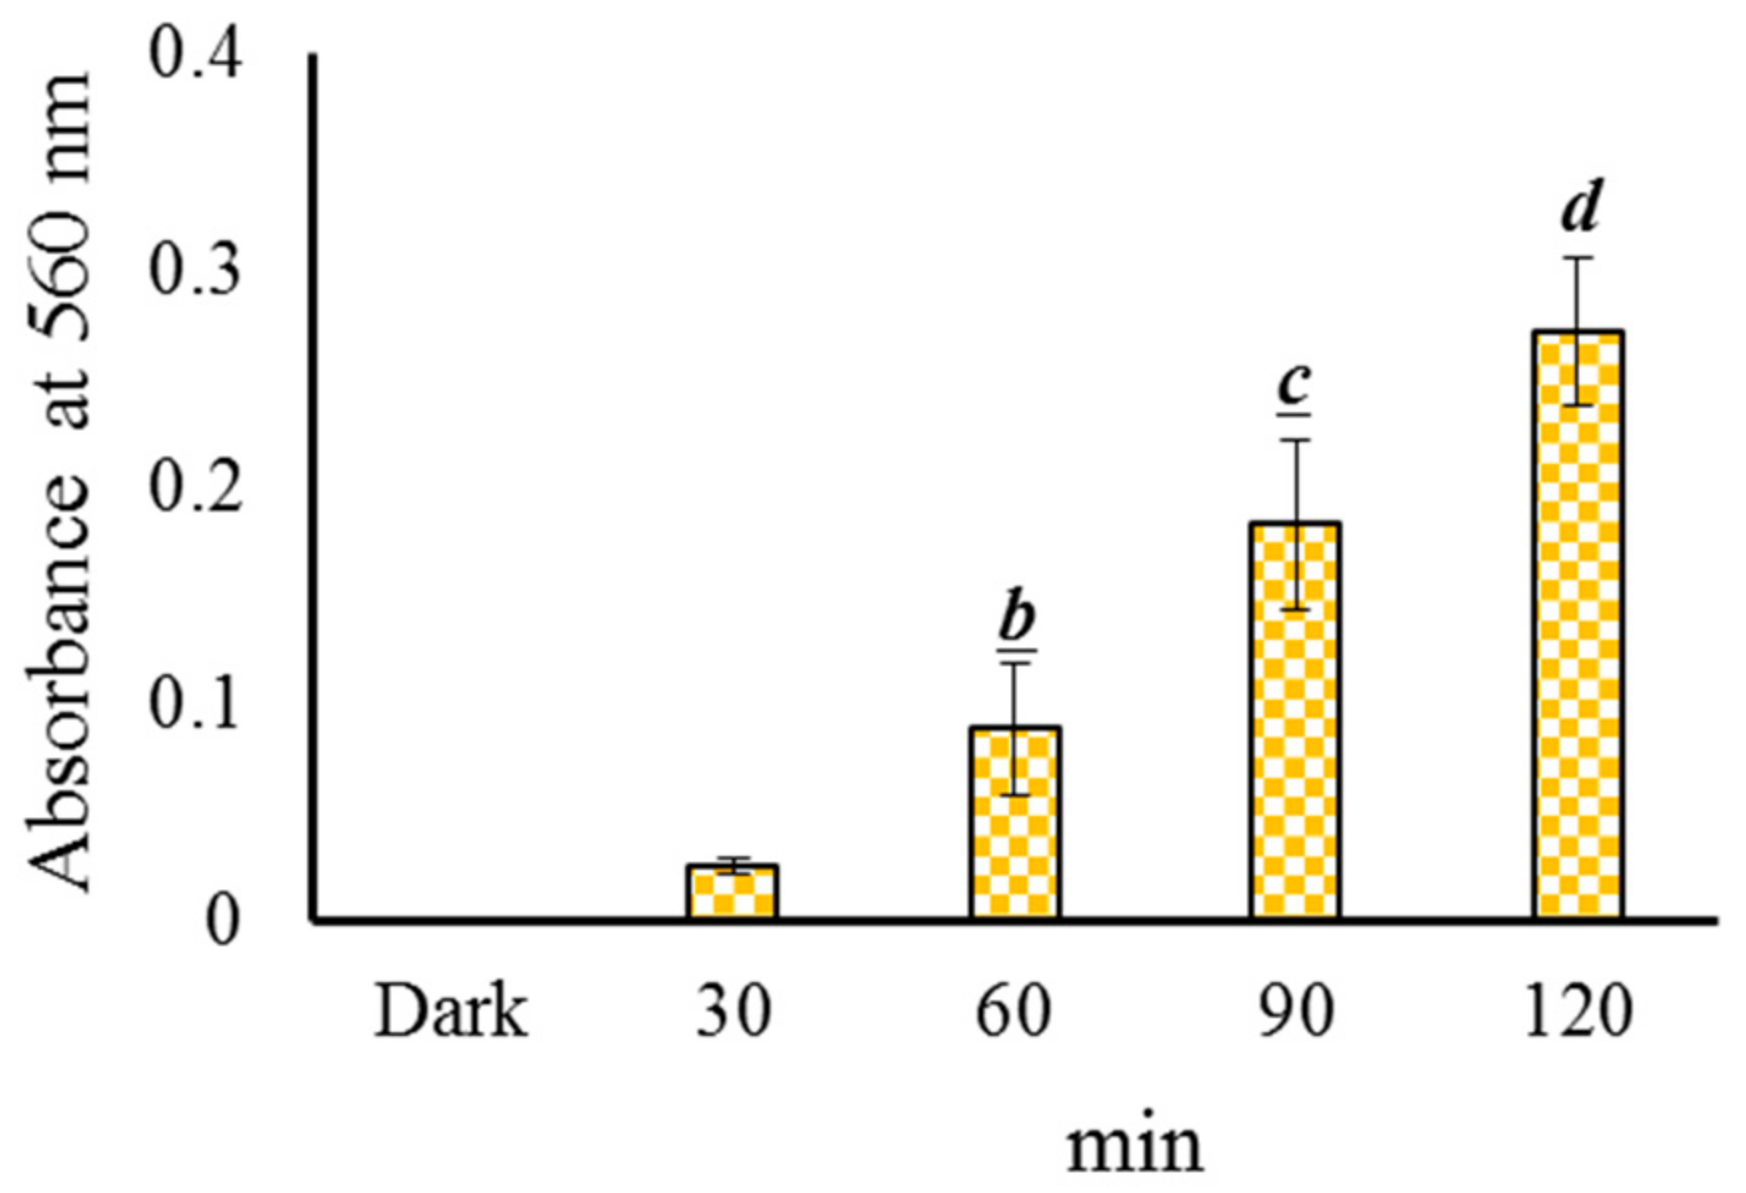
3.3. Probing of Radicals in the Photolysis of TC Under Blue Light Illumination
3.4. Effects of TC Treated With Blue Light Illumination on E. coli. Viability
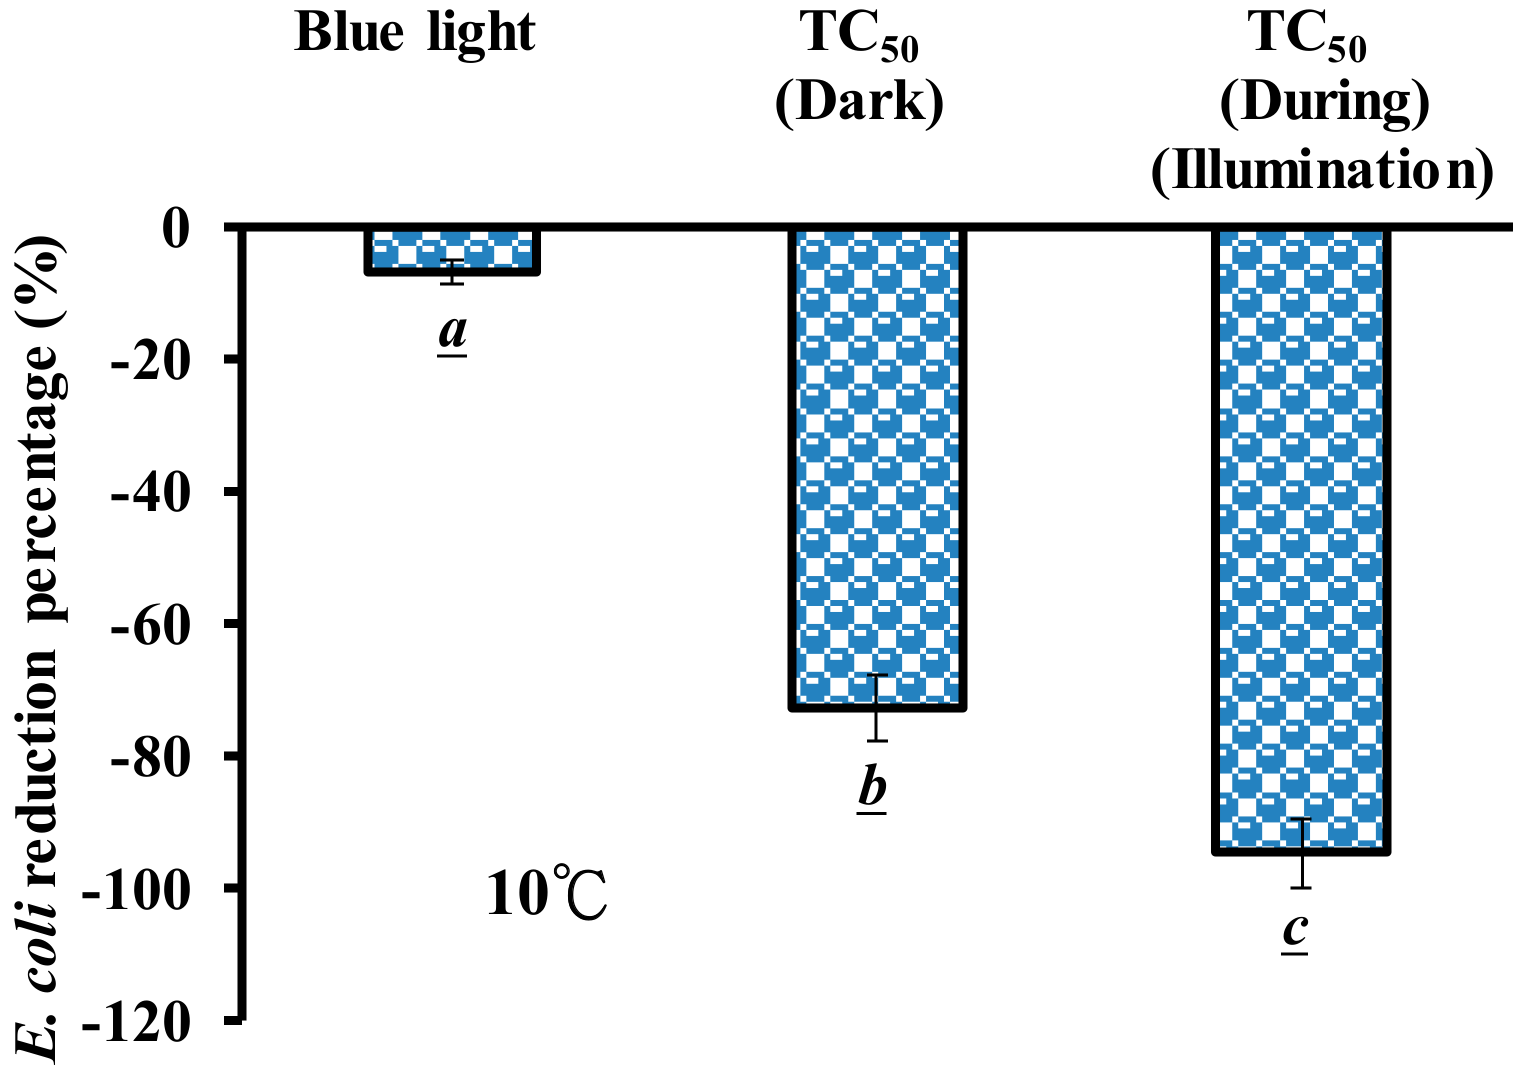
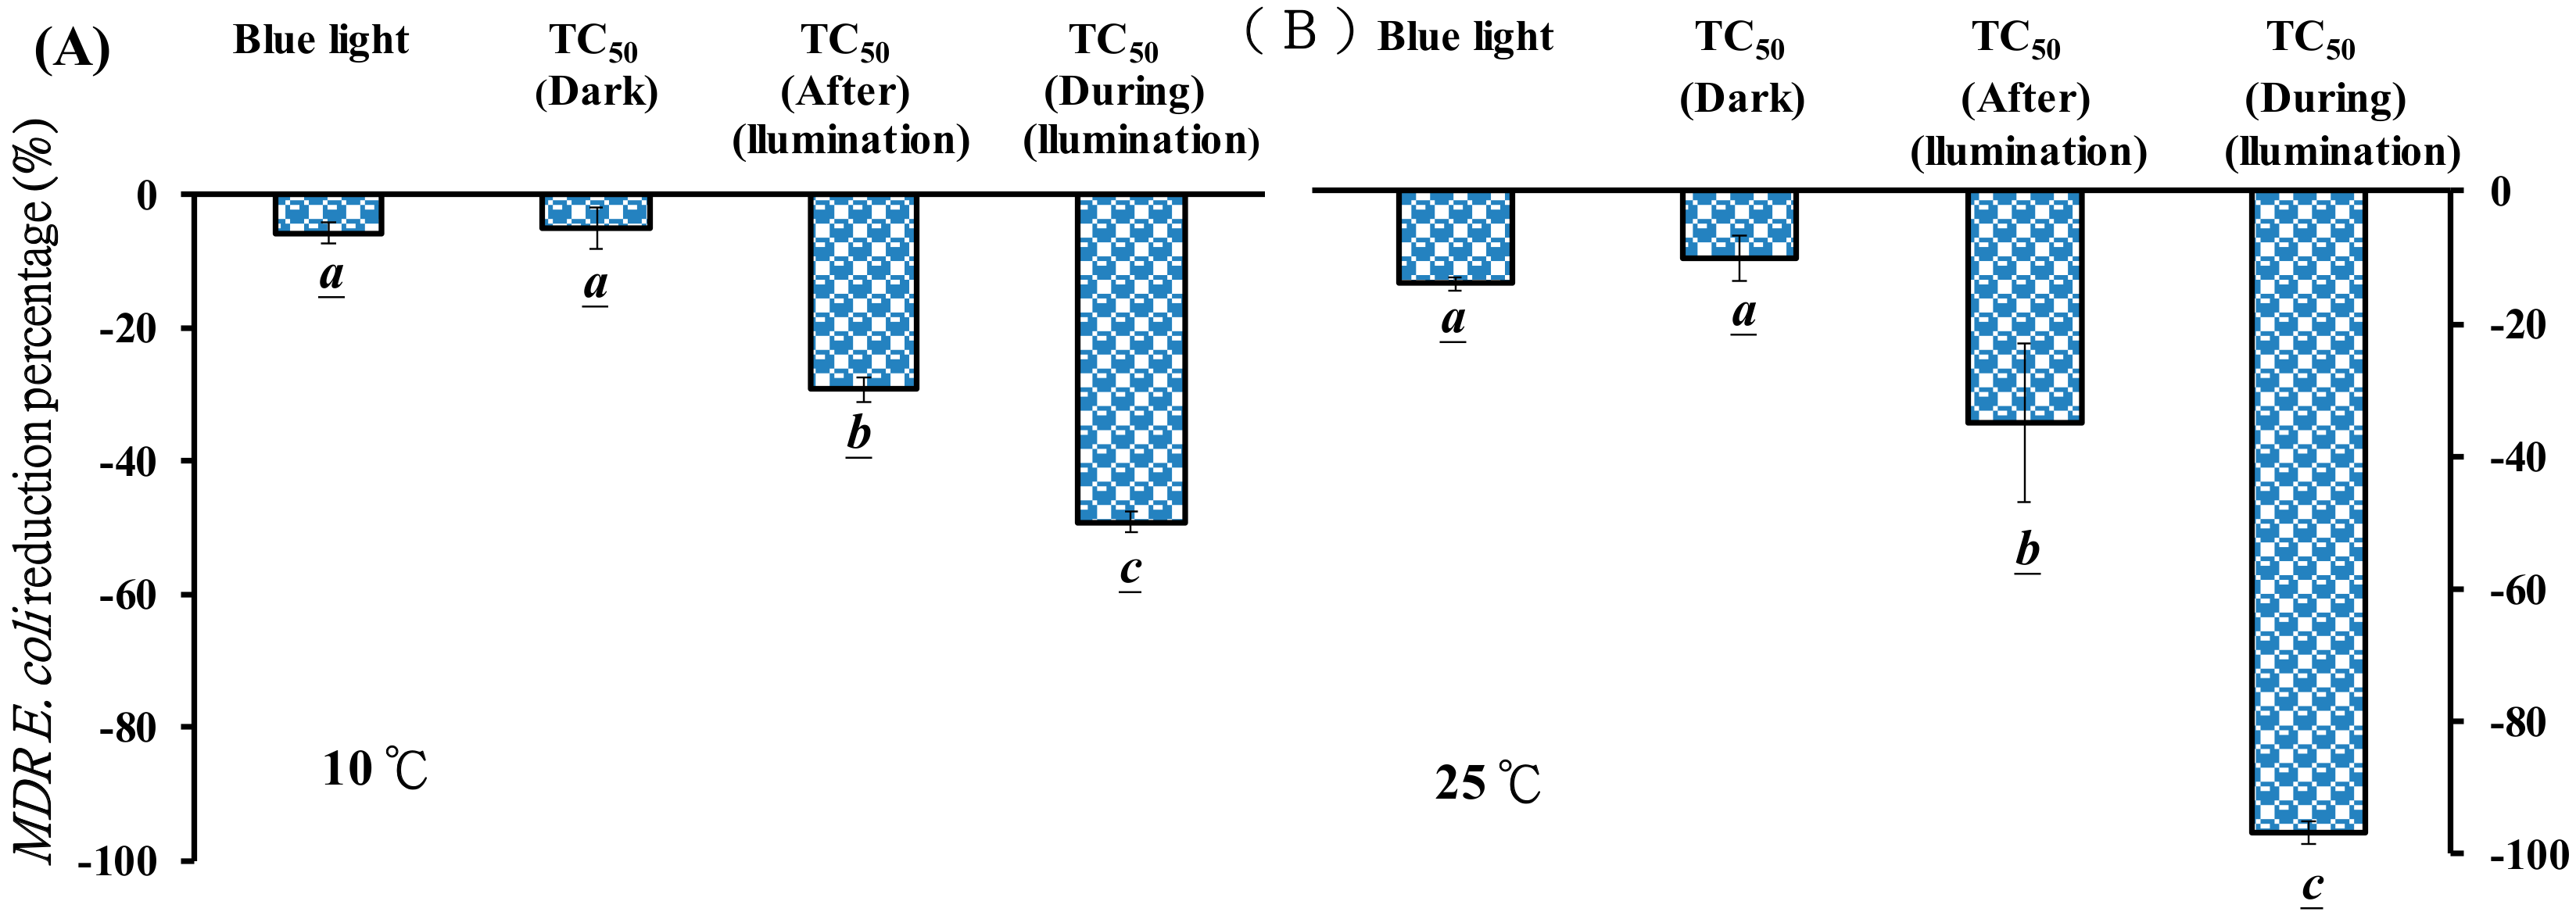
3.5. Effects of the Temperature of PPT and TC During Blue Light Illumination on MDR E. coli Viability
4. Discussion
5. Conclusions
Author Contributions
Funding
Acknowledgments
Conflicts of Interest
References
- Esposito, S.; Bassetti, M.; Concia, E.; De Simone, G.; De Rosa, F.G.; Grossi, P.; Novelli, A.; Menichetti, F.; Petrosillo, N.; Tinelli, M.; et al. Diagnosis and management of skin and soft-tissue infections (SSTI). A literature review and consensus statement: An update. J. Chemother. 2017, 29, 197–214. [Google Scholar] [CrossRef] [PubMed]
- Cardona, A.F.; Wilson, S.E. Skin and soft-tissue infections: A critical review and the role of telavancin in their treatment. Clin. Infect. Dis. 2015, 61, S69–S78. [Google Scholar] [CrossRef] [PubMed]
- Liang, J.Y.; Cheng, C.W.; Yu, C.H.; Chen, L.Y. Investigations of blue light-induced reactive oxygen species from flavin mononucleotide on inactivation of E. coli. J. Photochem. Photobiol. B Biol. 2015, 143, 82–88. [Google Scholar] [CrossRef] [PubMed]
- Tadesse, D.A.; Zhao, S.; Tong, E.; Ayers, S.; Singh, A.; Bartholomew, M.J.; McDermott, P.F. Antimicrobial drug resistance in Escherichia coli from humans and food animals, United States, 1950–2002. Emerg. Infect. Dis. 2012, 18, 741–749. [Google Scholar] [CrossRef] [PubMed]
- Von Baum, H.; Marre, R. Antimicrobial resistance of Escherichia coli and therapeutic implications. Int. J. Med. Microbiol. 2005, 295, 503–511. [Google Scholar] [CrossRef] [PubMed]
- Chopra, I.; Roberts, M. Tetracycline antibiotics: Mode of action, applications, molecular biology, and epidemiology of bacterial resistance. Microbiol. Mol. Biol. Rev. 2001, 65, 232–260. [Google Scholar] [CrossRef] [PubMed]
- Roberts, M.C. Tetracycline resistance determinants: Mechanisms of action, regulation of expression, genetic mobility, and distribution. FEMS Microbiol. Rev. 1996, 19, 1–24. [Google Scholar] [CrossRef] [PubMed]
- McEwen, S.A.; Fedorka-Cray, P.J. Antimicrobial use and resistance in animals. Clinical infectious diseases: An official publication of the Infectious. Diseases Soc. Am. 2002, 34, S93–S106. [Google Scholar]
- Daghrir, R.; Drogui, P. Tetracycline antibiotics in the environment: A review. Environ. Chem. Lett. 2013, 11, 209–227. [Google Scholar] [CrossRef]
- Fairbrother, J.M.; Nadeau, E. Escherichia coli: On-farm contamination of animals. Rev-Off. Int. Epizoot. 2006, 25, 555–569. [Google Scholar]
- Nhung, N.T.; Thuy, C.T.; Trung, N.V.; Campbell, J.; Baker, S.; Thwaites, G.; Hoa, N.T.; Carrique-Mas, J. Induction of antimicrobial resistance in Escherichia coli and non-typhoidal salmonella strains after adaptation to disinfectant commonly used on farms in Vietnam. Antibiotics 2015, 4, 480–494. [Google Scholar] [CrossRef] [PubMed]
- Yang, M.J.; Hung, Y.A.; Wong, T.W.; Lee, N.Y.; Yuann, J.M.; Huang, S.T.; Wu, C.Y.; Chen, I.Z.; Liang, J.Y. Effects of blue-light-induced free radical formation from catechin hydrate on the inactivation of Acinetobacter baumannii, including a carbapenem-resistant strain. Molecules 2018, 23, 1631. [Google Scholar] [CrossRef] [PubMed]
- Liang, J.Y.; Yuann, J.M.; Cheng, C.W.; Jian, H.L.; Lin, C.C.; Chen, L.Y. Blue light induced free radicals from riboflavin on E. coli DNA damage. J. Photochem. Photobiol. B Biol. 2013, 119, 60–64. [Google Scholar] [CrossRef] [PubMed]
- Liang, J.Y.; Yuann, J.P.; Hsie, Z.J.; Huang, S.T.; Chen, C.C. Blue light induced free radicals from riboflavin in degradation of crystal violet by microbial viability evaluation. J. Photochem. Photobiol. B Biol. 2017, 174, 355–363. [Google Scholar] [CrossRef] [PubMed]
- Halliwell, B.; Gutteridge, J.M. Role of free radicals and catalytic metal ions in human disease: An overview. Meth. Enzymol. 1990, 186, 1–85. [Google Scholar] [PubMed]
- Juen, J.W.; Jian, H.L.; Liang, J.Y. The effect of illuminance on light induced reduction of nitro blue tetrazolium. MC-Trans. Biotechnol. 2010, 2, e2. [Google Scholar]
- Hasan, T.; Kochevar, I.E.; McAuliffe, D.J.; Cooperman, B.S.; Abdulah, D. Mechanism of tetracycline phototoxicity. J. Investig. Dermatol. 1984, 83, 179–183. [Google Scholar] [CrossRef] [PubMed]
- Redelsperger, I.M.; Taldone, T.; Riedel, E.R.; Lepherd, M.L.; Lipman, N.S.; Wolf, F.R. Stability of doxycycline in feed and water and minimal effective doses in tetracycline-inducible systems. J. Am. Assoc. Lab. Anim. Sci. 2016, 55, 467–474. [Google Scholar] [PubMed]
- Chen, Y.; Hu, C.; Qu, J.; Yang, M. Photodegradation of tetracycline and formation of reactive oxygen species in aqueous tetracycline solution under simulated sunlight irradiation. J. Photochem. Photobiol. A Chem. 2008, 197, 81–87. [Google Scholar] [CrossRef] [Green Version]
- Andreozzi, R.; Raffaele, M.; Nicklas, P. Pharmaceuticals in STP effluents and their solar photodegradation in aquatic environment. Chemosphere 2003, 50, 1319–1330. [Google Scholar] [CrossRef]
- Jiao, S.; Zheng, S.; Yin, D.; Wang, L.; Chen, L. Aqueous photolysis of tetracycline and toxicity of photolytic products to luminescent bacteria. Chemosphere 2008, 73, 377–382. [Google Scholar] [CrossRef] [PubMed]
- Tim, M. Strategies to optimize photosensitizers for photodynamic inactivation of bacteria. J. Photochem. Photobiol. B Biol. 2015, 150, 2–10. [Google Scholar] [CrossRef] [PubMed]
- Hamblin, M.R. Antimicrobial photodynamic inactivation: A bright new technique to kill resistant microbes. Curr. Opin. Microbiol. 2016, 33, 67–73. [Google Scholar] [CrossRef] [PubMed]
- Wong, T.W.; Wu, E.C.; Ko, W.C.; Lee, C.C.; Hor, L.I.; Huang, I.H. Photodynamic inactivation of methicillin-resistant Staphylococcus aureus by indocyanine green and near infrared light. Dermatol. Sin. 2017, 36, 1–32. [Google Scholar] [CrossRef]
- Maisch, T.; Hackbarth, S.; Regensburger, J.; Felgentrager, A.; Baumler, W.; Landthaler, M.; Roder, B. Photodynamic inactivation of multi-resistant bacteria (PIB)—A new approach to treat superficial infections in the 21st century. J. Dtsch. Dermatol. Ges. 2011, 9, 360–366. [Google Scholar] [CrossRef] [PubMed]
- He, Y.; Huang, Y.Y.; Xi, L.; Gelfand, J.A.; Hamblin, M.R. Tetracyclines function as dual-action light-activated antibiotics. PLoS ONE 2018, 13, e0196485. [Google Scholar] [CrossRef] [PubMed]
- Martin, J.P., Jr.; Colina, K.; Logsdon, N. Role of oxygen radicals in the phototoxicity of tetracyclines toward Escherichia coli B. J. Bacteriol. 1987, 169, 2516–2522. [Google Scholar] [CrossRef] [PubMed]
- Chen, Y.; Li, H.; Wang, Z.; Tao, T.; Wei, D.; Hu, C. Photolysis of chlortetracycline in aqueous solution: Kinetics, toxicity and products. J. Environ. Sci. 2012, 24, 254–260. [Google Scholar] [CrossRef]
- Huang, J.J.; Hu, H.Y.; Wu, Y.H.; Wei, B.; Lu, Y. Effect of chlorination and ultraviolet disinfection on tetA-mediated tetracycline resistance of Escherichia coli. Chemosphere 2013, 90, 2247–2253. [Google Scholar] [CrossRef] [PubMed]
- Wong, T.W.; Cheng, C.W.; Hsieh, Z.J.; Liang, J.Y. Effects of blue or violet light on the inactivation of Staphylococcus aureus by riboflavin-5′-phosphate photolysis. J. Photochem. Photobiol. B Biol. 2017, 173, 672–680. [Google Scholar] [CrossRef] [PubMed]
- Gavilan, R.E.; Nebot, C.; Veiga-Gomez, M.; Roca-Saavedra, P.; Vazquez Belda, B.; Franco, C.M.; Cepeda, A. A Confirmatory Method Based on HPLC-MS/MS for the Detection and Quantification of Residue of Tetracyclines in Nonmedicated Feed. J. Anal. Methods Chem. 2016, 2016, 1202954. [Google Scholar] [CrossRef] [PubMed]
- Cheng, C.W.; Chen, L.Y.; Chou, C.W.; Liang, J.Y. Investigations of riboflavin photolysis via coloured light in the nitro blue tetrazolium assay for superoxide dismutase activity. J. Photochem. Photobiol. B Biol. 2015, 148, 262–267. [Google Scholar] [CrossRef] [PubMed]
- Russell, L.V. Comprehensive review of vitamin B2 analytical methodology. J. Micronutr. Anal. 1990, 8, 257–310. [Google Scholar]
- Niu, J.; Li, Y.; Wang, W. Light-source-dependent role of nitrate and humic acid in tetracycline photolysis: Kinetics and mechanism. Chemosphere 2013, 92, 1423–1429. [Google Scholar] [CrossRef] [PubMed]
- Bouafıa-Cherguı, S.; Zemmourı, H.; Chabanı, M.; Bensmaılı, A. TiO2-photocatalyzed degradation of tetracycline: Kinetic study, adsorption isotherms, mineralization and toxicity reduction. Desalin. Water Treat. 2016, 57, 16670–16677. [Google Scholar] [CrossRef]
- Reyes, C.; Fernandez, J.; Freer, J.; Mondaca, M.; Zaror, C.; Malato, S.; Mansilla, H. Degradation and inactivation of tetracycline by TiO2 photocatalysis. J. Photochem. Photobiol. A Chem. 2006, 184, 141–146. [Google Scholar] [CrossRef]
- Cai, F.; Tang, Y.; Chen, F.; Yan, Y.; Shi, W. Enhanced visible-light-driven photocatalytic degradation of tetracycline by Cr3+ doping SrTiO3 cubic nanoparticles. RSC Adv. 2015, 5, 21290–21296. [Google Scholar] [CrossRef]
- Wang, H.; Yao, H.; Pei, J.; Liu, F.; Li, D. Photodegradation of tetracycline antibiotics in aqueous solution by UV/ZnO. Desalin. Water Treat. 2016, 57, 19981–19987. [Google Scholar] [CrossRef]
- Saghi, M.; Mahanpoor, K. Photocatalytic degradation of tetracycline aqueous solutions by nanospherical α-Fe2O3 supported on 12-tungstosilicic acid as catalyst: Using full factorial experimental design. Int. J. Ind. Chem. 2017, 8, 297–313. [Google Scholar] [CrossRef]
- Yamal-Turbay, E.; Jaén, E.; Graells, M.; Pérez-Moya, M. Enhanced photo-Fenton process for tetracycline degradation using efficient hydrogen peroxide dosage. J. Photochem. Photobiol. A Chem. 2013, 267, 11–16. [Google Scholar] [CrossRef]
- Davies, A.K.; McKellar, J.F.; Phillips, G.O.; Reid, A.G. Photochemical oxidation of tetracycline in aqueous solution. J. Chem. Soc. Perkin Trans. 1979, 0, 369–375. [Google Scholar] [CrossRef]
- Li, C.; Gao, N.; Wang, L.; Shen, Y. Hydrogen peroxide-assisted low pressure UV photodegradation of atrazine in aqueous solution. Int. J. Environ. Stud. 2012, 69, 625–634. [Google Scholar] [CrossRef]
- Liu, Y.; He, X.; Fu, Y.; Dionysiou, D.D. Degradation kinetics and mechanism of oxytetracycline by hydroxyl radical-based advanced oxidation processes. Chem. Eng. J. 2016, 284, 1317–1327. [Google Scholar] [CrossRef]
- Chen, L.Y.; Cheng, C.W.; Liang, J.Y. Effect of esterification condensation on the Folin-Ciocalteu method for the quantitative measurement of total phenols. Food Chem. 2015, 170, 10–15. [Google Scholar] [CrossRef] [PubMed]
- Ono, S.; Imai, R.; Ida, Y.; Shibata, D.; Komiya, T.; Matsumura, H. Increased wound pH as an indicator of local wound infection in second degree burns. Burns 2015, 41, 820–824. [Google Scholar] [CrossRef] [PubMed]
- Li, S.; Hu, J. Photolytic and photocatalytic degradation of tetracycline: Effect of humic acid on degradation kinetics and mechanisms. J. Hazard. Mater. 2016, 318, 134–144. [Google Scholar] [CrossRef] [PubMed]
- Broszkiewicz, R.; Söylemez, T.; Schulte-Frohlinde, D. Reactions of OH radicals with acetylacetone in aqueous solution. A pulse radiolysis and electron spin resonance study. Z. Naturforsch. B J. Chem. Sci. 1982, 37, 368–375. [Google Scholar] [CrossRef]
- Dalmazio, I.; Almeida, M.O.; Augusti, R.; Alves, T.M. Monitoring the degradation of tetracycline by ozone in aqueous medium via atmospheric pressure ionization mass spectrometry. J. Am. Soc. Mass Spectrom. 2007, 18, 679–687. [Google Scholar] [CrossRef] [PubMed] [Green Version]
- Wang, Y.; Zhang, H.; Chen, L. Ultrasound enhanced catalytic ozonation of tetracycline in a rectangular air-lift reactor. Catal. Today 2011, 175, 283–292. [Google Scholar] [CrossRef]
- Liang, J.Y.; Wu, J.Y.; Yang, M.Y.; Hu, A.; Chen, L.Y. Photo-catalytic polymerization of catechin molecules in alkaline aqueous. J. Photochem. Photobiol. B Biol. 2016, 165, 115–120. [Google Scholar] [CrossRef] [PubMed]
- Brown, R.K.; McBurney, A.; Lunec, J.; Kelly, F.J. Oxidative damage to DNA in patients with cystic fibrosis. Free Radic. Biol. Med. 1995, 18, 801–806. [Google Scholar] [CrossRef]
- Heng, J.; Zhao, Y.; Liu, M.; Liu, Y.; Fan, J.; Wang, X.; Zhao, Y.; Zhang, X.C. Substrate-bound structure of the E. coli multidrug resistance transporter MdfA. Cell Res. 2015, 25, 1060. [Google Scholar] [CrossRef] [PubMed]
- Putman, M.; van Veen, H.W.; Konings, W.N. Molecular properties of bacterial multidrug transporters. Microbiol. Mol. Biol. Rev. 2000, 64, 672–693. [Google Scholar] [CrossRef] [PubMed]


© 2018 by the authors. Licensee MDPI, Basel, Switzerland. This article is an open access article distributed under the terms and conditions of the Creative Commons Attribution (CC BY) license (http://creativecommons.org/licenses/by/4.0/).
Share and Cite
Huang, S.-T.; Wu, C.-Y.; Lee, N.; Cheng, C.-W.; Yang, M.-J.; Hung, Y.-A.; Wong, T.-W.; Liang, J.-Y. Effects of 462 nm Light-Emitting Diode on the Inactivation of Escherichia coli and a Multidrug-Resistant by Tetracycline Photoreaction. J. Clin. Med. 2018, 7, 278. https://doi.org/10.3390/jcm7090278
Huang S-T, Wu C-Y, Lee N, Cheng C-W, Yang M-J, Hung Y-A, Wong T-W, Liang J-Y. Effects of 462 nm Light-Emitting Diode on the Inactivation of Escherichia coli and a Multidrug-Resistant by Tetracycline Photoreaction. Journal of Clinical Medicine. 2018; 7(9):278. https://doi.org/10.3390/jcm7090278
Chicago/Turabian StyleHuang, Shiuh-Tsuen, Chun-Yi Wu, Nan‐Yao Lee, Chien-Wei Cheng, Meei-Ju Yang, Yi-An Hung, Tak-Wah Wong, and Ji-Yuan Liang. 2018. "Effects of 462 nm Light-Emitting Diode on the Inactivation of Escherichia coli and a Multidrug-Resistant by Tetracycline Photoreaction" Journal of Clinical Medicine 7, no. 9: 278. https://doi.org/10.3390/jcm7090278