Article

Detection and Geometrical Characterization of a Buried Landfill Site by Integrating Land Use Historical Analysis, Digital Photogrammetry and Airborne Lidar Data

Consiglio Nazionale delle Ricerche, Istituto per l’Ambiente Marino Costiero (CNR-IAMC), Calata Porta di Massa, 80133 Napoli, Italy
*
Author to whom correspondence should be addressed.
Geosciences 2018, 8(9), 348; https://doi.org/10.3390/geosciences8090348
Submission received: 13 August 2018 / Revised: 5 September 2018 / Accepted: 10 September 2018 / Published: 14 September 2018
(This article belongs to the Section Natural Hazards)

Abstract

:
Abandoned quarries are frequently used as sites of illegal dumping of solid urban waste. These sites often occur nearby or within urban areas so that their detection may turn out to be quite difficult from the surface. This study focuses on the detection and geometrical characterization of a hidden landfill site located along the coastline of the Campi Flegrei, near Naples, Italy. Our approach is based on the analysis of historical topographic maps and aerial photographs, coupled with quantitative comparison of multitemporal digital elevation models obtained by digital photogrammetry and lidar techniques. The comparative analysis of topographic maps and aerial photos clearly shows modifications of the landscape associated with the urban development and quarrying activity, as well as the later filling of the quarry. The change detection analysis reveals that remarkable elevation changes occurred in the study area between 1956 and 2008. The average thickness of the landfill deposits is ca. 8 m, whereas the average volume is ca. 100,000 m3. The results of this work confirm the suitability of the used methodological approach that combines both qualitative and quantitative techniques for the detection of buried landfill sites. The geometric characterization of a landfill represents a fitting starting point for the further planning of geophysical site surveys and direct investigations aimed at the assessment of environmental hazards.

1. Introduction

Environmental impact and health threat associated with the disposal of solid wastes is a source of public concern worldwide. Wastes are commonly stored in a landfill, that is a large area of land or an excavated site specifically designed and built to receive them. According to Chabuk et al. [1], landfill siting represents a complex task for planners and authorities because it needs to take into consideration a series of factors, including geology, topography, groundwater properties, location of urban centers, and social concerns. The conversion of old quarries into well designed and controlled landfills can be considered an effective means for the management of solid wastes. However, this measure requires appropriate technical solutions and monitoring systems that may ensure careful environmental protection [2,3]. In many parts of the world, abandoned quarries have been or still are the sites of illegal dumping of solid urban and industrial waste. Relevant examples include case histories from Kenya [4], Tanzania [5], Canada [6], and Greece [7,8]. Frequently, landfill sites are located close to or within areas of recent urbanization and they may cause significant environmental and geo-engineering problems, such as groundwater and soil pollution [9,10,11], landslides [12,13], sinkholes, and subsurface instability issues [14].
Until the late 1980s, prior to the adoption of more restrictive environmental laws in Italy, abandoned quarries located in the suburbs of growing metropolitan areas were often used for burying municipal solid waste deposits, practically in the absence of any urban planning, mitigation measure, or monitoring activity [15]. Nowadays, only after a few decades, the historical memory of the location of these areas is often lost and sometimes residents are not even aware of the presence of buried waste deposits close to their homes.
Detection and geometric characterization of unknown landfill sites, in terms of areal extent, thickness, and volume of filling, represent the first steps towards a full analysis of the related geological and environmental hazards. Geophysical methods are typically used to characterize landfills in different settings [15,16,17,18,19,20]. By coupling geophysical prospection with standard (costly) engineering geological investigations (e.g., boreholes, cone penetration testing), it is possible to estimate, with some approximation, the actual shape of the bottom surface resulting after the excavation within natural rocks or soils, the degree of anthropogenic transformation, and the volume of waste deposits [21]. The detection stage can be also conducted by means of remote sensing techniques, based on the identification of land use and topographic changes or other environmental effects associated with the waste disposal. For example, Silvestri and Omri [22] used multispectral satellite imagery for the identification of sites hosting buried waste materials in NE Italy. Persechino et al. [23] tested the aerial infrared thermography to support the detection and monitoring of illegal dumping and environmental pollution. Many studies have been based on the interpretation of multi-temporal aerial photographs. Erb et al. [24] reviewed the qualitative use of aerial photographs for the temporal assessment of landfill evolution, evaluation of health hazards, and planning of remedies. This technique was employed in several case studies, like those described by Lyon [25], Pope et al. [26], and de Wet et al. [27]. Recently, de Wet [28] combined aerial photographs with airborne light detection and ranging (lidar) data for a semi-quantitative analysis of known and unknown abandoned landfills in the USA.
In this study, airborne lidar and digital photogrammetry techniques have been combined to detect and accurately estimate the areal extent and volume of a previously unknown landfill site, where waste deposits had been delivered and buried during the last decades of the last century. The site localization and the assessment of its spatial evolution through time have been also supported by the visual analysis of multi-temporal topographic maps and aerial photographs. The available data allowed both a qualitative and quantitative assessment of the human-induced topographic changes, starting from topographic setting predating the landfill creation. The main goals of this paper consist in testing a multi-disciplinary approach aimed at (1) detecting the presence of a landfill in the analyzed area, (2) characterizing its geometric properties, and (3) analyzing its historical evolution. These represent the first steps of a more wide analysis that should be carried out for assessing the landfill-related environmental hazards. The study site is in fact located along the coastline of the Campi Flegrei caldera, near the city of Naples, Italy (Figure 1). A major drawback characterizing this site is represented by its proximity to a currently retreating sea cliff. The geomorphological evolution of the cliff has been already analyzed by means of geomatic techniques (e.g., lidar, digital photogrammetry, etc.) [29,30]. Further research has been carried out in other cliff sites of the same area to characterize their geo-structural properties and recurrence of instability processes [31,32,33]. A major concern regarding the analyzed landfill site consists in its likely involvement in future collapses of the coastal cliff. This poses an additional geomorphological hazard to the occurrence of unidentified buried materials that should be therefore the subject of future investigation.

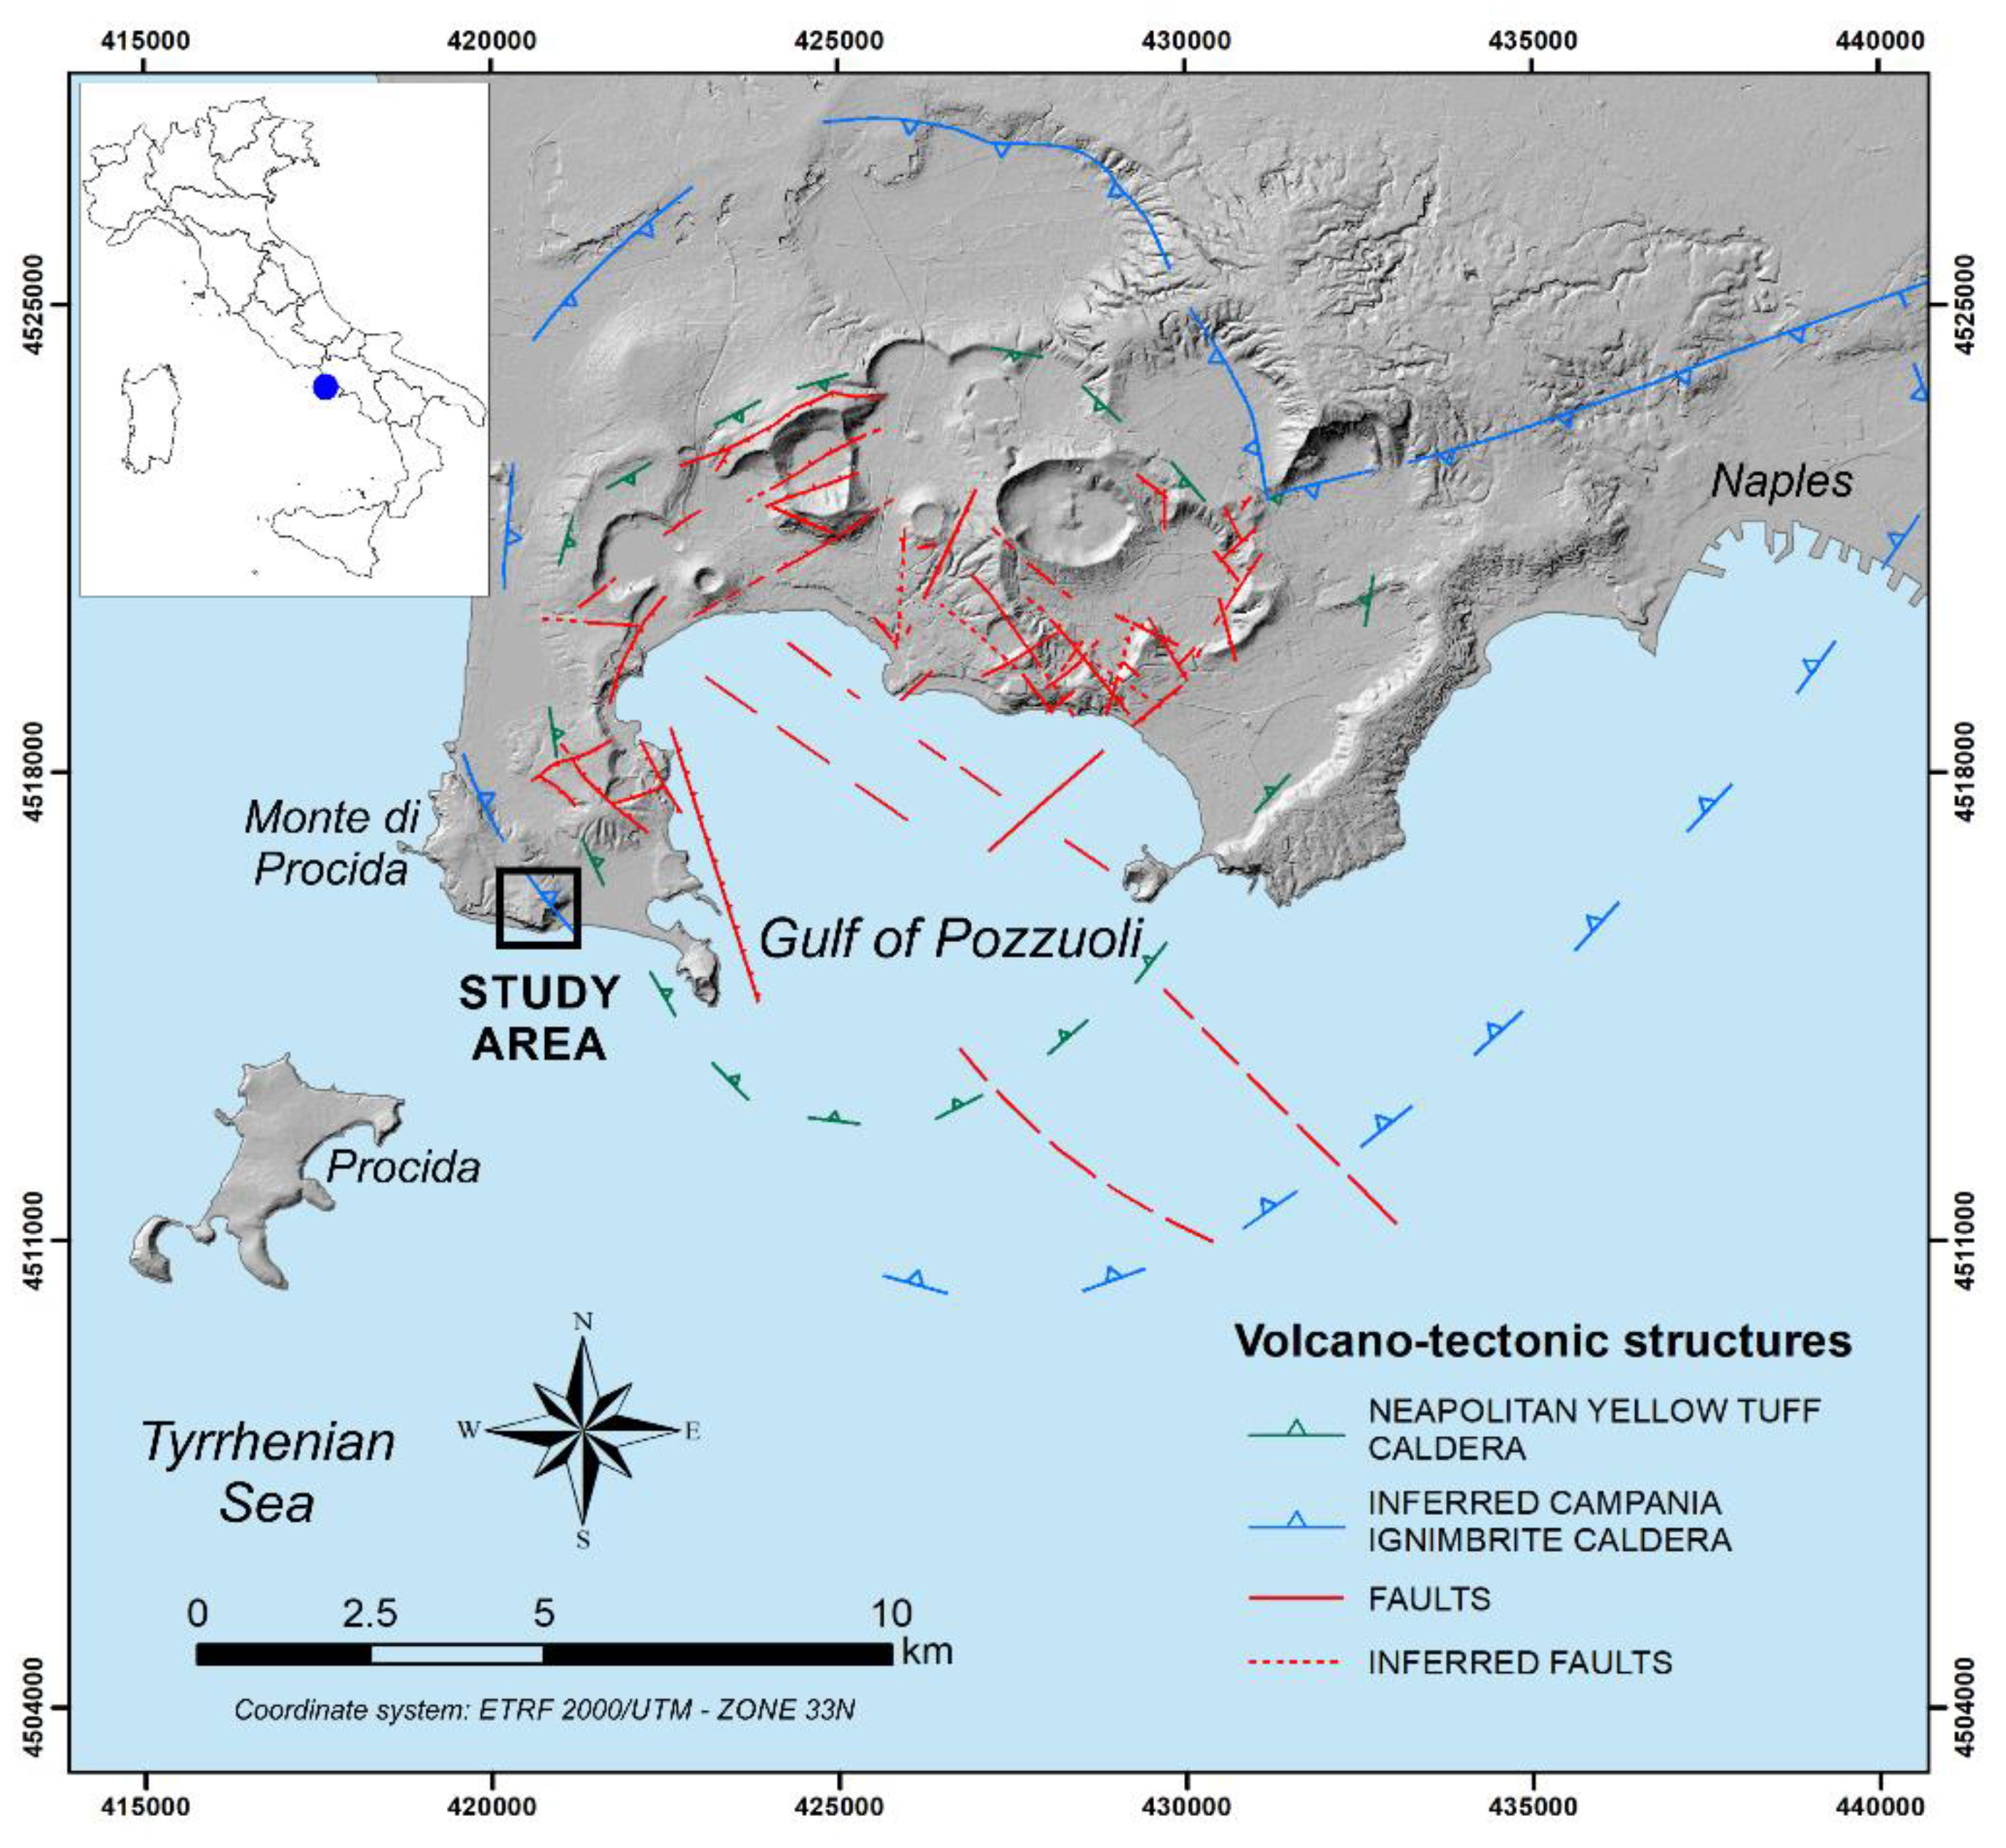
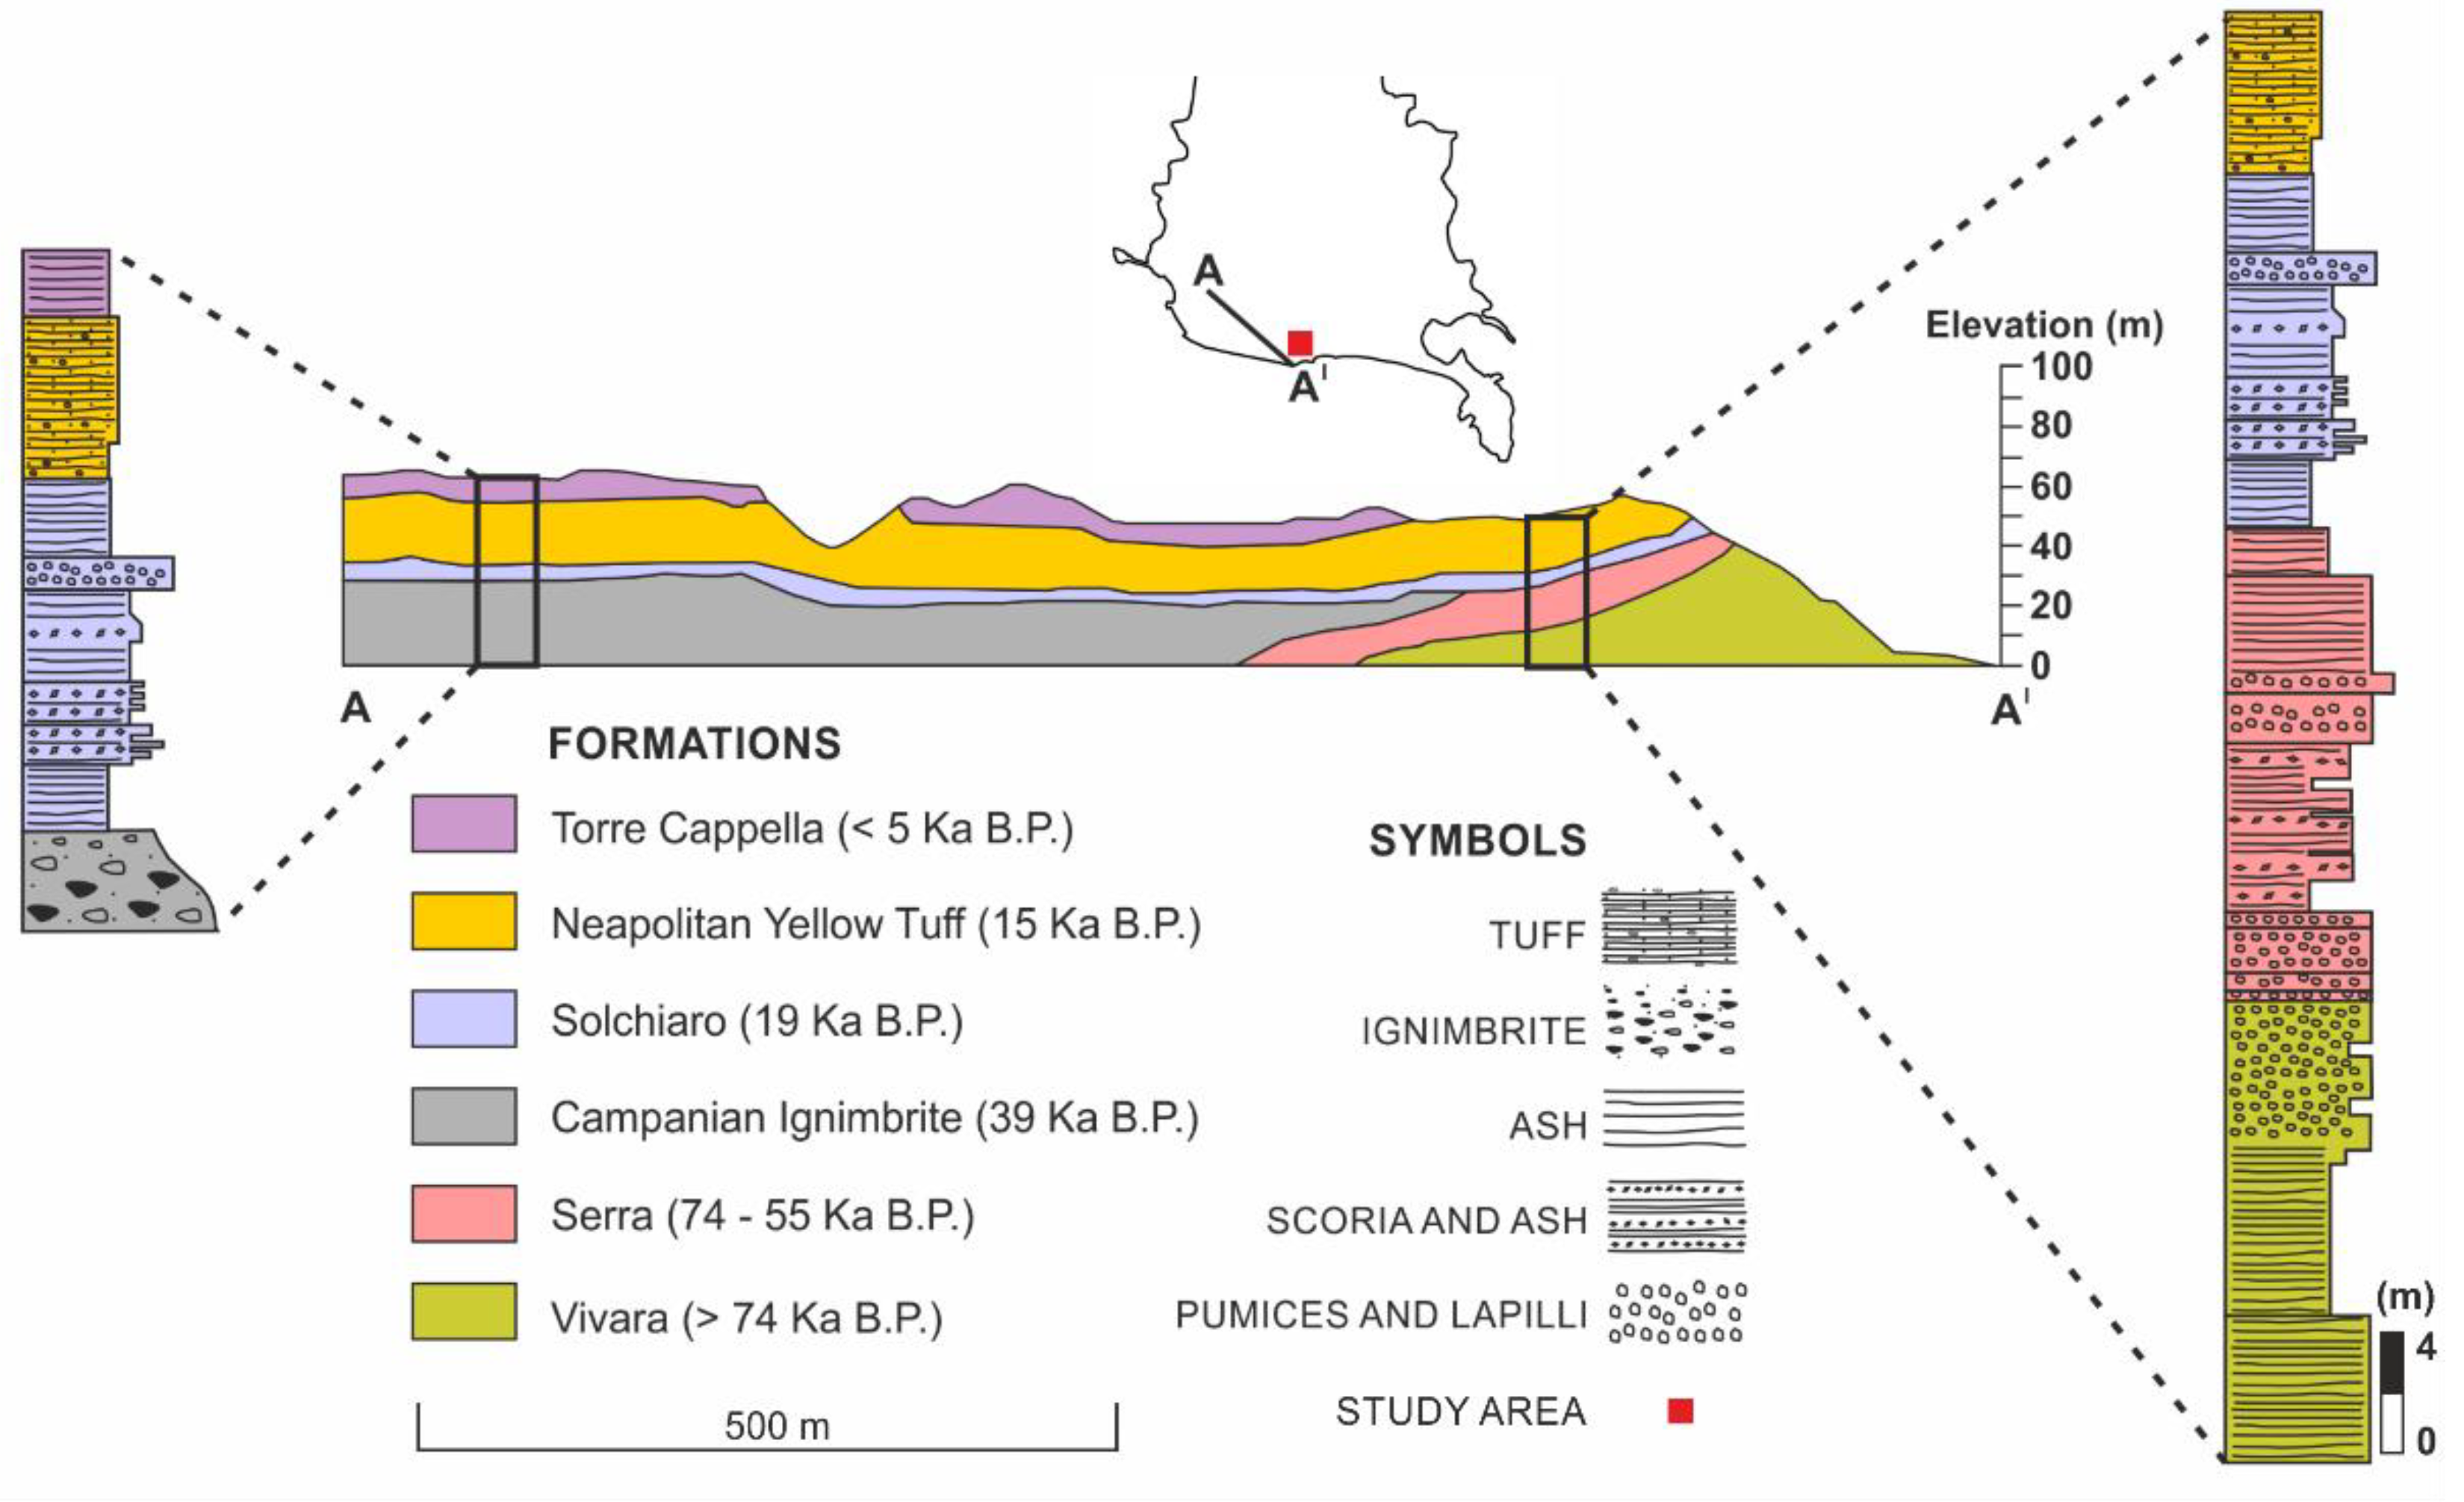
2. Geological Setting

The study site is located along the south-western coastal zone of the Campi Flegrei, in the Municipality of Monte di Procida (Figure 1). This area represents part of an active caldera that formed after two large explosive eruptions, namely the ~39 ka BP Campania Ignimbrite [34,35] and the ~15 ka BP Neapolitan Yellow Tuff [36,37]. Currently, the Campi Flegrei area is characterized by a very high volcanic hazard and is inhabited by tens of thousands of people that are exposed to significant volcanic risk [38]. The coastal zone of Campi Flegrei is also affected by other natural hazards, including flash floods, landslides and marine storms [31,39,40]. Weathering and mass wasting processes represent effective mechanisms in shaping the coastline morphology of the Pozzuoli Bay, including the Torrefumo cliff in the study area [30].
The village of Monte di Procida develops over a NW-SE trending volcano-tectonic ridge that corresponds to a segment of the Campania Ignimbrite caldera rim (Figure 1). The ridge reaches an elevation of 145 m a.s.l. at Mt. Grillo, and it is bordered to the South by the Torrefumo coastal cliff, a ca. 90 m high tuffaceous steep slope. Towards the NE direction the ridge is limited by a structural slope formed by the inner rim of the caldera. The stratigraphic succession in the study area is mostly composed of volcaniclastic deposits ranging in age from 77 to 15 ka (Figure 2). The succession starts with the Vivara formation [41] that includes pyroclastic rocks nowadays forming the remnants of the Vitafumo and Miliscola tuff cones. The Vitafumo succession consists of a lower part, made up of stratified yellow tuffs, and an upper part, represented by reddish coarse pyroclastics, laterally passing to coarse surge deposits with reddish pumice [34]. The stratigraphic boundary between Vitafumo and Miliscola deposits is well exposed along the Torrefumo cliff face, where Miliscola deposits pinch out towards the eastern flank of Vitafumo tuff cone. Miliscola products are formed by valley-ponding layers of poorly sorted ash and pumice, along with pumice lapilli with plane-parallel stratification and subordinately cross-bedded ash layers [41]. The products of Vivara formation are overlain by pyroclastic fall and flow deposits of the Serra formation, mostly constituted by ash beds and pumices, emplaced by pyroclastic fall and currents originated during a series of consecutive eruptions. Further up in the sequence, products of the Campania Ignimbrite (39 ka BP) are prevalently made up of coarse lithic-breccia with welded horizons [34]. This unit is overlain by the deposits of the Solchiaro formation that include dark gray scoriae with intercalated gray ashes originated from the Torregaveta volcano, as well as the products of the Solchiaro tuff ring [41]. Towards the upper part of the succession, coarse and fine layers and lenses of yellow pyroclastic rocks of the Neapolitan Yellow Tuff formation are found (Figure 2). The Torrefumo sequence terminates with the Torre Cappella tephra, a stratified unit consisting of incoherent ash and pumice lapilli, and two ash layers (<15 ka) separated by paleosols.

3. Materials and Methods

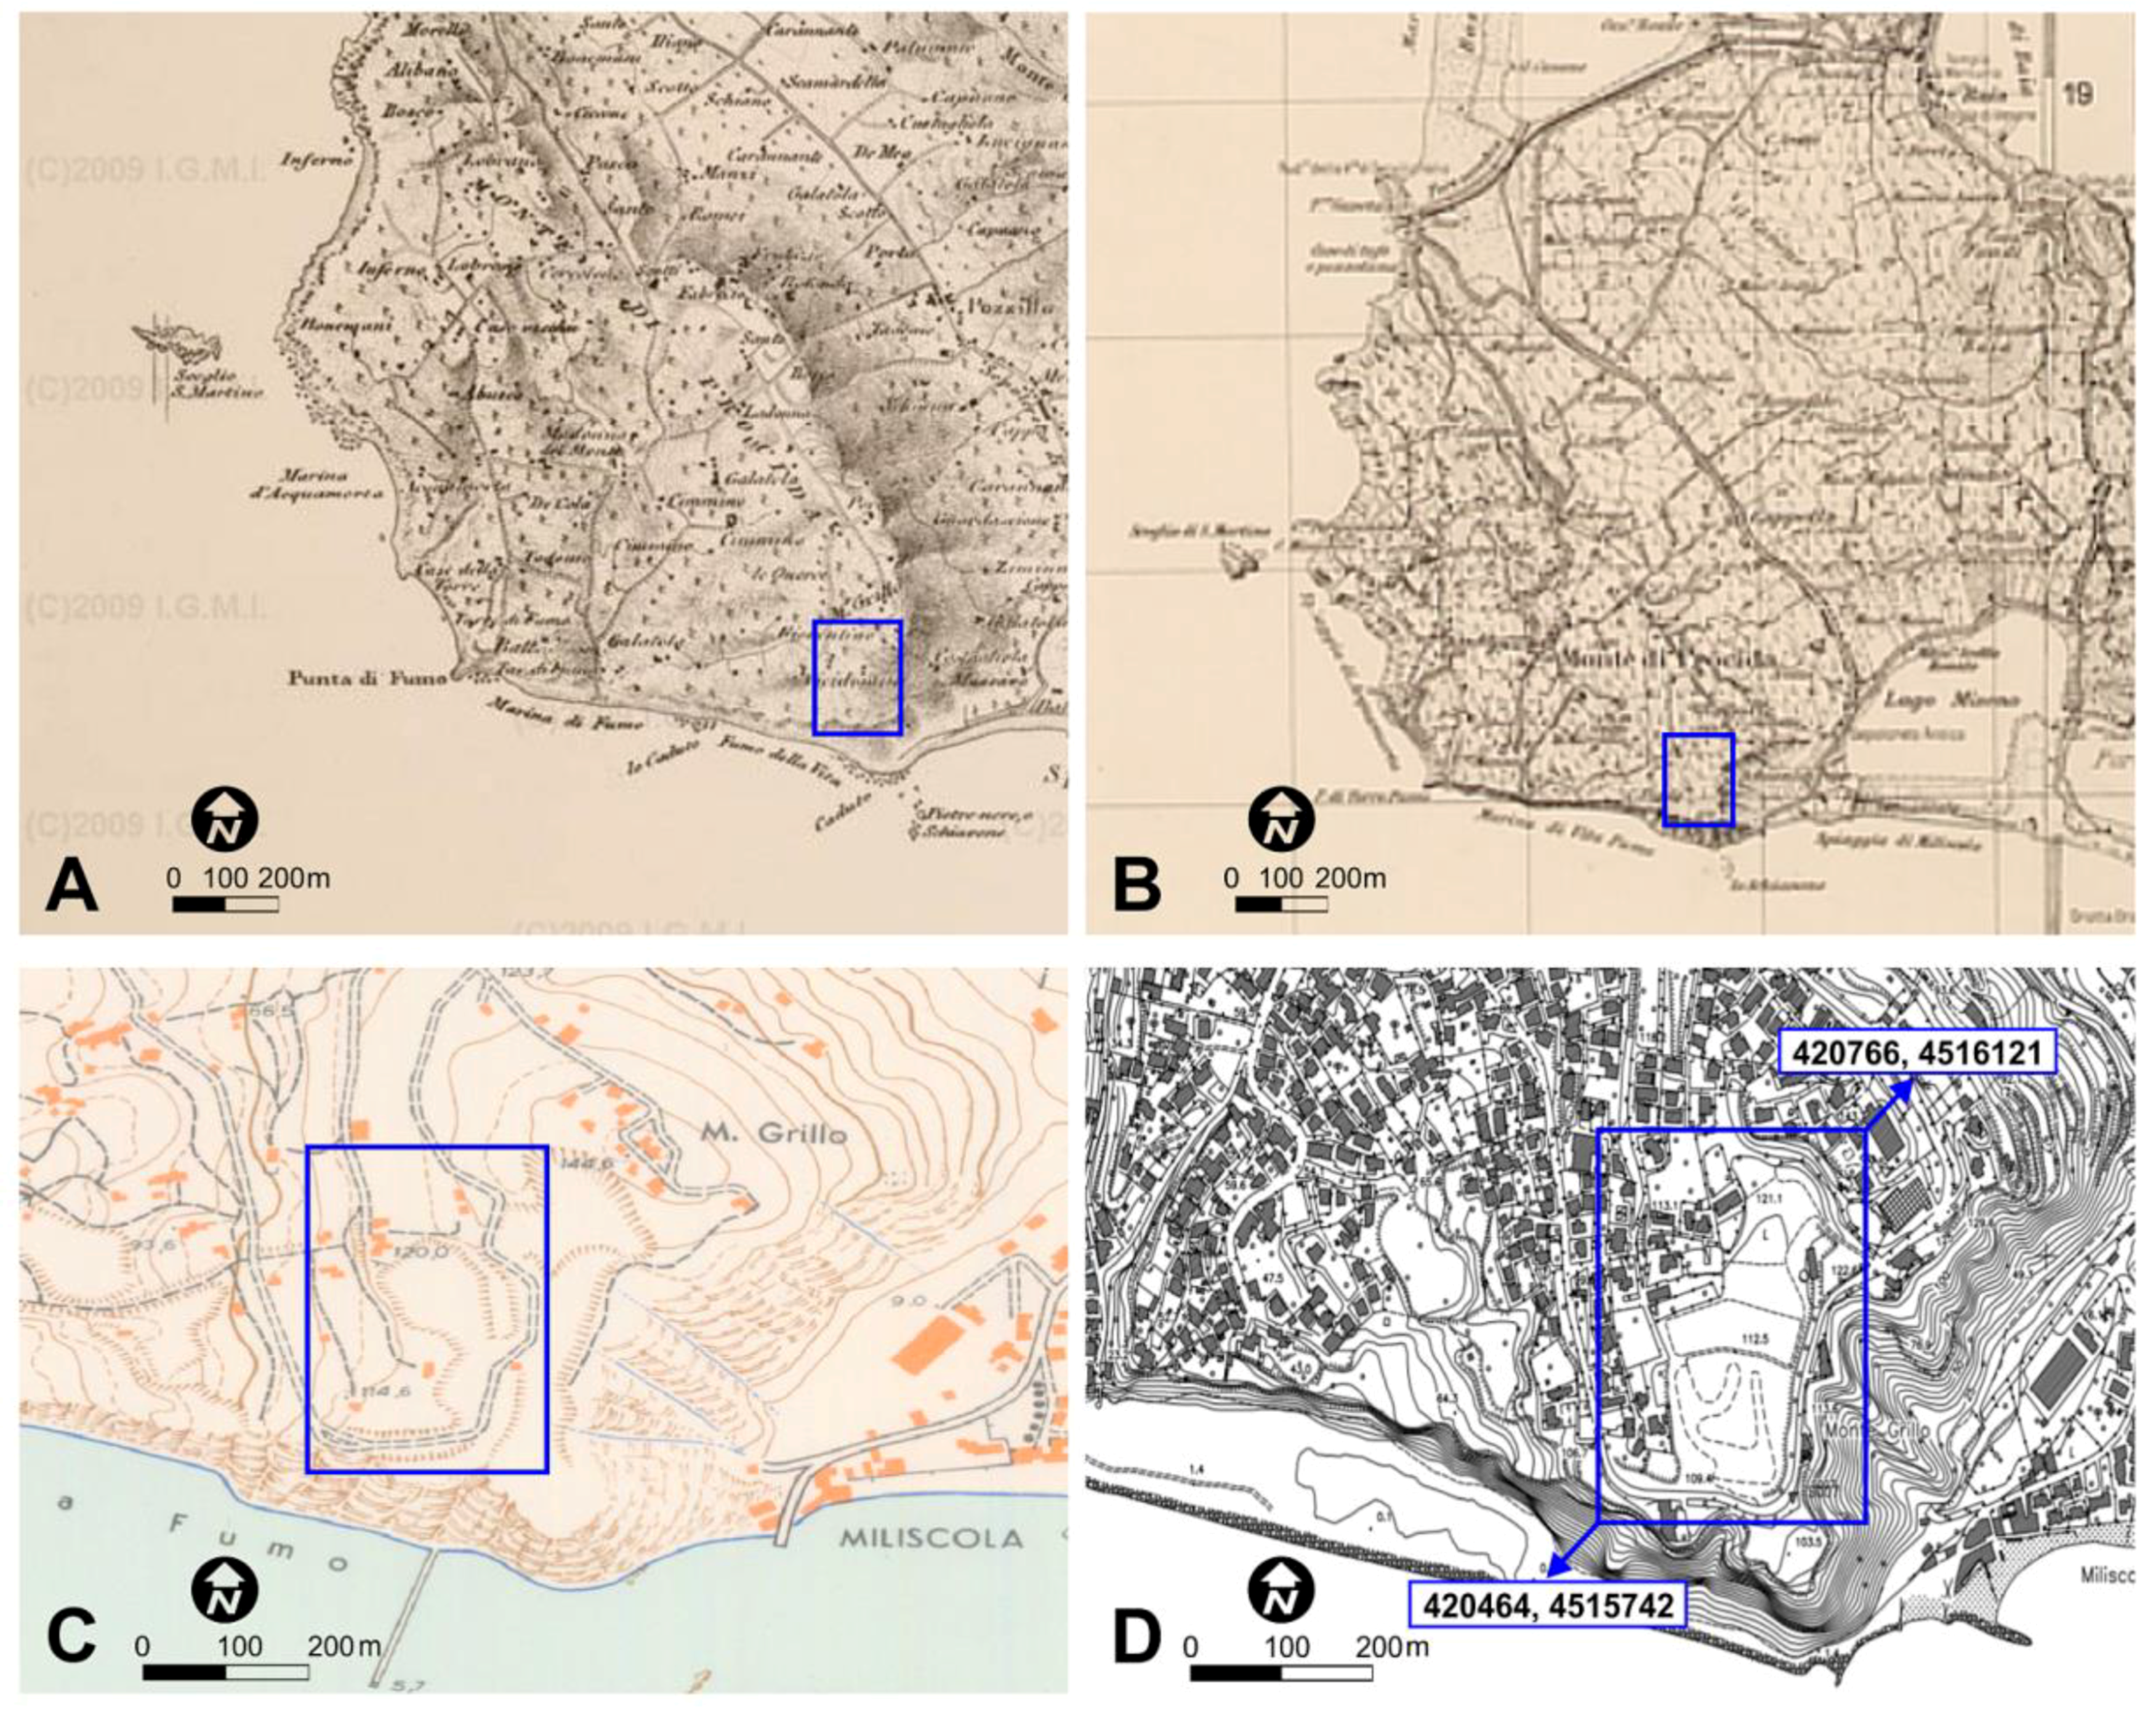
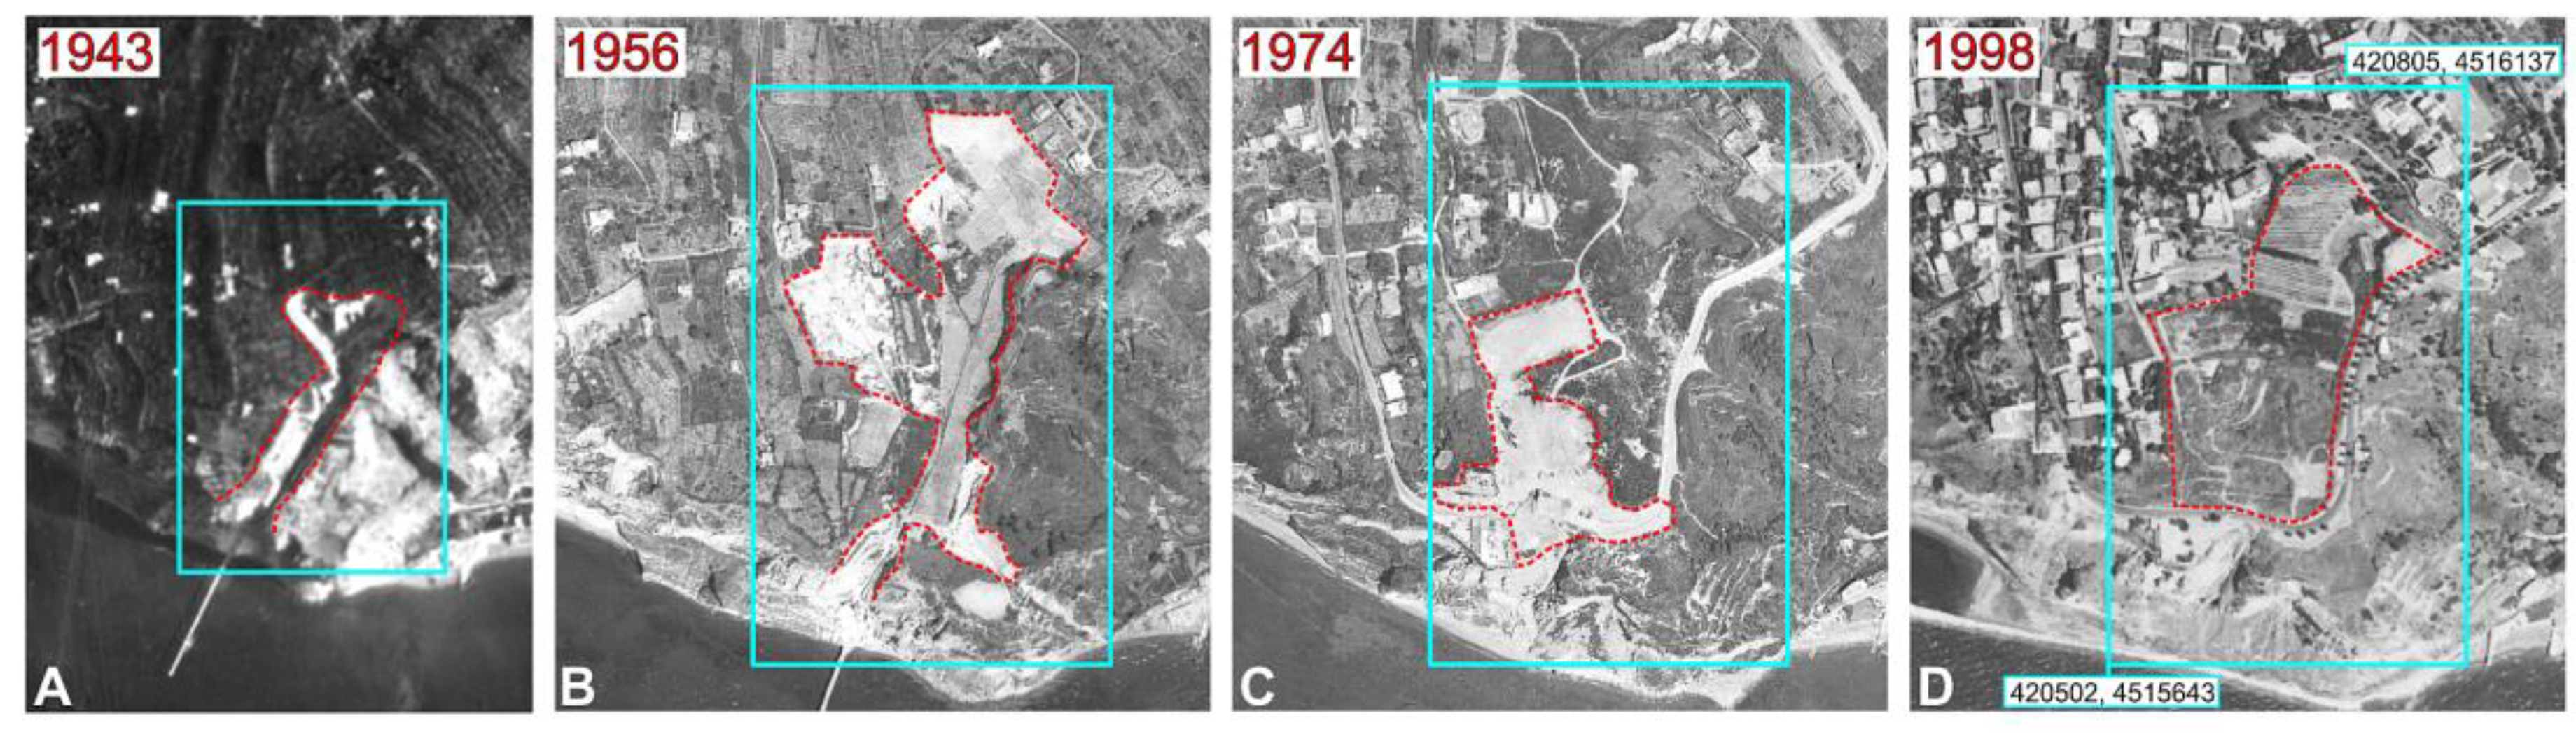
3.1. Analysis of the Land Use Changes

The reconstruction of land use history and the evaluation of geomorphic changes in the study area were based on the analysis and interpretation of historical topographic maps available since XIX century and aerial images available since 1943. Topographic maps were considered individually (i.e., without co-registration) for performing a visual interpretation only. Quantitative topographic changes, instead, were assessed by using some aerial images and lidar data, applying the procedures described in Section 3.2.
Specifically, in this stage we used (1) a historical topographic map at 1:10,000 scale dated 1870 (Sheet n. 9 of the “Carta dei dintorni di Napoli” by “Reale Officio Topografico del Regno di Napoli”, 1818–1887 [42]); (2) a topographic map at 1:25,000 scale dated 1936 (Sheet n. 184 III NO—Procida by the Italian Military Geographic Institute (IGM) [43]); (3) a topographic map dated 1965 (Sheet n. 29 of the “Carta Tecnica della Provincia di Napoli" at 1:10,000 scale [44]); (4) a topographic map dated 2004 (Sheet n. 465,011 of the “Carta Tecnica Regionale della Campania” at 1:5000 scale [45]). The black and white aerial photographs were acquired in the years 1943, 1956, 1974, and 1998 by the IGM [46], with the following nominal scales: 1:25,000 (1943), 1:17,000 (1956), 1:13,000 (1974), 1:5000 (1998).

3.2. Production of Digital Elevation Models

In order to calculate geometric properties of the detected landfill site we used the two couples of historical aerial stereo pairs acquired by the IGM, dated 1956 and 1974, along with topographic data derived from an airborne lidar survey (ALS) commissioned by the “Città Metropolitana di Napoli” administration in 2008. The 1956 frames were acquired from an altitude of 2900 m a.s.l., whereas the 1974 frames were acquired from an altitude of 2300 m a.s.l. All the images were scanned at 800 dots per inch (dpi) with a ground pixel resolution of ca. 0.50 (1956) and 0.40 m (1974). The ALS data were provided as 3D point clouds in the standard .las file format, and georeferenced in the UTM ETRF2000 coordinate system, zone 33 N. Data were acquired during the summer of 2008 by using a Leica™ ALS50-II aerial laser scanner (Leica Geosystems AG, Heerbrugg, Switzerland) mounted on a predisposed airplane, from an average altitude of 600 m a.s.l. Vertical accuracy of lidar data was assessed by the data owner by measuring 117 ground check points (CP) homogeneously distributed throughout the whole surveyed area. For this purpose a GPS receiver in network real time kinematic (NRTK) modality was used. Vertical accuracy was estimated in terms of root mean square error (RMSEz) to be ±0.18 m.
The data set was used to produce multi-temporal digital elevation models (DEMs) of the study area, with the aim of comparing the obtained DEMs by a GIS-based change detection analysis.
Photogrammetric processing of the aerial stereo pairs was carried out by using the ERDASTM IMAGINE 2015 software (Hexagon Geospatial, Norcross, GA, USA), and consisted in the interior/exterior orientation of the stereo pairs, 3D point cloud extraction and DEM production. For the interior orientation we used data contained in the original calibration certificate supplied together with the images. For the exterior orientation, we used as Ground Control Points (GCPs) 15 reference points (e.g., road intersections) extracted from the 2004 topographic map. GCPs were chosen homogeneously in the overlapping areas of photographs, after checking that positions of the selected reference objects had not changed through time. Successively, they were manually pinned onto the images. After the exterior orientation, we extracted 3D point clouds of the analyzed area by means of the Automatic Terrain Extraction with the Dense Point Matching (eATE) module included in ERDASTM IMAGINE 2015. Point clouds were manually filtered from vegetation and imported into ESRITM ArcGis 10.3 (ESRI Inc., Redlands, CA, USA), where they were rasterized by means of the Natural Neighbor algorithm, with a pixel size of 1 m. This operation was also applied to the 2008 ALS-acquired point cloud. Photogrammetric processing of the 1956 and 1974 aerial photographs also allowed us to obtain black and white orthophotos with a pixel size of 0.5 m.

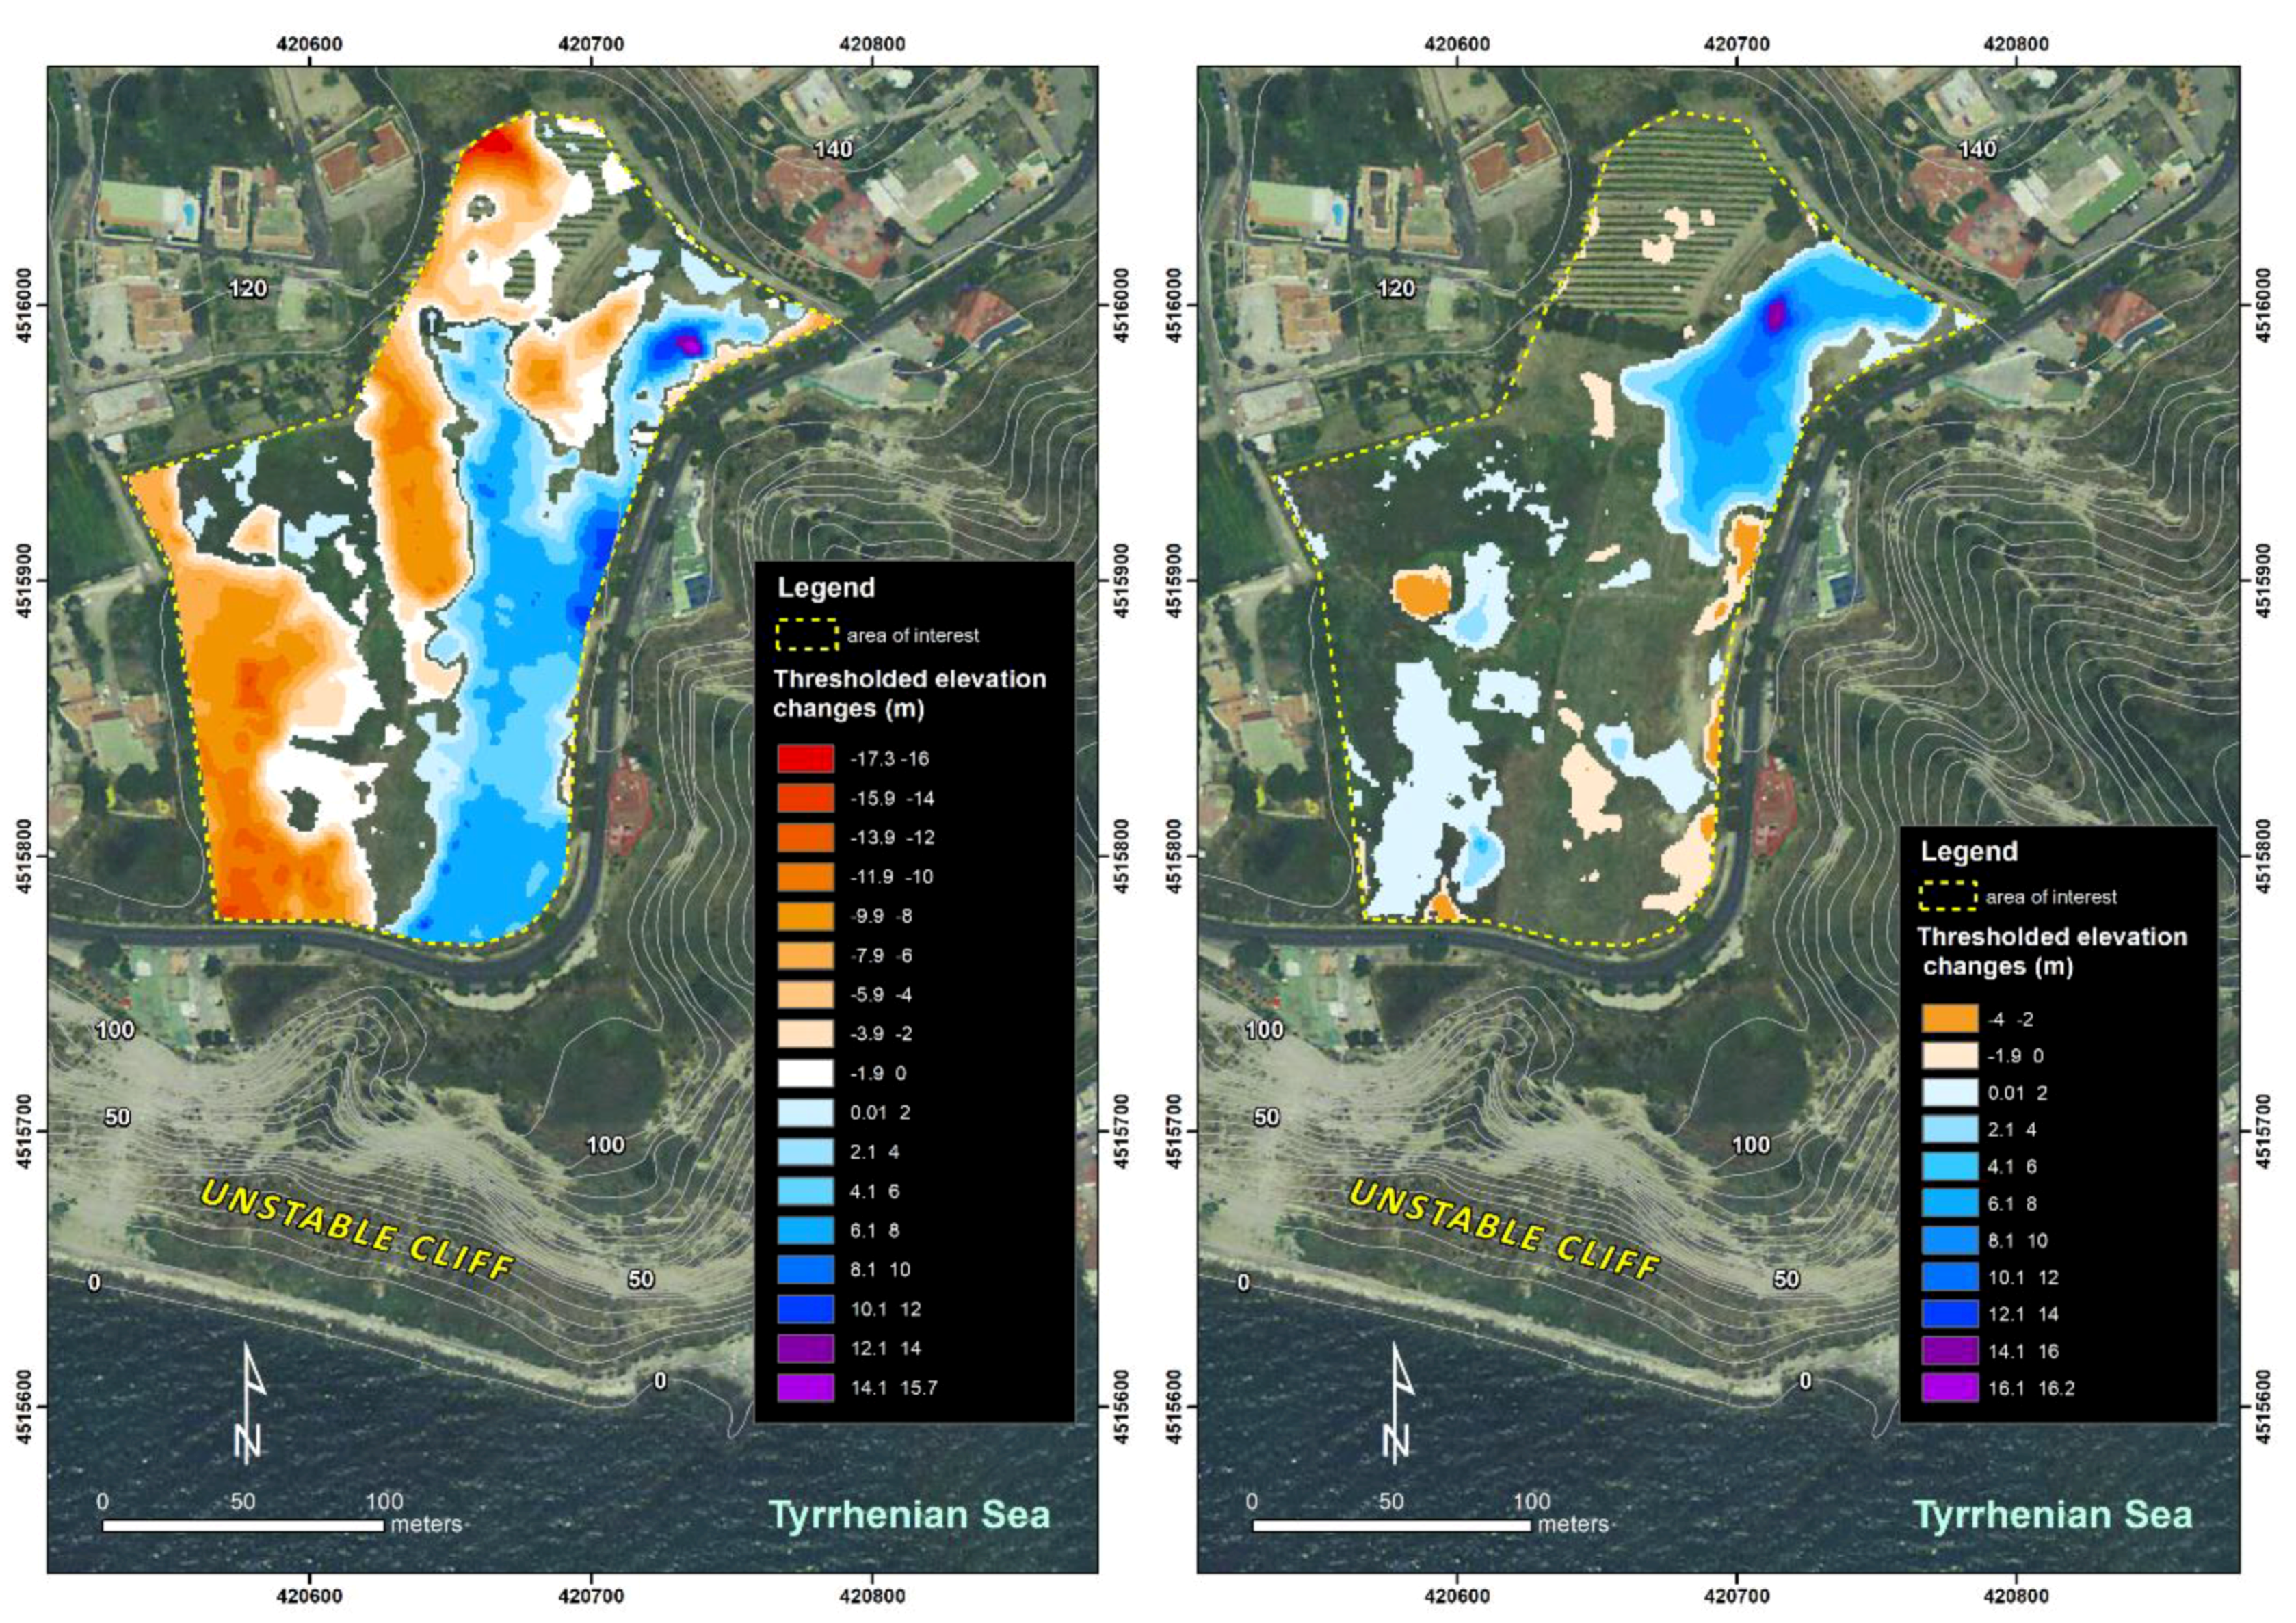
3.3. Change Detection

The DEMs were compared by means of the Geomorphic Change Detection software (http://gcdworkshop.joewheaton.org/). This has been implemented as an open source plug-in compatible with the most recent versions of the ESRI ArcGis application. The DEMs comparison (i.e., change detection) consisted in an automatic pixel-by-pixel calculation of elevation changes between two consecutive models, by subtracting the earlier model to the later one [47]. In this way, two DEMs of Difference (DoDs) of the study area, containing elevation changes between 1956 and 1974, and between 1974 and 2008, were respectively produced. Each DoD was thresholded in order to filter real changes from noise, by specifying a Minimum Level of Detection (minLoD) [48]. This consists in a value (threshold) beneath which all DoD data are considered unreal with respect to those falling above the threshold. In order to assess the minLoD threshold, we used the empirical approach proposed by Zhang et al. [49]. This method consists in the calculation of elevation differences related to solid, flat surfaces adjacent to the study area that can be retained as stable within the considered time intervals. In our case, we computed elevation differences on 3 paved transects and 2 flat areas characterized by unchanged position and land use, as verified from the visual interpretation of aerial photographs. Elevation data were obtained from all the DEM cells occurring in correspondence of the digitized transects and areas (i.e., every 1 m or 1 m2). The RMSEz of differences between each couple of transect/area was then calculated and, in order to obtain a specific minLoD for each change detection analysis, the resulting values were finally averaged. Each change detection analysis was referred to an area of interest (AOI) defined on the basis of the current topographic properties of the analyzed site and any other relevant information provided by local residents concerning the possible location of the landfill. As an output of the two analyses, the GCD software provided numerical results representing areas, volumes, and the average depths of the excavated and accumulated material in the AOI. The standard deviation for all the calculated values was also estimated.

4. Results

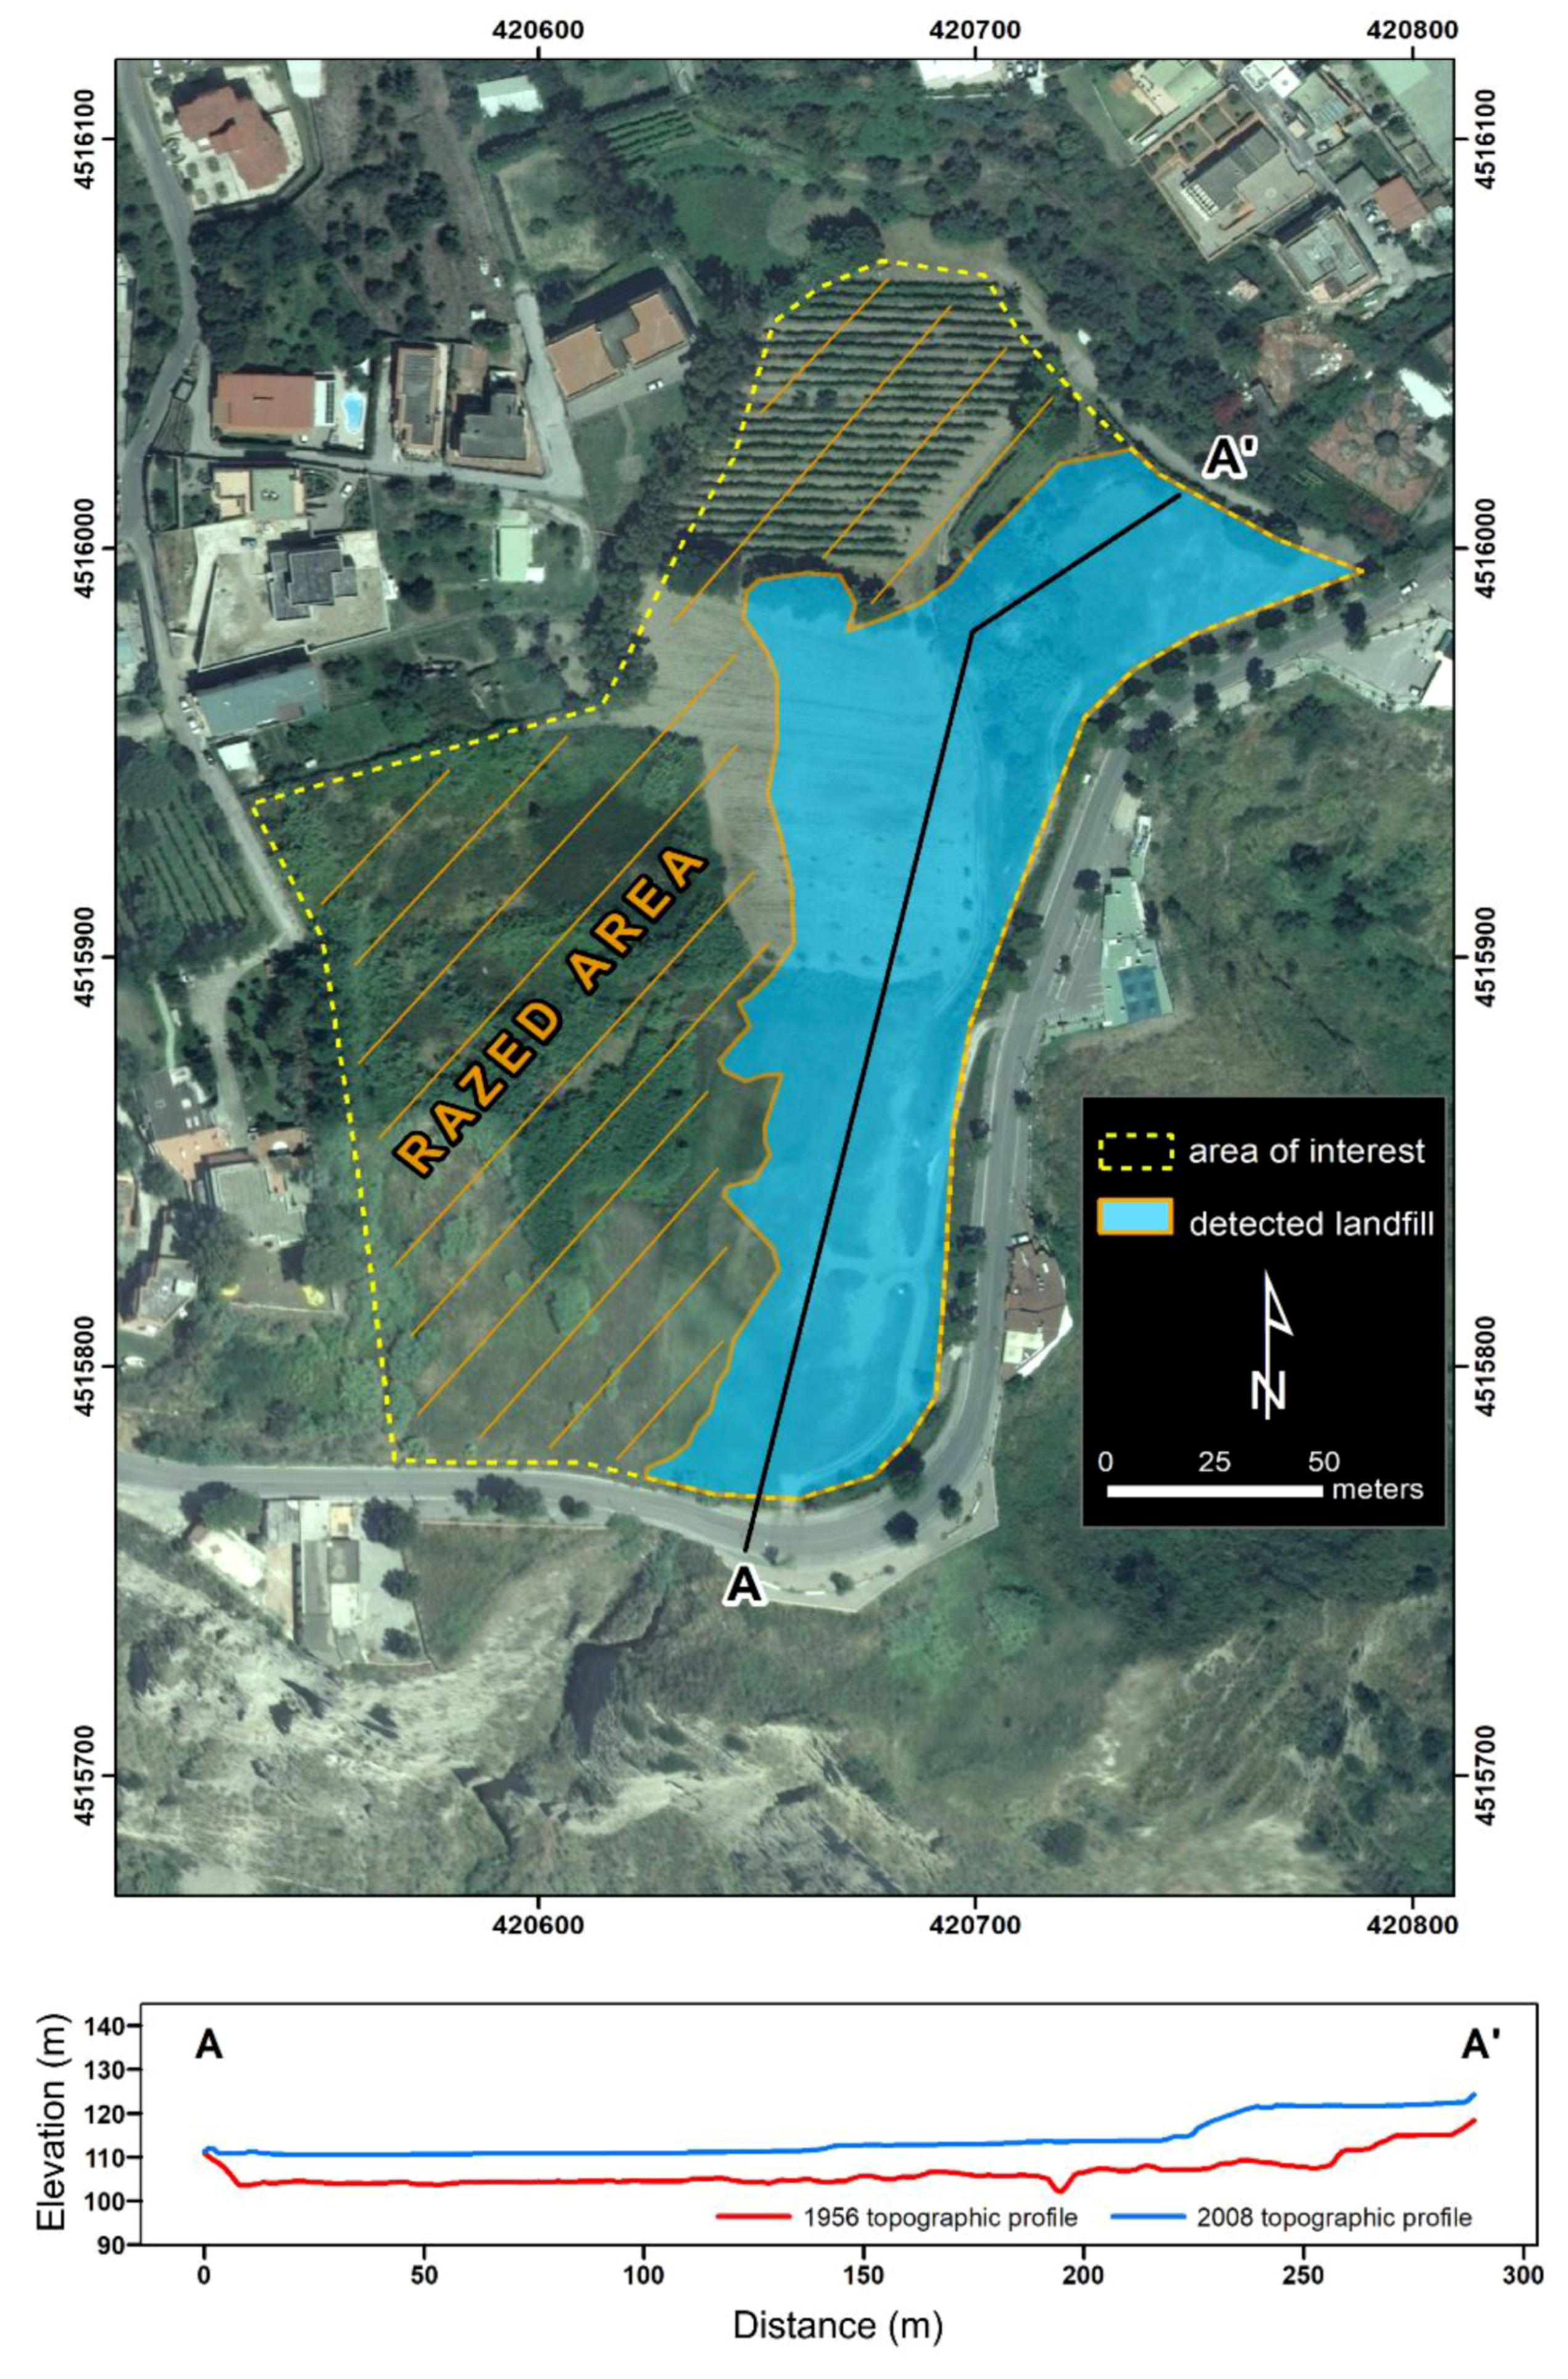
4.1. Geomorphic Evolution and Land Use Changes

The visual comparative analysis of topographic maps of the study area shows evident modifications of the landscape due to the urban development and quarrying activity. The topographic map of 1870 (Figure 3A) displays the initial reference landscape of the study area with negligible modifications referable to human activity. The general morphology is characterized by a NW-SE oriented ridge bounded to the south by the Torrefumo coastal cliff. Topographic data indicate that the landscape remains almost unaltered until the 1936 (Figure 3B). The map of 1965 (Figure 3C) displays evidence of early urbanization in the eastern sector of the area, along with a distinct excavation activity, including anthropic scarps. This is particularly clear to the SW of Mt Grillo where a quarry for the extraction of “pozzolana” (i.e., a special variety of volcanic ash used as mortar for brick constructions) has been active from the late 1930s throughout the Second World War. In the 2004 map (Figure 3D), after ca. 40 years, there is no longer any trace of the quarry, and a small flat area is present at the top of the coastal cliff.
Historical aerial photographs available since 1943 allowed a better definition of the timing of the quarrying activity. In 1943 (Figure 4A), a small, elongated quarried area can be observed, whereas in 1956 (Figure 4B) the site appears to be partially filled, and evidences of ongoing excavation are found instead in the northern and western sector of the area. In 1974 (Figure 4C) there is indication of a significant change in the land use associated with the construction of new roads and buildings, along with an enlargement of the quarrying activity towards the edge of the coastal cliff. The photograph of 1998 (Figure 4D) displays a further development of the road network and new buildings in the area. The quarry appears to be filled up and a little plain can be observed.
These evidences suggest that the quarrying activity started between 1936 and 1943 and terminated after 1974, probably in the early 1980s, as recalled and confirmed by people living in the area.

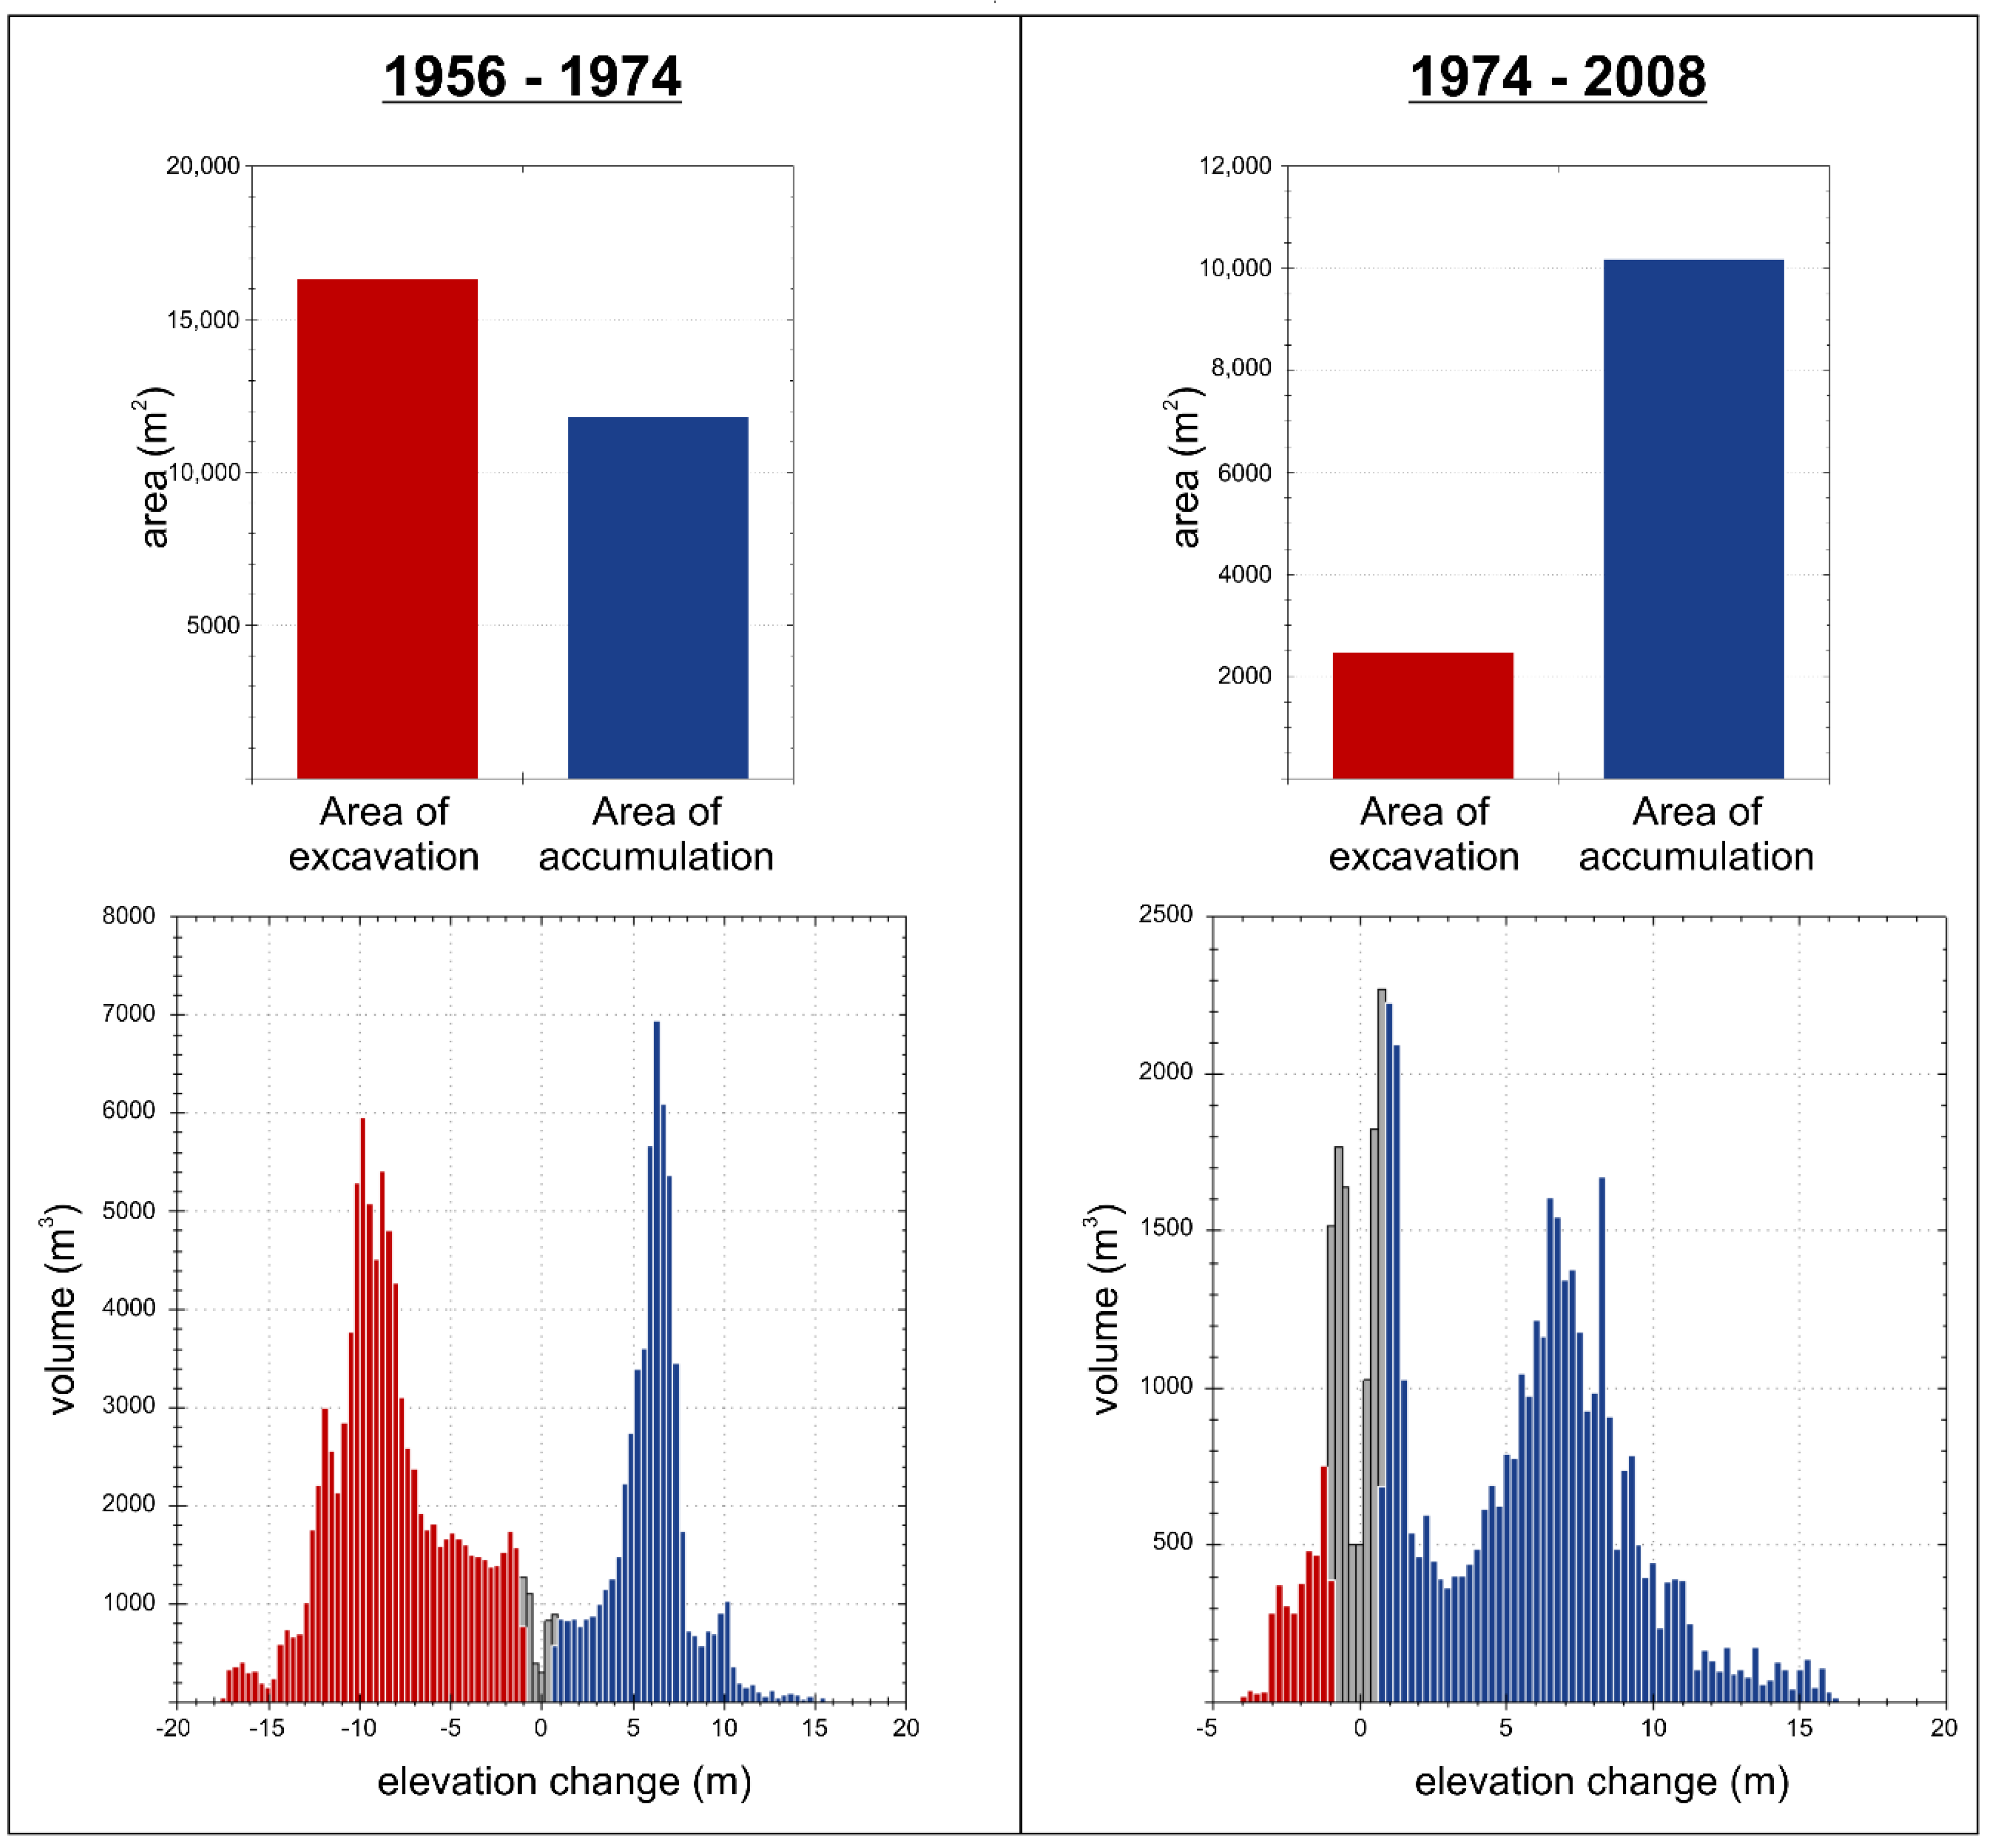
4.2. Quantitative Topographic Changes

The data used for thresholds calculation are listed in Table 1. The threshold used to compare the 1956 and 1974 DEMs has been estimated in ±0.83 m. The threshold used to compare the 1974 and 2008 DEMs has been estimated in ±0.93 m.
The results of the change detection analyses show that both negative (i.e., excavation) and positive (i.e., accumulation) elevation changes occurred in the study site, affecting an area of ca. 37,500 m2 (Figure 5 and Figure 6). Between 1956 and 1974, the extension of the AOI sector involved by excavation activity (16,312 m2) prevails over the sector involved by accumulation of waste materials (11,796 m2) (Figure 5 and Figure 6). On the contrary, during the period 1974–2008 period, positive elevation changes are more widespread than excavation (Figure 5 and Figure 6, Table 2).
A similar pattern is shown by volumetric changes, suggesting that the largest volume of material (58,687 ± 9790 m3) was accumulated between 1956 and 1974, with an average depth of 5 ± 0.8 m and a maximum depth of 15.7 m. During the 1974–2008 time period, the volume of accumulated material is equal to 37,032 ± 9463 m3, with an average depth of 3.6 ± 0.9 m and a maximum localized depth of 16.2 m (Table 2). The spatial distribution of the overall positive changes (Figure 5) indicates that these are concentrated in the eastern sector of the AOI, which consequently can be identified as the precise of landfill site. Negative elevation changes occurred during the first period are instead located in the western and central parts of the AOI, with an average depth of −5.8 ± 0.8 m and a maximum depth of −17.3 m. Conversely, excavation activity conducted between 1974 and 2008 displays a patchy distribution and a lower average depth of −1.5 ± 0.9 m, with a maximum localized depth of −4 m.
Histograms displaying elevation changes versus corresponding volumes (Figure 6) show significant differences in terms of statistical distribution. Generally, a more symmetric distribution for both elevation changes and volumes resulted for the 1956–1974 period, whereas a prevalence of positive changes (i.e., accumulation) with respect to the negative ones occurs for the 1974–2008.
The perimeter of the detected landfill (Figure 7) was traced taking into account the spatial distribution of the positive elevation changes displayed in Figure 5. The elevation difference between the two topographic profiles (Figure 7), representing the 1956 and 2008 ground surfaces (ca. 8 m), highlights the average accommodation space filled up by the waste material through time, beneath the present-day ground surface. The area involved by the buried landfill has an extension of ca. 14,350 m2. Our results suggest that since the end of the last century, the site land use remained substantially unaltered, as shown by a comparison between the 1998 aerial photograph (Figure 4D) and orthophoto of 2014 (Figure 7). This is also in agreement with the lack of evidence for significant topographic changes during the same time interval.

5. Discussion

The methodology described in this study allowed for the detection and geometrical characterization of a landfill site located along the Campi Flegrei coastline, close to the urban area of Naples. Since historical times, volcaniclastic rocks (e.g., “pozzolana”, tuff, and ignimbrite) cropping out in the area have been extensively exploited as construction materials. The massive urbanization started since the second half of the last century and was often accompanied by a significant increase in the number of open-pit mines, required for the extraction of building materials. After exploitation, many quarries were illegally used as sites for the storage of different types of wastes, which were often covered with volcanic reworked soils. In some instances, buildings were even founded on these deposits [31]. Notwithstanding the high level of volcanic hazard (e.g., [38]), the Campi Flegrei is a highly urbanized area where detection of abandoned, buried landfill sites may be quite difficult in the field.
As already proposed by other authors (e.g., [24,25,26,27]), our study suggests that the analysis of historical aerial photographs and topographic maps provides an effective tool for a rapid identification of buried landfill sites and associated anthropogenic landforms. Aerial photographs can be used for (a) the identification of unknown landfills; (b) the analysis of their historical evolution; and (c) the quantitative assessment of their volume and geometry. Photogrammetric processing of the black and white aerial stereo-pairs used in this study, coupled with airborne lidar data, allowed for calculation of the areal extent of the analyzed landfill (14,350 m2) and the total volume of the accumulated waste materials (ca. 100,000 m3). The multi-temporal change detection analysis (Figure 5) evidenced that most of the landfill material was accumulated between 1956 and 1974, whereas relatively smaller volumes of waste were locally accumulated in the north-eastern sector during the period 1974–2008 (Figure 5 and Table 2). These findings were also supported by the visual interpretation of historical maps and supplementary aerial photographs that led to the identification of different stages in the morphological evolution of the study site, including (a) an initial stage characterized by the original topography; (b) a phase of open-quarry excavation activities; (c) a phase of filling of the quarried area by waste materials; (d) a final phase characterized by progressive reshaping of the excavated area (Figure 3 and Figure 4). In this way, the timing of development stages of the analyzed landfill have been also obtained.
The multi-temporal change detection analysis indicated that the average thickness of the landfill is in the order of 8 m. However, due to the lack of suitable aerial stereo-pairs available for the period before 1956, it cannot be excluded that the actual thickness of the landfill could be somewhat higher than 8 m. At the same time, the lack of additional stereo-pairs surveys in between 1956 and 1974, hampers the possibility of detecting other possible excavation or filling operations occurred in the same area. Consequently the calculated volumes should be evaluated in terms of minimum values, without considering eventual intermediate changes. This circumstance underlines a limit of the used methodology. In fact, this is strictly dependent on the availability of historical data and, in some cases, both temporal and spatial resolution of aerial datasets could be not proper for performing multi-temporal analysis aimed at analyzing anthropogenic landforms. In spite of this, the adopted remote sensing technologies permit accurate detection and calculation of the geometry of known and unknown landfills, and provide a sound base for the scientific community and stakeholders to improve environmental characterization and the hazard analysis associated with these anthropogenic landforms.
According with de Wet [28], the best methodological approach includes full integration of remotely derived information with field observations, near-surface geophysics, and in-situ sampling. Improper management of wastes may cause serious threats to public health, due to the high intrinsic probability for the triggering of associated phenomena, including subsidence, fire, and contamination of air, soil, and water [50]. In our approach, the assessment of topographic changes and volumetric calculation of the landfill was based on quantitative change detections exploiting photogrammetry- and ALS-derived DEMs, to minimize subjective interpretation of the datasets. In order to assess the level of risk associated with pollutants, details on the contents of the detected landfill are thus essential. Inspection and sampling of buried waste materials by direct investigation (e.g., boreholes) are normally advisable, although these operations may not be costs-effective and timely, or even not compatible with local land use and planning strategies [15]. In some cases, direct investigations have even caused additional environmental issues at polluted sites [14], particularly when the geometry and the areal extent of the buried landfill were unknown.
A further issue to be considered in order to evaluate the hazards associated with the study site is related to the geomorphological evolution of the coastal cliff delimiting the southern side of the landfill. Here, anthropogenic and geological processes may interfere and cause negative impacts on the environment and human health. The Torrefumo cliff, in fact, experienced significant retreat processes over the last decades with recession rates up to 1.2 m/year, occurring through landslides, marine and surface erosion [30]. After the construction of a seawall to protect the cliff toe from the sea wave action, recession was substantially reduced. Future collapses may therefore affect the cliff face with potential consequences for the nearby landfill and the road at the top of the cliff (Figure 7).

6. Conclusions

This study illustrates an integrated approach for the detection and geometrical characterization of a buried landfill, based on a full combination of (1) analysis of historical topographic maps, (2) aerial photographs, and (3) airborne lidar data. The landfill analyzed in this study is located in the vicinity of Monte di Procida along the Campi Flegrei coastline, South Italy, and was detected in correspondence of an old quarry located over a small plain at 100–120 m a.s.l., close to the top of a coastal cliff.
The visual comparative analysis of available topographic maps (1870, 1936, 1965 and 2004) and aerial photographs (1943, 1956, 1974 and 1998) clearly showed modifications of the landscape due to the urban development and anthropic activity through time. Our results indicate that quarrying activity started in the mid-30s and lasted probably until the early 1980s. In 1998 the quarry was already fully covered and filled up by waste deposits. The relatively flat top surface that was created by the accumulation of the infilling wastes is presently utilized as a parking place. The change detection analysis shows that both negative and positive elevation changes occurred between 1956 and 2008 in the study area. Most of the accumulation occurred between 1956 and 1974, and subordinately during the period 1974–2008. Quantitative determinations indicate that the landfill has an areal extent of 14,350 m2, an average thickness of 8 m and a volume of ca. 100,000 m3. The calculated values should be considered in terms of minimum values, as eventual intermediate changes were not detectable in between the dates of the used DEMs.
The results discussed in this study suggest that multi-temporal topographic datasets, often already available at regional or national authorities, may provide a sound base for further direct investigations, monitoring strategies and assessment of environmental hazards associated with buried landfills.

Author Contributions

Data curation, G.E.; Investigation, G.E.; Project administration, M.S.; Validation, F.M.; Writing—original draft, G.E. and F.M.; Writing—review & editing, G.E., F.M. and M.S.

Funding

This research was funded by the Italian Ministry of Education, University and Research (MIUR) under the project “MONitoraggio Innovativo per le Coste e l’Ambiente marino—MONICA” grant number PON01_01525.

Acknowledgments

We are grateful to the Città Metropoliana di Napoli for providing us airborne lidar data, and to Riccardo Salvini of the University of Siena (Italy)—Centre of GeoTechnologies, for making available the software used in the photogrammetric and GIS analyses.

Conflicts of Interest

The authors declare no conflict of interest.

References

  1. Chabuk, A.; Al-Ansari, N.; Hussain, H.M.; Knutsson, S.; Pusch, R.; Laue, J. Combining GIS Applications and Method of Multi-Criteria Decision-Making (AHP) for Landfill Siting in Al-Hashimiyah Qadhaa, Babylon, Iraq. Sustainibility 2017, 9, 1932. [Google Scholar] [CrossRef]
  2. El-Fadel, M.; Sadek, S.; Chahine, W. Environmental Management of Quarries as Waste Disposal Facilities. Environ. Manag. 2001, 27, 515–531. [Google Scholar] [CrossRef]
  3. Dal Sasso, P.; Ottolino, M.A.; Caliandro, L.P. Identification of Quarries Rehabilitation Scenarios: A Case Study within the Metropolitan Area of Bari (Italy). Environ. Manag. 2012, 49, 1174–1191. [Google Scholar] [CrossRef] [PubMed]
  4. Henry, R.K.; Zhao, Y.; Dong, J. Municipal solid waste management challenges in developing countries—Kenyan case study. Waste Manag. 2006, 26, 92–100. [Google Scholar] [CrossRef] [PubMed]
  5. Kasseva, M.E.; Mbuligwe, S.E. Ramifications of solid waste disposal site relocation in urban areas of developing countries: A case study in Tanzania. Resour. Conserv. Recycl. 2000, 28, 147–161. [Google Scholar] [CrossRef]
  6. Goldberg, M.S.; Siemiatyck, J.; Dewar, R.; Désy, M.; Riberdyet, H. Risks of developing cancer relative to living near a municipal solid waste landfill site in Montreal, Quebec, Canada. Arch. Environ. Health Int. J. 1999, 54, 291–296. [Google Scholar] [CrossRef] [PubMed]
  7. Kaliampakos, D.C. Rehabilitation of an abandoned quarry used as uncontrolled landfill. Int. J. Surf. Min. Reclam. Environ. 1998, 12, 61–65. [Google Scholar] [CrossRef]
  8. Tsolaki-Fiaka, S.; Bathrellos, G.D.; Skilodimou, H.D. Multi-Criteria Decision Analysis for an Abandoned Quarry in the Evros Region (NE Greece). Land 2018, 7, 43. [Google Scholar] [CrossRef]
  9. Massmann, J.; Freeze, R.A. Groundwater contamination from waste management sites: The interaction between risk-based engineering design and regulatory policy: 1. Methodology. Water Resour. Res. 1987, 23, 351–367. [Google Scholar] [CrossRef]
  10. Bugan, R.; Tredoux, G.; Jovanovic, N.; Israel, S. Pollution plume development in the primary aquifer at the atlantis historical solid waste disposal site, South Africa. Geosciences 2018, 8, 231. [Google Scholar] [CrossRef]
  11. El-Fadel, M.; Findikakis, A.N.; Leckie, J.O. Environmental impacts of solid waste landfilling. J. Environ. Manag. 1997, 50, 1–25. [Google Scholar] [CrossRef]
  12. Blight, G.E.; Fourie, A.B. Catastrophe revisited—Disastrous flow failures of mine and municipal solid waste. Geotech. Geol. Eng. 2005, 23, 219–248. [Google Scholar] [CrossRef]
  13. Peng, R.; Hou, Y.; Zhan, L.; Yao, Y. Back-analyses of landfill instability induced by high water level: Case study of shenzhen landfill. Int. J. Environ. Res. Public Health 2016, 13, 126. [Google Scholar] [CrossRef] [PubMed]
  14. Soupios, P.; Papadopoulos, I.; Kouli, M.; Georgaki, I.; Vallianatos, F.; Kokkinouet, E. Investigation of waste disposal areas using electrical methods: A case study from Chania, Crete, Greece. Environ. Geol. 2007, 51, 1249–1261. [Google Scholar] [CrossRef]
  15. Orlando, L.; Marchesi, E. Georadar as a tool to identify and characterise solid waste dump deposits. J. Appl. Geophys. 2001, 48, 163–174. [Google Scholar] [CrossRef]
  16. Bavusi, M.; Rizzo, E.; Lapenna, V. Electromagnetic methods to characterize the Savoia di Lucania waste dump (Southern Italy). Environ. Geol. 2006, 51, 301–308. [Google Scholar] [CrossRef]
  17. Wu, T.N.; Huang, Y.C. Detection of Illegal Dump Deposit with GPR: Case Study. Pract. Period. Hazard. Toxic Radioact. Waste Manag. 2006, 10, 144–149. [Google Scholar] [CrossRef]
  18. Soupios, P.; Papadopoulos, N.; Papadopoulos, I.; Kouli, M.; Vallianatos, F.; Sarris, A.; Manios, T. Application of integrated methods in mapping waste disposal areas. Environ. Geol. 2007, 53, 661–675. [Google Scholar] [CrossRef]
  19. Di Fiore, V.; Cavuoto, G.; Punzo, M.; Tarallo, D.; Casazza, M.; Guarriello, S.M.; Lega, M. Integrated hierarchical geo-environmental survey strategy applied to the detection and investigation of an illegal landfill: A case study in the Campania Region (Southern Italy). Forensic Sci. Int. 2017, 279, 96–105. [Google Scholar] [CrossRef] [PubMed]
  20. Koda, E.; Tkaczyk, A.; Lech, M.; Osiński, P. Application of electrical resistivity data sets for the evaluation of the pollution concentration level within landfill subsoil. Appl. Sci. 2017, 7, 262. [Google Scholar] [CrossRef]
  21. Kowalczyk, S.; Cabalski, K.; Radzikowski, M. Application of geophysical methods in the evaluation of anthropogenic transformation of the ground: A case study of the Warsaw environs, Poland. Eng. Geol. 2017, 216, 42–55. [Google Scholar] [CrossRef]
  22. Silvestri, S.; Omri, M. A method for the remote sensing identification of uncontrolled landfills: Formulation and validation. Int. J. Remote Sens. 2009, 29, 975–989. [Google Scholar] [CrossRef]
  23. Persechino, G.; Schiano, P.; Lega, M.; Napoli, R.M.A.; Ferrara, C.; Kosmatka, J. Aerospace-based support systems and interoperability: the solution to fight illegal dumping. WIT Trans. Ecol. Environ. 2010, 140, 203–214. [Google Scholar] [CrossRef] [Green Version]
  24. Erb, T.L.; Philipson, W.R.; Tang, W.T.; Liang, T. Analysis of landfills with historic air photos. Photogramm. Eng. Remote Sens. 1981, 47, 1363–1369. [Google Scholar]
  25. Lyon, J.G. Use of maps, aerial photographs, and other remote sensor data for practical evaluations of hazardous waste sites. Photogramm. Eng. Remote Sens. 1987, 53, 515–519. [Google Scholar]
  26. Pope, P.; Van Eeckhout, E.; And Rofer, C. Waste site characterization through digital analysis of historical aerial photographs. Photogramm. Eng. Remote Sens. 1996, 62, 1387–1394. [Google Scholar]
  27. De Wet, A.P.; Sternberg, R.; Winick, J. Interpreting land-use history by integrating aerial photographs, near-surface geophysics, and field observations into a digital database. Environ. Eng. Geosci. 1999, 5, 235–254. [Google Scholar] [CrossRef]
  28. De Wet, A.P. Discovering and characterizing abandoned waste disposal sites using Lidar and aerial photography. Environ. Eng. Geosci. 2016, 22, 113–130. [Google Scholar] [CrossRef]
  29. Esposito, G.; Semaan, F.; Salvini, R.; Troise, C.; Somma, R.; Matano, F.; Sacchi, M. Ground-based LiDAR application to characterize sea cliff instability processes along a densely populated coastline in Southern Italy. In Proceedings of the EGU General Assembly, Vienna, Austria, 23–28 April 2017; European Geosciences Union: Munich, Germany, 2017; Volume 17, p. 6983. [Google Scholar]
  30. Esposito, G.; Salvini, R.; Matano, F.; Sacchi, M.; Troise, C. Evaluation of geomorphic changes and retreat rates of a coastal pyroclastic cliff in the Campi Flegrei volcanic district, Southern Italy. J. Coast. Conserv. 2018, 22, 1–16. [Google Scholar] [CrossRef]
  31. Esposito, G.; Salvini, R.; Matano, F.; Sacchi, M.; Danzi, M.; Somma, R.; Troise, C. Multitemporal monitoring of a coastal landslide through sfm-derived point cloud comparison. Photogramm. Rec. 2017, 32, 459–479. [Google Scholar] [CrossRef]
  32. Matano, F.; Pignalosa, A.; Marino, E.; Esposito, G.; Caccavale, M.; Caputo, T.; Sacchi, M.; Somma, R.; Troise, C.; De Natale, G. Laser scanning application for geostructural analysis of tuffaceous coastal cliffs: The case of Punta Epitaffio, Pozzuoli Bay, Italy. Eur. J. Remote Sens. 2015, 48, 615–637. [Google Scholar] [CrossRef]
  33. Matano, F.; Iuliano, S.; Somma, R.; Marino, E.; Del Vecchio, U.; Esposito, G.; Molisso, F.; Scepi, G.; Grimaldi, G.M.; Pignalosa, A.; et al. Geostructure of Coroglio tuff cliff, Naples (Italy) derived from terrestrial laser scanner data. J. Maps 2016, 12, 407–421. [Google Scholar] [CrossRef]
  34. Rosi, M.; Sbrana, A. Phlegrean Fields; Consiglio Nazionale delle Ricerche, Quaderni del “La Ricerca Scientifica”: Roma, Italy, 1987. [Google Scholar]
  35. De Vivo, B.; Rolandi, G.; Gans, P.B.; Calvert, A.; Bohrson, W.A.; Spera, F.J.; Belkin, H.E. New constraints on the pyroclastic eruptive history of the Campanian Volcanic Plain (Italy). Miner. Petrol. 2001, 73, 47–65. [Google Scholar] [CrossRef]
  36. Scarpati, C.; Cole, P.; Perrotta, A. The Neapolitan Yellow—A large volume multiphase eruption from Campi Flegrei, southern Italy. Bull. Volcanol. 1993, 55, 343–356. [Google Scholar] [CrossRef]
  37. Deino, A.L.; Orsi, G.; de Vita, S.; Piochi, M. The age of the Neapolitan Yellow Tuff caldera-forming eruption (Campi Flegrei caldera, Italy) assessed by 40Ar/39Ar dating method. J. Volcanol. Geotherm. Res. 2004, 133, 157–170. [Google Scholar] [CrossRef]
  38. De Natale, G.; Troise, C.; Pingue, F.; Mastrolorenzo, G.; Pappalardo, L.; Battaglia, M.; Boschi, E. The Campi Flegrei caldera: Unrest mechanisms and hazards. Geol. Soc. Spec. Publ. 2006, 269, 25–45. [Google Scholar] [CrossRef]
  39. Beneduce, P.; D’Elia, G.; Guida, M. Morfodinamica dei versanti dell’area flegrea (Campania): Erosione in massa ed erosione lineare. Mem. Soc. Geol. Ital. 1988, 41, 949–961. [Google Scholar]
  40. Esposito, G.; Matano, F.; Scepi, G. Analysis of Increasing Flash Flood Frequency in the Densely Urbanized Coastline of the Campi Flegrei Volcanic Area, Italy. Front. Earth Sci. 2018, 6, 1–17. [Google Scholar] [CrossRef]
  41. Perrotta, A.; Scarpati, C.; Luongo, G.; Morra, V. Stratigraphy and volcanological evolution of the southwestern sector of Campi Flegrei and Procida Island, Italy. Geol. Soc. Am. Spec. Pap. 2011, 464, 171–191. [Google Scholar] [CrossRef]
  42. Sit Città Metropolitana di Napoli. Available online: http://sit.cittametropolitana.na.it/SGI/pdf/26-Dintorni%20di%20Napoli.pdf (accessed on 10 September 2018).
  43. Istituto Geografico Militare. Available online: https://www.igmi.org/geoprodotti/raster/1/JPG300_DPI_edizione_precedente/foglio-1515569683.44 (accessed on 10 September 2018).
  44. SIT Città Metropolitana di Napoli. Available online: http://sit.cittametropolitana.na.it/territorio/cartografia/10k65/10KPDF/25_marca.pdf (accessed on 10 September 2018).
  45. Regione Campania. Available online: http://sit.regione.campania.it/ctr5k_2004/elementi_pdf/465011NA.pdf (accessed on 10 September 2018).
  46. Istituto Geografico Militare. Available online: https://www.igmi.org/it/geoprodotti#b_start=0 (accessed on 10 September 2018).
  47. Allan James, L.; Hodgson, M.E.; Ghoshal, S.; Latiolais, M.M. Geomorphic change detection using historic maps and DEM differencing: The temporal dimension of geospatial analysis. Geomorphology 2012, 137, 181–198. [Google Scholar] [CrossRef]
  48. Passalacqua, P.; Belmont, P.; Staley, D.M.; Simley, J.D.; Arrowsmith, J.R.; Bode, C.A.; Crosby, C.; Delong, S.B.; Glenn, N.F.; Kelly, S.A.; et al. Analyzing high resolution topography for advancing the understanding of mass and energy transfer through landscapes: A review. Earth Sci. Rev. 2015, 148, 174–193. [Google Scholar] [CrossRef] [Green Version]
  49. Zhang, K.; Whitman, D.; Leatherman, S.; Robertson, W. Quantification of beach changes caused by hurricane Floyd along Florida’s Atlantic coast using airborne laser surveys. J. Coast. Res. 2005, 21, 123–134. [Google Scholar] [CrossRef]
  50. Demirbas, A. Waste management, waste resource facilities and waste conversion processes. Energy Convers. Manag. 2011, 52, 1280–1287. [Google Scholar] [CrossRef]
Figure 1. Structural sketch map of the Campi Flegrei volcanic area with location of the study site.
Geosciences 08 00348 g001
Figure 2. Stratigraphic section representing the geological setting of the study area (modified from Perrotta et al. [41] and Esposito et al. [30]).
Geosciences 08 00348 g002
Figure 3. Comparison between topographic maps of 1870 (A), 1936 (B), 1965 (C), and 2004 (D), respectively at 1:25,000 (B), 1:10,000 (A,C), and 1:5000 (D) original scales. Blue polygons indicate the location of the investigated area. Coordinates are in the reference system ETRF 2000/UTM—zone 33 N.
Geosciences 08 00348 g003
Figure 4. Comparison between aerial photos acquired by the Italian Military Geographic Institute in 1943 (A), 1956 (B), 1974 (C) and 1998 (D). Cyan polygons indicate the location of the investigated area. Dashed red line marks the limits of the quarry area. Coordinates are in the reference system ETRF 2000/UTM—zone 33 N.
Geosciences 08 00348 g004
Figure 5. Digital elevation models (DEMs) of difference.
Geosciences 08 00348 g005
Figure 6. Statistical distribution of both areal (above) ad volumetric elevation changes (below) obtained by the multi-temporal change detection analyses. Gray bars indicate changes beneath the error threshold that have been excluded from quantitative assessment.
Geosciences 08 00348 g006
Figure 7. Map representing the areal extent of the detected landfill, and two cross-sections delimiting deposits laying between the 1956 and 2008 ground surfaces. Orthophoto in background is related to the year 2014 (Courtesy of Regione Campania).
Geosciences 08 00348 g007
Table 1. Elevation differences calculated along the selected transect/area and resulting minLoD values.
TransectLength (m)RMSEz 1956–1974 (m)RMSEz 1974–2008 (m)
Transect 11641.071.16
Transect 21300.730.75
Transect 3850.60.86
AreaSurface (m2)
Area 116001.291.05
Area 210800.460.82
Average RMSEz0.830.93
Table 2. Thresholded results of the change detection analyses.
Change Detection Results
1956–19741974–2008
Total area of excavation (m2)16,3122472
Total area of accumulation (m2)11,79610,176
Total volume of excavation (m3)94,394 ± 13,5383848 ± 2298
Total volume of accumulation (m3)58,687 ± 979037,032 ± 9463
Average depth of excavation (m)−5.8 ± 0.8−1.5 ± 0.9
Average depth of accumulation (m)5 ± 0.83.6 ± 0.9
Percent by volume of excavation (%)6210
Percent by volume of accumulation (%)3890

