Effect of Corporate Governance on Institutional Investors’ Preferences: An Empirical Investigation in Taiwan

1
International Bachelor Degree Program in Finance, National Pingtung University of Science and Technology, Neipu Pingtung 912, Taiwan
2
Graduate Institute of Finance, National Pingtung University of Science and Technology, Neipu Pingtung 912, Taiwan
*
Author to whom correspondence should be addressed.
J. Risk Financial Manag. 2019, 12(1), 32; https://doi.org/10.3390/jrfm12010032
Submission received: 31 December 2018
/
Revised: 3 February 2019
/
Accepted: 10 February 2019
/
Published: 14 February 2019
(This article belongs to the Special Issue Empirical Finance)
Abstract
:This study discusses the institutional investors’ shareholding base on corporate governance system in Taiwan. The sample was 4760 Taiwanese companies from 2005 to 2012. Then, this study established six hypotheses to investigate the effects of corporate governance on institutional investors’ shareholdings. The panel data regression model and piecewise regression model were adopted to determine whether six hypotheses are supported. For sensitive analysis, additional consideration was given on the basis of industrial category (electronics or nonelectronics), and the 2008–2010 global financial crises. This study discovered that a nonlinear relationship exists between the domestic institutional investors’ shareholdings. The managerial ownership ratio and blockholder ownership ratio have positive effects both on domestic and foreign institutional investors. However, domestic and foreign institutional investors have distinct opinions regarding independent director ratios. Finally, the corporate governance did not improve institutional investors’ shareholdings during financial crisis periods; instead, they paid more attention to firm profits or other characteristics.

1. Introduction
The Cadbury Report (Cadbury 1992) was first produced by the Committee on the Financial Aspects of Corporate Governance (Cadbury Committee), which provided the definition of corporate governance as the “system by which companies are directed and controlled”, voluntary adoption of the governance best practices and the “comply or explain” principle (Shan and Napier 2014). The Cadbury Report (Cadbury 1992) has proven important influences on development of corporate governance codes worldwide.
The 1997 Asian financial crisis severely affected the economies of Southeast Asia because of the exit of foreign capital after property assets collapsed; this was a consequence of the lack of corporate governance mechanisms in these countries. After the 1997 financial crisis in Asia, there are series of corporate fraud cases and distressed debt broke out in Taiwan. The Taiwanese government has been propagating the importance of corporate government to corporations since 1998.
In the United States, the 2001 Enron and Xerox cases led Congress to legislate the Sarbanes–Oxley Act to reinforce corporate governance in the United States. Therefore, corporate governance has become a crucial subject garnering increased political interest. The passing of the law restored the accuracy and reliability of financial information and established a series of requirements that affected U.S. corporate governance and influenced similar laws in multiple countries, including Taiwan. In 2006, Taiwanese government were legislated the Company Law and Securities and Exchange Act to empower corporate governance principles. Company Law is the regulation for corporate governance, including the operations of shareholders’ meetings, board of directors and supervisors. On 11 January 2006, amendments to the Securities and Exchange Act were announced independent directors and audit committees as well as to strength the function, structure and operations of a company’s board of directors.
In 1999, the World Bank stated that corporate governance comprises internal and external aspects. Internal corporate governance, which involves monitoring activities and then taking corrective action to accomplish organizational goals, facilitates internal monitoring by the board of directors. By contrast, external corporate governance involves externally monitoring manager behavior by including an independent third party (i.e., an external auditor). Thus, corporate governance is a system of law and sound approaches by which corporations are directed and controlled, focusing on internal and external corporate structures to monitor the actions of management and directors.
Jensen and Meckling (1976) discussed conflicts of interest between various contracting parties, including shareholders, corporate managers and debt holders. They found that agency costs generated by the existence of debt and outside equity, which is the sum of monitoring costs, bonding costs and residual loss. Fama and Jensen (1983) indicated corporate governance mechanisms are designed to reduce inefficiencies and eliminate agency costs.
Traditionally, institutional investors are passive owners and their growth will weaken governance and exacerbate agency problems (Bebchuk et al. 2017). However, institutional investors are active owners through proxy voting and behind-the-scenes engagement with management (Carleton et al. 1998; McCahery et al. 2016; Appel et al. 2016). Thus, institutional investors with widespread holdings may benefit firms.
Aggarwal et al. (2005) suggested that obtaining high-quality accounting information enables foreign investors to monitor and protect their investments and efficiently allocate capital. La Porta et al. (1997, 1998, 2000) indicated the necessity for strong investor protection laws and improved corporate governance mechanisms that protect and attract outside investors. Elsewhere, Leuz et al. (2003) discovered that the quality of the information available for outside investors is also high in countries with strong investor protection laws; thus, the implementation of improved corporate governance mechanisms can attract institutional investors.
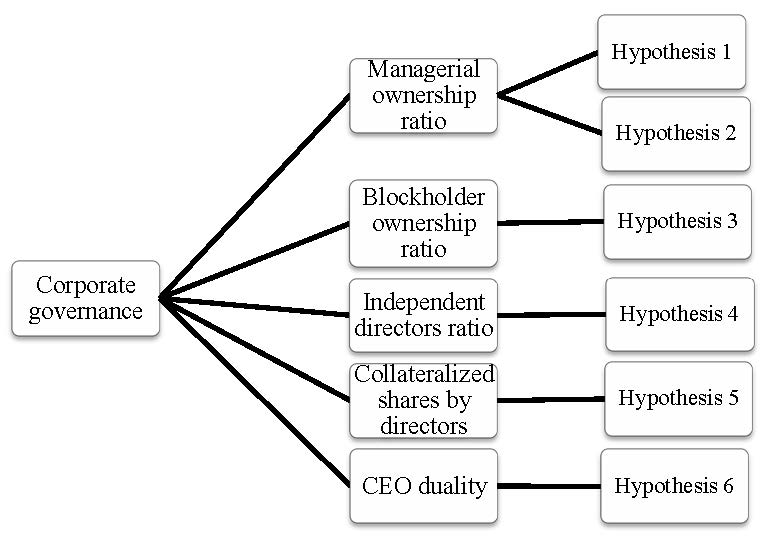
A substantial amount of research has explored the influence of corporate governance attributes on corporate performance and has suggested that corporate governance variables significantly influence firm performance. However, the relationship between corporate governance attributes and the investment preferences of institutional investors has seldom been discussed. This study contributes to the literature by analyzing the relationship between the shareholding preferences of institutional investors and corporate governance. This study establishes six hypotheses to investigate the shareholding preferences of domestic and foreign institutional investors based on corporate governance mechanisms, including managerial ownership, independent directors, blockholder ownership, pledge stock ratios and CEO duality. Then, the panel data regression model and piecewise regression model are used to determine whether these hyphotheses are supported. The empirical results reveal that corporate governance variables have dissimilar effects on the investment preferences of domestic and foreign institutional investors, such as independent director ratio and pledge stock ratio. Moreover, a nonlinear relationship exists between the shareholding preferences of institutional investors and managerial ownership.
The remainder of this paper is organized as follows: Section 2 provides empirical designs, including hypotheses and definition of variables; Section 3 describes the details of the model, Section 4 describes the data sample; Section 5 presents an analysis of the empirical results, and Section 6 presents our conclusion.
2. Empirical Design
2.1. Hypotheses Development
Jensen and Meckling (1976) argued that managers are incentivized to seek pecuniary and nonpecuniary benefits at the expense of shareholder wealth. Managers divert progressively fewer firm resources to nonvalue-maximizing activities when their equity stakes increase, because they must bear an increasing fraction of agency costs associated with their expropriation activities. Therefore, managerial ownership may affect firm performance, which affects the shareholding preferences of institutional investors. This study infers that managerial ownership has a positive relation with institutional investors’ shareholdings and establishes Hypothesis 1 as follows.
Hypothesis 1 (H1):
The larger managerial ownership ratio, the higher institutional investors’ shareholdings.
However, the correlation between managerial ownership and firm performance is inconsistent. McConnell and Servaes (1990); Keasey et al. (1994) and Chen (2006) have all reported a bell-shaped relationship between managerial ownership and firm performance. Conversely, Morck et al. (1988); Hermalin and Weisbach (1991); Mudambi and Nicosia (1998); Griffith (1999); Short and Keasey (1999); De Miguel et al. (2004); Florackis (2005) and Mura (2007) have observed a cubic relationship. Davies et al. (2005) and Florackis et al. (2009) have reported a quintic relationship. As a result, there is a nonlinear relationship between managerial ownership and institutional investors’ shareholdings and Hypothesis 2 was formulated as follows:
Hypothesis 2 (H2):
The relationship between managerial ownership ratio and institutional investors’ shareholdings is nonlinear.
The shareholding structure of a company can be divided into two categories, blockholder and nonblockholder, based on the percentage of shares owned. Because a high proportion of blockholder ownership provides an excellent opportunity for management to optimize the company value, blockholder ownership may affect the participation of institutional investors. Driffield et al. (2007) revealed that the effects of blockholder ownership on company value are significant and positive in four East Asian countries. However, several studies have suggested that high blockholder ownership may divert management action and harm minority shareholders; for example, Morck et al. (1988); Prowse (1993); Shleifer and Vishny (1997) and Vera-Minguez and Ugedo-Martin (2007) have determined that blockholder effects tend to be negatively associated with firm performance. In summary, this study inferred that the higher blockholder ownership, the higher the institutional investors’ shareholdings. Hypothesis 3 was established as follows.
Hypothesis 3 (H3):
The higher blockholder ownership ratio, the greater institutional investors’ shareholdings.
The accounting scandals occurred primarily because of financial reporting fraud, including nondisclosure and deliberate falsification. To reduce this risk and enhance the perceived integrity of financial reports, the financial reports of a corporation must be audited by an independent external auditor, who issues a report that accompanies the financial statements. A board includes internal and external directors. Fama and Jensen (1983) asserted that internal directors are likely to collude with managers and make decisions against shareholders by exploiting their superior position and the information that they can access. By contrast, external directors act as supervisors to eliminate problems because of their neutral position. Beasley (1996) demonstrated that firms with independent directors have low scandal rates. If outside directors are independent and professionally capable, they can objectively make decisions and effectively monitor managers. Weisbach (1988), Rosenstein and Wyatt (1997) and Huson et al. (2001) have all reported that if a high ratio of independent directors are hired, firm performance improves. Thus, Hypothesis 4 was formulated as follows:
Hypothesis 4 (H4):
The higher independent directors ratio, the higher institutional investors’ shareholdings.
Generally, directors can collateralize their shares and further purchase stocks to manipulate stock prices or enhance their power. Because the collateralized shares are closely related to share prices, the value of the collateralized shares depreciates when share prices slump. Consequently, shareholders who collateralize their shares may prey on small shareholders or hurt the company. Kao et al. (2004) revealed that financial distress is closely related to high share ratios pledged by directors. Yeh and Lee (2002) indicated that the higher the ratio of collateralized shares, the less favorable the firm’s performance. Additionally, Chiou et al. (2002) discovered that if the proportion of shares collateralized by a board of directors is high, the directors may be distracted from operating the business (because the fluctuation of stock prices is closely related to their finances), which leads to poor firm performance. Therefore, Hypothesis 5 was formulated as follows:
Hypothesis 5 (H5):
The higher the collateralized shares by directors, the lower institutional investor’ shareholdings.
The CEO is simultaneously the chairperson of the board, a practice that is common in the United States. From 1999 to 2003, a dual CEO leadership structure was applied in multiple firms that originally comprised nondual structures. This trend partially stemmed from several high-profile cases involving companies with dual CEO structures. However, the empirical evidence is inconsistent regarding which leadership structure is more beneficial for firm performance. For example, Fama and Jensen (1983) and Jensen (1993) have reported that CEO duality may increase the expenses of an agency because the ability of the board is hindered. Moreover, the weakening of a board’s ability to minimize the expenses of an agency can result in poor corporate performance (Jensen and Meckling 1976; Fama and Jensen 1983; Patton and Baker 1987). Daily and Dalton (1993); Pi and Timme (1993) and Dahya et al. (1996) have all similarly suggested that CEO duality negatively affects the performance of a firm. However, U.S. regulators and investors are increasingly recommending against the separation of CEO and chairperson duties. Stoeberl and Sherony (1985) have suggested that dividing CEO and chairperson of the board duties may increase information-sharing costs, which can increase the communication costs of firm-specific information, decision-making processes, and other activities that are already inefficient. Assigning blame for poor company performance may also be more difficult with two leaders than when there is only one. In the United Kingdom, Dahya et al. (2009) argued that the separation of CEO and chairperson of the board duties cannot improve firm performance. Elsewhere, Boyd (1995) and Dahya and Travlos (2000) have documented a positive association between CEO duality and firm performance. Although the specific effects remain unknown, it is clear that CEO duality influences firm performance, which affects the shareholdings of institutional investors. Accordingly, Hypothesis 6 were formulated as follows:
Hypothesis 6 (H6):
The higher CEO duality, the lower institutional investors’ shareholdings.
2.2. Variables Definitions
The shareholding preference of institutional investors (RELWEIGHT) was measured by the weight of their shareholding relative to their weight in the market. According to Zhang et al. (2009), the shareholding preference of institutional investors can be presented as:
where j = 1 and j = 2 represent domestic and foreign institutional investors, respectively; i denotes the firm; t is the sample period from January 2005 to December 2012; and is the weight of firm i in the market in period t. The expression is the ratio of institutional investors’ shareholdings for firm i in the market, and is defined by Zhang et al. (2009) as:
where is the ratio of domestic or foreign shareholding of firm i in period t, and MVit is the market value of firm i in period t.
3. Model
The data presented in this paper include time series and cross-sectional data that constitute a panel data model that refers to data sets consisting of multiple observations on each sampling unit. Panel data analysis was applied to investigate the investment preferences of domestic and foreign investors; this study also applied traditional ordinary least squares (OLS) for comparison.
Because the effects of managerial ownership on corporate performance represent a nonlinear relationship, managerial ownership and institutional investors’ shareholdings may also be in a nonlinear relationship. Therefore, this paper establishes two models. The first is constructed by assuming a linear relationship between investment preference and managerial ownership, whereas the second model is a piecewise regression model constructed by assuming that three cutting points exist in a managerial ownership ratio. The first regression model is presented as
where
RELWEIGHT: institutional investors’ shareholdings.
MANAGERi,t−1: managerial ownership ratio of firm i in period t − 1.
BLOCKi,t−1: blockholder ownership of firm i in period t − 1. This variable is measured by percentage in the top 5% by individual holding company and nonindividual nonholding company.
INDEPi,t−1: independent director ratio of firm i in period t − 1.
PLEDGEi,t−1: pledge stock ratio of firm i in period t − 1.
DUALi,t−1: a dummy variable to measure whether the CEO is the chair of the board. This variable is equal to 1 if the CEO is also the chair of the board; otherwise, it is 0.
LNTAi,t−1: the firm scale of firm i in period t − 1, which is measured by taking the natural log of total assets.
SYSTEMRISKi,t−1: the system risk of firm i in period t − 1.
EPSi,t−1: earning per share of firm i in period t − 1. This variable is measured as
EPS = (Net Income − Preferred Dividends)/Weighted Average Number of Common Shares Outstanding
Notably, Equation (3) has three control variables: LNTA, SYSTEMRISK, and EPS. LNTA is the natural log of total assets that is used to control the influence of firm scale measures on the shareholding preferences of institutional investors (Falkenstein 1996; Choe et al. 1999; Dahlquist and Robertsson 2001; Gompers and Metrick 2001; Ng and Wang 2004). EPS is the proxy of firm performance used to control the influence of firm performance measures on the shareholding preferences of institutional investors (Faccio and Lasfer 1999). Finally, SYSTEMRISK is the market risk of sample firms, used to control the influence of market risk measures on the shareholding preferences of institutional investors (Li 2002; Cao et al. 2007).
Morck et al. (1988) have demonstrated that managerial ownership is a crucial factor in regression analyses of firm performance. However, Morck et al. (1988); McConnell and Servaes (1990) and Holderness et al. (1999) have all discovered a substantial, inverse U-shaped relationship between managerial ownership and firm performance. Therefore, we considered managerial ownership to be crucial and nonmonotonical when evaluating the shareholdings of institutional investors. On the basis of Davies et al. (2005) and Zhang et al. (2009), we subsequently modified Equation (3) to a piecewise regression model as follows:
where
The definitions of other variables are defined in Equation (3).
4. Data
For the sample period from January 2005 to December 2012, this study collected 4760 samples from 18 industries selected from among Taiwan’s listed companies.1 The sample period include the 2007–2008 global financial crisis and apply the subsample period for sensitive analysis. These monthly data obtained from the Taiwan Economic Journal (TEJ). However, this study excluded several industries, such as the financial and security industries, because of the sensitive nature of their business; incomplete data were also excluded.
5. Empirical Results and Analysis
5.1. Descriptive Statistics
Table 1 presents the descriptive statistics of the institutional investors’ shareholdings, corporate variables and control variables. The mean of the managerial ownership ratio was 22.89%. However, the maximal value of the managerial ownership ratio was 89.24%, which was observed in the electronics industry. The average of the independent director ratio was 7.77%, and the maximum and minimum were 60% and 0%, respectively. The Taiwanese corporate governance law of 2006 mandated that a public limited company must have a board of directors with at least three directors and two supervisors.2 The listing regulations stipulate that a company applying for listing for the first time must have no fewer than five directors and must reserve certain positions for independent directors and supervisors.3 Because the law was enacted in 2006, several sample firms were not affected by the law and the minimum of the independent director shareholdings ratio was 0%.
The average stock pledge ratio was 12.07%, but the maximum was 98.05%, which is seven times that of the minimal value. Notably, this variable was higher during the financial crisis of 2007–2008, which numerous economists consider to be the most detrimental financial crisis since the U.S. Great Depression in the 1930s.
This study also discovered that the volatility of the electronics industry is higher than that of other industries, and that this industry had the maximal values for both the managerial ownership and stock pledge ratios4.
Table 2 displays the correlations among the studied corporate governance variables, control variables, and shareholding preferences of domestic and foreign institutional investors. Domestic and foreign institutional investors were determined to have dissimilar perspectives on system risk and independent directors. Notably, although foreign institutional investors abided by the 2006 law that requires first-time listing firms to have no fewer than five directors and to reserve certain seats for independent directors and supervisors, they did not consider independent directors capable of efficiently monitoring managers. By contrast, the domestic institutional investors recognized the function of the independent directors. Thus, the directions of correlation for the independent directors were inconsistent. The foreign institutional investors perceived system risk, whereas the domestic institutional investors did not. If the system risk was high, foreign institutional investors may have decreased their shareholdings; therefore, they most likely followed the law because they were less familiar with the market than were the domestic institutional investors.
5.2. Empirical Results Analysis
In this study, two models were used based on various managerial ownership ratio assumptions. The first regression model (Equation (1)) assumed a linear relationship between the shareholding preferences of institutional investors and the managerial ownership ratio. The second model (Equation (2)) was a piecewise regression model constructed by dividing the manager ownership at three points. The empirical results of Models 1 and 2 are presented in Table 3 and Table 4, respectively.
Based on the results of Table 3, the blockholder shareholding ratio (BLOCK) and managerial ownership ratio (MANAGER) had significant and positive effects on both the domestic and foreign institutional investors’ shareholdings. Thus, H1 and H3 are supported both for domestic and foreign institutional investors. This is consistent with the convergence of interest hypothesis (Morck et al. 1988).
However, the independent director ratio (INDEP) produced nonsignificant effects both on the domestic and foreign institutional investors (). That is, the institutional investors did not consider independent directors capable of efficiently monitoring managers. That is due to the law requiring that listed firms hire independent directors does not increase the confidence of institutional investors in increasing their shareholdings, and the independent director ratio (INDEP) had nonsignificant effects on the foreign institutional investors’ shareholdings. Therefore, H4 is not supported both for domestic and foreign institutional investors.
The stock pledge ratio (PLEDGE) has positive effect on domestic institutional investors’ shareholdings (**), but has negative effect on foreign institutional investors (). The foreign institutional investors may consider that when directors collateralize shares and engage in over-leveraged transactions, the company may has higher risk. Therefore, H5 is only supported for foreign institutional investors.
The results for CEO duality are all nonsignificant (domestic: ) That is, whether or not the separation of CEO and chairperson of the board duties cannot improve or decrease institutional investors’ shareholdings. Therefore, H6 is not supported both for domestic and foreign institutional investors.
From Table 3, the managerial ownership ratio has significant effects both on domestic and foreign institutional investors (domestic: ***; foreign: ***). The descriptive statistics table (Table 1) gave the mean of the managerial ownership ratio as 22%, thus, we divided the variable at three points, 10%, 20%, and 30%, to analyze the nonlinear relationship between the shareholdings of institutional investors and the managerial ownership ratio using the piecewise regression model. From Table 4, a nonlinear relationship was found between managerial share ownership and institutional investors’ shareholdings; the latter decreased when the managerial ownership ratios were between 20% and 30%. If the managerial ownership ratio larger than 10%, it had positive effects on institutional investors’ shareholdings (domestic: ; foreigm: ). However, when the ratio increase to 20%, the effects will turn to negative (domestic: ; foreigm: ), but the results for foreign institutional investors are nonsignificant. Consequently, H2 is only supported for domestic institutional investors.
5.3. Sensitive Analysis
5.3.1. Electronics and Nonelectronics Industry Analysis
Because half of the sampled firms are in the electronics industry, this study divided the samples into two categories, electronics and nonelectronics industries, to analyze the behavior of institutional investors.
The results of Model 1 for electronics and nonelectronics industries were shown in Table 5 and Table 6. Comparing Table 5 and Table 6, this study found that the independent director ratio (INDEP) only had a significant positive effect on the institutional investors for nonelectronics industry (domestic: ; foreign: ). This indicates that they observed the law regarding listed firms and the hiring of independent directors. Further, most Taiwanese companies are family businesses, particularly in nonelectronics industries, where director and supervisor positions are held by family members and ownership interest is concentrated in only a few shareholders. Thus, they mind the function of independent directors for nonelectronics industry. However, for electronics industry, the independent director ratio (INDEP) had nonsignificant effects both on domestic and foreign institutional investors (domestic: ; foreign: ). Consequently, H4 is only supported for nonelectronics industry.
These results imply that they focus on other factors, such as the managerial ownership ratio (MANAGER) and the blockholder ownership ratio (BLOCK). According to Table 5 and Table 6, MANAGER and BLOCK have significant positive effects both on foreign and domestic institutional investors, Thus, H1 and H3 are all supported.
The CEO duality (DUAL) positively affected the shareholdings of foreign institutional investors of nonelectronics industry (), again largely because most nonelectronics industries in Taiwan are run as family businesses. The congruence between ownership and management ensures the alignment of director/supervisor interests with those of the company, which is consistent with the convergence of the interest hypothesis. However, the DUAL and PLEDGE had negative effects on foreign institutional investors of electronics industry ( ***). Therefore, H5 and H6 are only supported for foreign institutional investors of electronics industry.
The results of Model 2 for electronics and nonelectronics industries were shown in Table 7 and Table 8. From Table 7, when the managerial ownership ratio increased, the shareholdings of both domestic and foreign institutional investors in the electronics industry increased (domestic: , ; foreign: , . Thus, there is a linear relationship exists between them. Thus, H2 were supported both for domestic and foreign institutional investors of electronics industry.
According to Table 8, for nonelectronics industry, domestic institutional investors decreased shareholdings when the managerial ownership ratio were larger than 20% ( ***, ). For foreign institutional investors, shareholdings decreased when the managerial ownership ratios were between 20% and 30% ( **, ), although the results are nonsignificant. H2 is supported only for domestic institutional investors of nonelectronics industry.
5.3.2. Subsample Period during 2007–2008
The 2007–2008 financial crisis was a crucial period that resulted in the threat of total collapse of large financial institutions, the bailout of banks by national governments and stock market downturns worldwide. Consequently, the preferences of institutional investors may have been affected. Therefore, we focused on the period immediately following the crisis (2008–2010) to empirically analyze the relationship between corporate governance and the shareholdings of institutional investors. We analyzed two cases by splitting the sample into electronics and nonelectronics industries, based on the sample period during 2007–2008. The results are shown in Table 9 and Table 10.
From Table 9, domestic and foreign institutional investors valued the monitoring function of independent directors ( ***). However, the independent director ratio (INDEP) did not improve foreign institutional investors’ investment confidence (). For other corportate governance variables, most estimated results are nonsignofcant, Consequently, H1, H3, H4, H5, and H6 are not supported.
According to Table 10, we discovered that the shareholdings of foreign institutional investors uniformly increased as the managerial ownership ratio increased, but are nonsignificant (). The managerial ownership ratio also positively affected the shareholdings of domestic institutional investors when a manager owned 20% of the equity; however, if firms owned less than 10% or more than 30%, the shareholdings of the foreign institutional investors declined (). But these estimated results are all not significant. Thus, H2 is not supported.
Most corporate governance variables had no significant effect on domestic or foreign institutional investors’ shareholdings. These corporate governance variables did not improve institutional investors’ shareholdings during the financial crisis period. By contrast, institutional investors paid attention to firms’ profit or characteristics, such as the earnings per share (EPS) or firm scale (LNTA). This indicates that there is considerable room for improvement in Taiwan’s corporate governance system. It is crucial that the government enhance corporate governance mechanisms to improve institutional investors’ confidence during financial crises. Finally, the summarization with respect to six hypotheses is shown in Table 11.
6. Conclusions
In Taiwan, corporate governance became essential after the 1997 Asian financial crisis. Furthermore, interest in the corporate governance practices of modern corporations has been renewed, particularly in relation to accountability, because of the high-profile collapses of numerous corporations during 2001–2002, most of which involved accounting fraud.
Since the institutional investors are important traders in Taiwan market, their preferences will affect investment strategies of other traders. This study investigated the correlation between preferences of institutional investors and corporate governance in Taiwan. This study applied the panel data regression model and piecewise regression model to determine whether hypotheses are supported.
Empirical results showed that the domestic and foreign institutional investors had dissimilar perspectives on corporate governance variables, such as collateralized shares by directors and CEO duality. The blockholder ownership ratio and managerial ownership ratio positively affected the institutional investors’ shareholdings. Because most firms of nonelectronics in Taiwan are family businesses, foreign institutional investors pay particular attention to CEO duality. However, these corporate governance variables have not improved institutional investors’ shareholdings during financial crisis periods; instead, institutional investors paid more attention to firm profits or characteristics than to corporate governance variables. Therefore, we conclude that the Taiwanese government should establish better corporate governance to improve institutional investors’ confidence.
The sample data of this paper are obtained from Taiwan market, which is the emerging market. However, for Taiwan, many regulations of corporate governance have to improve. Further, there are many emerging markets in Asia, such as the Indian and Chinese markets. Thus, for further research, the methodology and issues can be employed to analyze and compare effects of corporate governance on institutional investors’ preferences among other emerging markets.
Author Contributions
S.-L.L. was the author behind the main idea and objectives of the paper. Y.-H.L. collected and analyzed the data. S.-L.L. and Y.-H.L. drafted the manuscript. S.-L.L. completed further econometric estimations and revised the paper.
Funding
This research received no external funding.
Acknowledgments
We are grateful to the three anonymous referees for their helpful comments and suggestions.
Conflicts of Interest
The authors declare no conflict of interest.
References
- Aggarwal, Reena, Leora Klapper, and Peter Wysocki. 2005. Portfolio Preferences of Foreign Institutional Investors. Journal of Banking and Finance 29: 2919–46. [Google Scholar] [CrossRef]
- Appel, Ian, Todd Gormley, and Donald Keim. 2016. Passive investors, not passive owners. Journal of Financial Economics 121: 111–41. [Google Scholar] [CrossRef]
- Beasley, Mark. 1996. An Empirical Analysis of the Relation between the Board of Director Composition and Financial Statement Fraud. The Accounting Review 71: 443–65. [Google Scholar]
- Bebchuk, Lucian, Alma Cohen, and Scott Hirst. 2017. The Agency Problems of Institutional Investors. Discussion Paper. Cambridge: Harvard Law School. [Google Scholar]
- Boyd, Brian. 1995. CEO duality and firm performance: A contingency model. Strategic Management Journal 16: 301–12. [Google Scholar] [CrossRef]
- Cadbury, Adrian. 1992. The Financial Aspects of Corporate Governance (Cadbury Report). London: The Committee on the Financial Aspect of Corporate Governance (The Cadbury Committee) and Gee and Co., Ltd. [Google Scholar]
- Carleton, Willard, James Nelson, and Michael Weisbach. 1998. The influence of institutions on corporate governance through private negotiations: Evidence from TIAA-CREF. Journal of Finance 53: 1335–1362. [Google Scholar] [CrossRef]
- Cao, Tingqui, Xiuli Yang, and Yuguang Sun. 2007. Ownership structure and corporate performance: Measurement method and endogeneity. Economic Research Journal 10: 126–37. [Google Scholar]
- Chen, Ming-Yuan. 2006. Managerial ownership and firm performance: An analysis using switching simultaneous-equation models. Applied Economics 38: 161–81. [Google Scholar] [CrossRef]
- Chiou, Jeng-Ren, Ta-Chung Hsiung, and Lanfeng Kao. 2002. A Study of the Relationship between Financial Distress and Collateralized Shares. Taiwan Accounting Review 3: 79–111. [Google Scholar]
- Choe, Hyuk, Bong-Chan Kho, and René M. Stluz. 1999. Do Foreign Investors Destabilize Stock Market? The Korean Experience in 1997. Journal of Financial Economics 54: 227–64. [Google Scholar] [CrossRef]
- Dahya, Jay, Laura Galguera Garcia, and Jos van Bommel. 2009. One Man Two Hats: What’s All Commotion! Financial Review 44: 179–212. [Google Scholar] [CrossRef]
- Daily, Catherine, and Dane Dalton. 1993. Boards of directors, leadership and structure: Control and performance implications. Entrepreneurship Theory and Practice 17: 65–81. [Google Scholar] [CrossRef]
- Dahlquist, Magus, and Gorän Robertsson. 2001. Direct Foreign Ownership, Institutional Investors, and Firm Characteristics. Journal of Financial Economics 59: 413–440. [Google Scholar] [CrossRef]
- Davies, J.R., David Hillier, and Patrick McColgan. 2005. Ownership structure, managerial behavior and corporate value. Journal of Corporate Finance 11: 645–60. [Google Scholar] [CrossRef]
- De Miguel, Alberto, Julio Pindado, and Chabela de la Torre. 2004. Ownership structure and firm value: New evidence from Spain. Strategic Management Journal 25: 1199–207. [Google Scholar] [CrossRef]
- Driffield, Nigel, Vidya Mahambare, and Sarmistha Pal. 2007. How does ownership structure affect capital structure and firm value? Recent evidence from East Asia. Economics of Transition 15: 535–73. [Google Scholar] [CrossRef]
- Dahya, Jay, Alasdair Lonie, and David Power. 1996. The case for separating the roles of chairman and CEO: An anaylsis of stockmarket and accounting data. Corporate Governance: An International Review 4: 71–77. [Google Scholar] [CrossRef]
- Dahya, Jay, and Nickolaos Travlos. 2000. Does the one man show pay? Theory and evidence on the dual CEO revisited. European Financial Management 16: 85–98. [Google Scholar] [CrossRef]
- Faccio, Mara, and Meziane Lasfer. 1999. Managerial Ownership, Board Structure and Firm Value: The UK Evidence, Working Paper. Available online: https://papers.ssrn.com/sol3/papers.cfm?abstract_id=179008 (accessed on 31 December 2018).
- Fama, Eugene, and Michael Jensen. 1983. Separation of Ownership and Control. Journal of Law and Economics 26: 301–25. [Google Scholar] [CrossRef]
- Falkenstein, Eric. 1996. Preference for Stock Characteristics as Revealed by Mutual Fund Portfolio Holdings. Journal of Finance 51: 111–35. [Google Scholar] [CrossRef]
- Florackis, Chrisostomos. 2005. Internal corporate governance mechanisms and corporate performance: Evidence for UK firms. Applied Financial Economics Letters 1: 211–16. [Google Scholar] [CrossRef]
- Florackis, Chrisostomos, Alexandros Kostakis, and Aydin Ozkan. 2009. Managerial ownership and performance. Journal of Business Research 62: 1350–57. [Google Scholar] [CrossRef]
- Gompers, Paul, and Andrew Metrick. 2001. Institutional Investors and Equity Prices. Quarterly Journal of Economics 116: 229–59. [Google Scholar] [CrossRef]
- Griffith, John. 1999. CEO ownership and firm value. Managerial and Decision Economics 20: 1–8. [Google Scholar] [CrossRef]
- Hermalin, Benjamin, and Michael Weisbach. 1991. The effects of board composition and direct incentives on firm performance. Financial Management 20: 101–12. [Google Scholar] [CrossRef]
- Holderness, Clifford, Randall Kroszner, and Dennis Sheehan. 1999. Were the good old days that good? Changes in managerial stock ownership since the Great Depression. Journal of Finance 54: 435–470. [Google Scholar] [CrossRef]
- Huson, Mark, Robert Parrino, and Laura Starks. 2001. Internal Monitoring Mechanisms and CEO Turnover: A Long-Term Perspective. Journal of Finance 56: 2265–97. [Google Scholar] [CrossRef]
- Jensen, Michael, and Willian Meckling. 1976. Theory of the Firm: Managerial Behavior, Agency Cost and Ownership Structure. Journal of Financial Economics 3: 305–60. [Google Scholar] [CrossRef]
- Jensen, Michael. 1993. The Modern Industrial Revolution, Exit, and the Failure of Internal Control Systems. Journal of Finance 48: 831–80. [Google Scholar] [CrossRef]
- Kao, Lanfeng, Jeng-Ren Chiou, and Anlin Chen. 2004. The Agency Problem, Firm Performance and Monitoring Mechanisms: The Evidence from Collateralized Shares in Taiwan. Corporate Governance: An International Review 12: 389–402. [Google Scholar] [CrossRef]
- Keasey, Kevin, Helen Short, and Robert Watson. 1994. Directors’ ownership and the performance of small and medium sized firms in the UK. Small Business Economics 6: 225–36. [Google Scholar] [CrossRef]
- La Porta, Rafael, Florencio Lopez-de-Silanes, Andrei Shleifer, and Robert Vishny. 1997. Legal determinants of external finance. Journal of Finance 52: 1131–50. [Google Scholar] [CrossRef]
- La Porta, Rafel, Florencio Lopez-de-Silanes, Andrei Shleifer, and Robert Vishny. 1998. Law and finance. Journal of Political Economy 106: 1115–55. [Google Scholar] [CrossRef]
- La Porta, Rafel, Florencio Lopez-de-Silanes, Andrei Shleifer, and Robert Vishny. 2000. Investor protection and corporate governance. Journal of Financial Economics 58: 3–27. [Google Scholar] [CrossRef] [Green Version]
- Leuz, Christian, Dhananjay Nanda, and Peter Wysocki. 2003. Investor protection and earnings management: An international comparison. Journal of Financial Economics 69: 505–27. [Google Scholar] [CrossRef]
- Li, Lingfeng. 2002. Macroeconomic Factors and the Correlation of Stock and Bond Returns. International Center for Finance Yale University Working paper, November, No. 02-46. Available online: http://www.scielo.org.co/scielo.php?script=sci_nlinks&ref=000129&pid=S0121-5051201100010001200033&lng=en (accessed on 31 December 2018).
- McConnell, John, and Henri Servaes. 1990. Additional evidence on equity ownership and corporate value. Journal of Financial Economics 27: 595–612. [Google Scholar] [CrossRef]
- McCahery, Joseph, Zacharias Sautner, and Laura T. Starks. 2016. Behind the scenes: The corporate governance preferences of institutional investors. Journal of Finance 71: 2905–32. [Google Scholar] [CrossRef]
- Morck, Randall, Andrei Shleifer, and Robert Vishny. 1988. Management Ownership and Market Evaluation: An Empirical Analysis. Journal of Financial Economics 20: 293–315. [Google Scholar] [CrossRef]
- Mudambi, Ram, and Carmeia Nicosia. 1998. Ownership structure and firm performance: Evidence from the UK financial service industry. Applied Financial Economics 8: 175–80. [Google Scholar] [CrossRef]
- Mura, Roberto. 2007. Firm performance: Do non-executive directors have a mind of their own? Evidence from UK panel data. Financial Management 36: 81–112. [Google Scholar] [CrossRef]
- Ng, Lilian, and Qinghai Wang. 2004. Institutional trading and the turn-of-the -year effect. Journal of Financial Economics 74: 343–66. [Google Scholar] [CrossRef]
- Patton, Arch, and John Baker. 1987. Why won’t directors rock the board? Harvard Business Review 65: 10–18. [Google Scholar]
- Pi, Lynn, and Stephen Timme. 1993. Corporate control and bank efficiency. Journal of Banking and Finance 17: 515–30. [Google Scholar] [CrossRef]
- Prowse, Stephen. 1993. The structure of corporate ownership in Japan. The Journal of Finance 47: 1121–40. [Google Scholar] [CrossRef]
- Rosenstein, Stuart, and Jeffrey Wyatt. 1997. Inside Directors, Board Effectiveness, and Shareholder Wealth. Journal of Financial Economics 44: 229–50. [Google Scholar] [CrossRef]
- Shan, Neeta, and Christopher Napier. 2014. The Cadbury Report 1992: Shared Vision and Beyond; Essay. Egham: Royal Holloway University of London. Available online: http://wwwdata.unibg.it/dati/corsi/900002/79548-Beyond%20Cadbury%20Report%20Napier%20paper.pdf (accessed on 31 December 2018).
- Shleifer, Andrei, and Robert Vishny. 1997. A survey of corporate. The Journal of Finance 52: 737–38. [Google Scholar] [CrossRef]
- Short, Helen, and Kevin Keasey. 1999. Managerial ownership and the performance of firms: Evidence from the UK. Journal of Corporate Finance 5: 79–101. [Google Scholar] [CrossRef]
- Stoeberl, Phillip, and Bruce C. Sherony. 1985. Board Efficiency and Effectiveness. In Handbook for Corporate Directors. Edited by Edward Mattar and Michael Ball. New York: McGraw-Hill, pp. 12.1–12.10. [Google Scholar]
- Minguez-Vera, Antonio, and Juan Francisco Martin-Ugedo. 2007. Does ownership structure affect value? A panel data analysis for the Spanish market. International Review of Financial Analysis 16: 81–98. [Google Scholar] [CrossRef]
- Weisbach, Michael. 1988. Outside Directors and CEO Turnover. Journal of Financial Economics 20: 431–60. [Google Scholar] [CrossRef]
- Yeh, Yin-Hua, and Tsun-Siou Lee. 2002. Corporate Governance and Corporate Equity Investments: Evidence from Taiwan. Paper presented at 9th Global Finance Conference, Beijing, China, May 27–29. [Google Scholar]
- Zhang, Yu-Ren, Tay-Chang Wang, and Chung-Fern Wu. 2009. Evidence on the association between mechanisms of corporate governance and the portfolio held by foreign investors. Journal of Management & Systems 16: 505–32. [Google Scholar]
| 1 | According to regulatory framework of corporate governance, which is shown by corporate governance center of Taiwan Stock Exchange, the Taiwan Stock Exchange (TWSE) and Taipei Exchange (TPEx) specified their criteria for the review of securities listings in 2002. “An IPO company must set up an independent director and meet certain qualifications. Furthermore, regulations, such as ‘Corporate Governance Best Practice Principles’, ‘Code of Practice for Corporate Social Responsibility’, and ‘Code of Practice for Integrity Management’ were subsequently announced for domestic enterprises to follow. These will guide enterprises in strengthening their sense of corporate governance and social responsibility, establishing a consensus on integrity management, constructing a corporate governance culture, and creating mutual values.” (http://cgc.twse.com.tw/). |
| 2 | Company Act, 2006, Chapter V, Section 4. |
| 3 | Taiwan Securities and Exchange Act, 2006, Article 26-3. |
| 4 | For saving the space, the data regarding CEO duality are not shown. If readers need the data of CEO duality, contact with authors please. |

Table 1.
Descriptive statistics.
| Variable | Mean | Median | Standard Deviation | Minimum | Maximum | |
|---|---|---|---|---|---|---|
| RELWEIGHT | Domestic | −0.069 | −0.186 | 0.607 | −1.000 | 2.667 |
| Foreign | −0.440 | −0.620 | 0.563 | −1.000 | 2.667 | |
| MANAGER (%) | 22.892 | 19.940 | 13.597 | 0.000 | 89.240 | |
| BLOCK (%) | 19.565 | 17.600 | 11.849 | 0.000 | 69.66 | |
| INDEP (%) | 7.765 | 0.000 | 13.865 | 0.000 | 60.000 | |
| PLEDGE (%) | 12.696 | 0.000 | 20.245 | 0.000 | 98.050 | |
| LNTA (thousand dollar) | 15.995 | 15.814 | 1.411 | 11.119 | 21.438 | |
| SYSTEMRISK (%) | 0.877 | 0.915 | 0.485 | −5.274 | 10.248 | |
| EPS (dollar) | 1.831 | 1.275 | 3.725 | −52.320 | 73.320 | |
| DUAL | -- | -- | -- | 0.000 | 1.000 | |
Note: RELWEIGHT is the preference of institutional investors’ shareholding, including domestic and foreign. MANAGER is the managerial ownership ratio. BLOCK is the blockholder ownership ratio. INDEP is the independent director ratio. PLEDGE is the stock pledge ratio. LNTA is firm scale. SYSTEMRISK is the system risk. EPS is the earning per share. DUAL is the CEO duality. DUAL is dummy variable and this variable is equal to 1 if the CEO is also the chair of the board; otherwise, it is 0.
Table 2.
Correlation for variables of institutional investors.
| Variable | RELWEIGHT | MANAGER | BLOCK | INDEP | PLEDGE | DUAL | LNTA | SYSTEMRISK | EPS | |
|---|---|---|---|---|---|---|---|---|---|---|
| Domestic | Foreign | |||||||||
| RELWEIGHT | 1.000 | 1.000 | ||||||||
| MANAGER | 0.389 (0.000) *** | 0.134 (0.000) *** | 1.000 | |||||||
| BLOCK | 0.182 (0.000) *** | 0.292 (0.000) *** | −0.089 (0.000) *** | 1.000 | ||||||
| INDEP | 0.072 (0.000) *** | −0.261 (0.000) *** | −0.080 (0.000) *** | −0.128 (0.000) *** | 1.000 | |||||
| PLEDGE | 0.034 (0.019) ** | 0.088 (0.000) *** | −0.090 (0.000) *** | 0.031 (0.033) ** | −0.130 (0.000) *** | 1.000 | ||||
| DUAL | −0.137 (0.000) *** | −0.145 (0.000) *** | −0.102 (0.000) *** | −0.002 (0.879) | 0.010 (0.482) | −0.043 (0.003) *** | 1.000 | |||
| LNTA | 0.130 (0.000) *** | 0.327 (0.000) *** | −0.097 (0.000) *** | −0.037 (0.010) ** | 0.018 (0.221) | 0.098 (0.000) *** | −0.112 (0.000) *** | 1.000 | ||
| SYSTEMRISK | 0.015 (0.315) | −0.033 (0.022) ** | −0.139 (0.000) *** | −0.156 (0.000) *** | 0.120 (0.000) *** | −0.063 (0.000) *** | 0.002 (0.905) | 0.247 (0.000) *** | 1.000 | |
| EPS | 0.139 (0.000) *** | 0.148 (0.000) *** | 0.025 (0.088) * | 0.012 (0.407) | 0.139 (0.000) *** | −0.089 (0.000) *** | −0.054 (0.000) *** | 0.245 (0.000) *** | 0.088 (0.000) *** | 1.000 |
Note: RELWEIGHT is the preference of institutional investors’ shareholding, including domestic and foreign. MANAGER is the managerial ownership ratio. BLOCK is the blockholder ownership ratio. INDEP is the independent director ratio. PLEDGE is the stock pledge ratio. DUAL is the CEO duality. LNTA is firm scale. SYSTEMRISK is the system risk. EPS is the earning per share. The number in parentheses is the p-value. *, ** and *** are denoted significant at 10%, 5% and 1% level, respectively.
Table 3.
Shareholding reference of institutional investors for Model 1 (n = 4760).
| Variable | Domestic | Foreign | |
|---|---|---|---|
| Constant | Domestic | 1.151 (0.000) *** | --- |
| Foreign | --- | −1.186 (0.000) *** | |
| MANAGER | 0.006 (0.000) *** | 0.003 (0.000) *** | |
| BLOCK | 0.005 (0.000) *** | 0.002 (0.000) *** | |
| INDEP | 0.001 (0.171) | 0.000 (0.831) | |
| PLEDGE | 0.001 (0.048) ** | −0.001 (0.002) *** | |
| DUAL | 0.019 (0.209) | 0.005 (0.666) | |
| LNTA | −0.091 (0.000) *** | 0.040 (0.001) | |
| SYSTEMRISK | −0.025 (0.005) *** | −0.017 (0.015) ** | |
| EPS | 0.013 (0.000) *** | 0.008 (0.000) | |
| Adjusted R-squared | 0.868 | 0.901 | |
| F-statistic | 46.650 (0.000) *** | 63.859 (0.000) *** | |
| Hausman Test | 162.502 (0.000) *** | 181.155 (0.000) *** | |
| Fixed/random effect | Fixed | Fixed | |
Note: RELWEIGHT is the preference of institutional investors’ shareholding, including domestic and foreign. MANAGER is the managerial ownership ratio. BLOCK is the blockholder ownership ratio. INDEP is the independent director ratio. PLEDGE is the stock pledge ratio. DUAL is the CEO duality. LNTA is firm scale. SYSTEMRISK is the system risk. EPS is the earning per share. The number in parentheses is the p-value. *, ** and *** are denoted significant at 10%, 5% and 1% level, respectively. n is sample number of observations.
Table 4.
Shareholding reference of institutional investors for Model 2 (n = 4760).
| Variable | Domestic | Foreign | |
|---|---|---|---|
| Constant | Domestic | 1.178 (0.000) *** | --- |
| Foreign | --- | −1.102 (0.000) *** | |
| MANAGER | −0.008 (0.075) * | −0.006 (0.099) * | |
| (MANAGER − 10%) a1 | 0.021 (0.000) *** | 0.009 (0.042) ** | |
| :(MANAGER − 20%) a2 | −0.011 (0.006) *** | −0.001 (0.648) | |
| :(MANAGER − 30%) a3 | 0.005 (0.133) | 0.004 (0.133) | |
| BLOCK | 0.005 (0.000) *** | 0.002 (0.000) *** | |
| INDEP | 0.001 (0.177) | 0.000 (0.788) | |
| PLEDGE | 0.001 (0.051) * | −0.001 (0.002) *** | |
| DUAL | 0.020 (0.186) | 0.005 (0.679) | |
| LNTA | −0.088 (0.000) *** | 0.039 (0.001) *** | |
| SYSTEMRISK | −0.024 (0.006) *** | −0.017 (0.016) ** | |
| EPS | 0.012 (0.000) *** | 0.007 (0.000) *** | |
| Adjusted R-squared | 0.869 | 0.901 | |
| F-statistic | 46.585 (0.000) *** | 63.731 (0.000) *** | |
| Hausman Test | 156.379 (0.000) *** | 182.674 (0.000) *** | |
| Fixed/random effect | Fixed | Fixed | |
Note: RELWEIGHT is the preference of institutional investors’ shareholding, including domestic and foreign. MANAGER is the managerial ownership ratio. BLOCK is the blockholder ownership ratio. INDEP is the independent director ratio. PLEDGE is the stock pledge ratio. DUAL is the CEO duality. LNTA is firm scale. SYSTEMRISK is the system risk. EPS is the earning per share. The number in parentheses is the p-value. *, ** and *** are denoted significant at 10%, 5% and 1% level, respectively. n is sample number of observations.
Table 5.
Institutional investors’ shareholding reference of electronics industry for Model 1 (n = 2256).
Table 5.
Institutional investors’ shareholding reference of electronics industry for Model 1 (n = 2256).
| Variable | Domestic | Foreign | |
|---|---|---|---|
| Constant | Domestic | 2.090 (0.000) *** | --- |
| Foreign | --- | −2.253 (0.000) *** | |
| MANAGER | 0.007 (0.000) *** | 0.003 (0.000) *** | |
| BLOCK | 0.007 (0.000) *** | 0.002 (0.000) *** | |
| INDEP | 0.001 (0.268) | 0.000 (0.722) | |
| PLEDGE | 0.002 (0.008) *** | −0.002 (0.000) *** | |
| DUAL | 0.037 (0.119) | −0.039 (0.001) *** | |
| LNTA | −0.154 (0.000) *** | 0.090 (0.000) *** | |
| SYSTEMRISK | −0.011 (0.408) | −0.004 (0.521) | |
| EPS | 0.013 (0.000) *** | 0.004 (0.003) *** | |
| Adjusted R-squared | 0.859 | 0.870 | |
| F-statistic | 42.637 (0.000) *** | 46.635 (0.000) *** | |
| Hausman Test | 135.240 (0.000) *** | 88.666 (0.000) *** | |
| Fixed/random effect | Fixed | Fixed | |
Note: RELWEIGHT is the preference of institutional investors’ shareholding, including domestic and foreign. MANAGER is the managerial ownership ratio. BLOCK is the blockholder ownership ratio. INDEP is the independent director ratio. PLEDGE is the stock pledge ratio. DUAL is the CEO duality. LNTA is firm scale. SYSTEMRISK is the system risk. EPS is the earning per share. The number in parentheses is the p-value. *, ** and *** are denoted significant at 10%, 5% and 1% level, respectively. n is sample number of observations.
Table 6.
Institutional investors’ shareholding reference of nonelectronics industry for Model 1 (n = 2504).
Table 6.
Institutional investors’ shareholding reference of nonelectronics industry for Model 1 (n = 2504).
| Variable | Domestic | Foreign | |
|---|---|---|---|
| Constant | Domestic | −0.310 (0.316) | --- |
| Foreign | --- | 0.073 (0.827) | |
| MANAGER | 0.005 (0.000) *** | 0.004 (0.000) *** | |
| BLOCK | 0.003 (0.000) *** | 0.002 (0.004) *** | |
| INDEP | 0.095 (0.080) ** | 0.173 (0.003) *** | |
| PLEDGE | 0.000 (0.995) | 0.000 (0.377) | |
| DUAL | 0.007 (0.692) | 0.051 (0.011) ** | |
| LNTA | 0.004 (0.843) | −0.026 (0.216) | |
| SYSTEMRISK | −0.050 (0.000) *** | −0.031 (0.018) ** | |
| EPS | 0.010 (0.000) *** | 0.014 (0.000) *** | |
| Adjusted R-squared | 0.883 | 0.872 | |
| F-statistic | 52.578 (0.000) *** | 47.573 (0.000) *** | |
| Hausman Test | 52.926 (0.000) *** | 80.673 (0.000) ** | |
| Fixed/random effect | Fixed | Fixed | |
Note: RELWEIGHT is the preference of institutional investors’ shareholding, including domestic and foreign. MANAGER is the managerial ownership ratio. BLOCK is the blockholder ownership ratio. INDEP is the independent director ratio. PLEDGE is the stock pledge ratio. DUAL is the CEO duality. LNTA is firm scale. SYSTEMRISK is the system risk. EPS is the earning per share. The number in parentheses is the p-value. *, ** and *** are denoted significant at 10%, 5% and 1% level, respectively. n is sample number of observations.
Table 7.
Institutional investors’ shareholding reference of electronics industry for Model 2 (n = 2256).
Table 7.
Institutional investors’ shareholding reference of electronics industry for Model 2 (n = 2256).
| Variable | Domestic | Foreign | |
|---|---|---|---|
| Constant | Domestic | 1982.901 (0.000) *** | --- |
| Foreign | --- | −2.150 (0.000) *** | |
| MANAGER | −0.214 (0.246) | 0.002 (0.806) | |
| :(MANAGER − 10%) a1 | −0.453 (0.000) *** | −0.002 (0.815) | |
| :(MANAGER − 20%) a2 | 0.331 (0.003) *** | 0.002 (0.570) | |
| :(MANAGER − 30%) a3 | 0.132 (0.008) *** | 0.005 (0.046) ** | |
| BLOCK | −0.019 (0.630) | 0.003 (0.000) *** | |
| INDEP | 0.058 (0.000) *** | 0.000 (0.582) | |
| PLEDGE | −0.043 (0.000) *** | −0.001 (0.000) *** | |
| DUAL | 0.005 (0.262) | −0.041 (0.001) *** | |
| LNTA | −0.091 (0.627) | 0.085 (0.000) *** | |
| SYSTEMRISK | 1.941 (0.000) *** | −0.004 (0.505) | |
| EPS | −0.003 (0.010) ** | 0.004 (0.003) *** | |
| Adjusted R-squared | 0.033 | 0.871 | |
| F-statistic | 1.230 (0.008) *** | 46.484 (0.000) *** | |
| Hausman Test | 297.266 (0.000) *** | 101.735 (0.000) *** | |
| Fixed/random effect | Fixed | Fixed | |
Note: RELWEIGHT is the preference of institutional investors’ shareholding, including domestic and foreign. MANAGER is the managerial ownership ratio. BLOCK is the blockholder ownership ratio. INDEP is the independent director ratio. PLEDGE is the stock pledge ratio. DUAL is the CEO duality. LNTA is firm scale. SYSTEMRISK is the system risk. EPS is the earning per share. The number in parentheses is the p-value. *, ** and *** are denoted significant at 10%, 5% and 1% level, respectively. n is sample number of observations.
Table 8.
Institutional investors’ shareholding reference of nonelectronics industry for Model 2 (n = 2504).
Table 8.
Institutional investors’ shareholding reference of nonelectronics industry for Model 2 (n = 2504).
| Variable | Domestic | Foreign | |
|---|---|---|---|
| Constant | Domestic | −0.189 (0.563) | --- |
| Foreign | --- | 0.166 (0.622) | |
| MANAGER | −0.009 (0.042) ** | −0.006 (0.205) | |
| :(MANAGER − 10%) a1 | 0.024 (0.001) *** | 0.015 (0.039) ** | |
| :(MANAGER − 20%) a2 | −0.010 (0.067) ** | −0.006 (0.293) | |
| :(MANAGER − 30%) a3 | −0.002 (0.514) | 0.003 (0.472) | |
| BLOCK | 0.003 (0.000) *** | 0.003 (0.001) *** | |
| INDEP | 0.065 (0.273) | 0.137 (0.026) ** | |
| PLEDGE | 0.000 (0.772) | 0.000 (0.334) | |
| DUAL | −0.008 (0.693) | 0.050 (0.013) ** | |
| LNTA | 0.000 (0.993) | −0.028 (0.189) | |
| SYSTEMRISK | −0.046 (0.000) *** | −0.030 (0.021) ** | |
| EPS | 0.008 (0.006) *** | 0.014 (0.000) *** | |
| Adjusted R-squared | 0.880 | 0.872 | |
| F-statistic | 54.470 (0.000) *** | 47.200 (0.000) *** | |
| Hausman Test | 43.724 (0.000) *** | 81.005 (0.000) *** | |
| Fixed/random effect | Fixed | Fixed | |
Note: RELWEIGHT is the preference of institutional investors’ shareholding, including domestic and foreign. MANAGER is the managerial ownership ratio. BLOCK is the blockholder ownership ratio. INDEP is the independent director ratio. PLEDGE is the stock pledge ratio. DUAL is the CEO duality. LNTA is firm scale. SYSTEMRISK is the system risk. EPS is the earning per share. The number in parentheses is the p-value. *, ** and *** are denoted significant at 10%, 5% and 1% level, respectively. n is sample number of observations.
Table 9.
Institutional investors’ shareholding reference during financial tsunami for Model 1 (n = 1785).
Table 9.
Institutional investors’ shareholding reference during financial tsunami for Model 1 (n = 1785).
| Variable | Domestic | Foreign | |
|---|---|---|---|
| Constant | Domestic | −1.974 (0.022)** | -- |
| Foreign | --- | −0.428 (0.064) * | |
| MANAGER | 0.004 (0.132) | −0.001 (0.378) | |
| BLOCK | 0.000 (0.967) | 0.000 (0.698) | |
| INDEP | −0.005 (0.003) *** | 0.000 (0.654) | |
| PLEDGE | 0.000 (0.597) | −0.001 (0.131) | |
| DUAL | 0.018 (0.631) | −0.032 (0.235) | |
| LNTA | 0.116 (0.031) ** | −0.013 (0.330) | |
| SYSTEMRISK | 0.002 (0.857) | −0.019 (0.193) | |
| EPS | 0.007 (0.140) | 0.007 (0.003) *** | |
| Adjusted R-squared | 0.932 | 0.824 | |
| F-statistic | 28.077 (0.000) *** | 10.268 (0.000) *** | |
| Hausman Test | 87.049 | 133.939 | |
| Fixed/random effect | Fixed | Fixed | |
Note: RELWEIGHT is the preference of institutional investors’ shareholding, including domestic and foreign. MANAGER is the managerial ownership ratio. BLOCK is the blockholder ownership ratio. INDEP is the independent director ratio. PLEDGE is the stock pledge ratio. DUAL is the CEO duality. LNTA is firm scale. SYSTEMRISK is the system risk. EPS is the earning per share. The number in parentheses is the p-value. *, ** and *** are denoted significant at 10%, 5% and 1% level, respectively. n is sample number of observations.
Table 10.
Institutional investors’ shareholding reference during financial tsunami for Model 2 (n = 1785).
Table 10.
Institutional investors’ shareholding reference during financial tsunami for Model 2 (n = 1785).
| Variable | Domestic | Foreign | |
|---|---|---|---|
| Constant | Domestic | −2.145 (0.017) ** | --- |
| Foreign | --- | −2.397 (0.000) *** | |
| MANAGER | 0.015 (0.380) | 0.005 (0.688) | |
| :(MANAGER − 10%) a1 | −0.012 (0.545) | −0.003 (0.829) | |
| :(MANAGER − 20%) a2 | 0.002 (0.843) | 0.001 (0.904) | |
| :(MANAGER − 30%) a3 | −0.003 (0.760) | 0.001 (0.885) | |
| BLOCK | 0.000 (0.965) | 0.003 (0.072) * | |
| INDEP | −0.005 (0.003) *** | 0.000 (0.706) | |
| PLEDGE | 0.001 (0.542) | 0.000 (0.802) | |
| DUAL | 0.018 (0.647) | 0.001 (0.971) | |
| LNTA | 0.120 (0.027) ** | 0.113 (0.002) *** | |
| SYSTEMRISK | 0.003 (0.843) | 0.006 (0.550) | |
| EPS | 0.006 (0.163) | 0.000 (0.973) | |
| Adjusted R-squared | 0.932 | 0.960 | |
| F-statistic | 27.822 (0.000) *** | 48.702 (0.000) *** | |
| Hausman Test | 85.930 (0.000) *** | 93.116 (0.000) *** | |
| Fixed/random effect | Fixed | Fixed | |
Note: RELWEIGHT is the preference of institutional investors’ shareholding, including domestic and foreign. MANAGER is the managerial ownership ratio. BLOCK is the blockholder ownership ratio. INDEP is the independent director ratio. PLEDGE is the stock pledge ratio. DUAL is the CEO duality. LNTA is firm scale. SYSTEMRISK is the system risk. EPS is the earning per share. The number in parentheses is the p-value. *, ** and *** are denoted significant at 10%, 5% and 1% level, respectively. n is sample number of observations.
Table 11.
Summarization of hypotheses.
| Full Sample | Electronics | Nonelectronics | Financial Tsunami | |||||
|---|---|---|---|---|---|---|---|---|
| Domestic | Foreign | Domestic | Foreign | Domestic | Foreign | Domestic | Foreign | |
| H1 | yes | yes | yes | yes | yes | yes | no | no |
| H2 | yes | no | yes | yes | yes | no | no | no |
| H3 | yes | yes | yes | yes | yes | yes | no | no |
| H4 | no | no | no | no | yes | yes | no | no |
| H5 | no | yes | no | yes | no | no | no | no |
| H6 | no | no | no | yes | no | no | no | no |
Note: Hypothesis 1 (H1): The larger ownership ratio, the higher institutional investors’ shareholdings. Hypothesis 2 (H2): The relationship between managerial ownership ratio and institutional investors’ shareholdings is nonlinear. Hypothesis 3 (H3): The higher blockholder ownership ratio, the greater the institutional investors’ shareholdings. Hypothesis 4 (H4): The higher independent directors ratio, the higher institutional investors’ shareholdings. Hypothesis 5 (H5): The higher the collateralized shares by directors, the lower institutional investor’ shareholdings. Hypothesis 6 (H6): The higher CEO duality, the lower institutional investors’ shareholdings. “No” represents the hypothesis is not supported. “Yes” represents the hypothesis is supported.
© 2019 by the authors. Licensee MDPI, Basel, Switzerland. This article is an open access article distributed under the terms and conditions of the Creative Commons Attribution (CC BY) license (http://creativecommons.org/licenses/by/4.0/).
Share and Cite
MDPI and ACS Style
Lu, S.-L.; Li, Y.-H. Effect of Corporate Governance on Institutional Investors’ Preferences: An Empirical Investigation in Taiwan. J. Risk Financial Manag. 2019, 12, 32. https://doi.org/10.3390/jrfm12010032
AMA Style
Lu S-L, Li Y-H. Effect of Corporate Governance on Institutional Investors’ Preferences: An Empirical Investigation in Taiwan. Journal of Risk and Financial Management. 2019; 12(1):32. https://doi.org/10.3390/jrfm12010032
Chicago/Turabian StyleLu, Su-Lien, and Ying-Hui Li. 2019. "Effect of Corporate Governance on Institutional Investors’ Preferences: An Empirical Investigation in Taiwan" Journal of Risk and Financial Management 12, no. 1: 32. https://doi.org/10.3390/jrfm12010032