Automated Diagnosis of Myocardial Infarction ECG Signals Using Sample Entropy in Flexible Analytic Wavelet Transform Framework


1
Discipline of Electrical Engineering, Indian Institute of Technology Indore, Indore 453552, India
2
Department of Electronics and Computer Engineering, Ngee Ann Polytechnic, Singapore 599489, Singapore
3
Department of Biomedical Engineering, School of Science and Technology, SUSS University, Singapore 599491, Singapore
4
Department of Biomedical Engineering, Faculty of Engineering, University of Malaya, Kuala Lumpur 50603, Malaysia
*
Authors to whom correspondence should be addressed.
Entropy 2017, 19(9), 488; https://doi.org/10.3390/e19090488
Submission received: 28 July 2017
/
Revised: 8 September 2017
/
Accepted: 8 September 2017
/
Published: 13 September 2017
(This article belongs to the Special Issue Evaluation of Systems’ Irregularity and Complexity: Sample Entropy, Its Derivatives, and Their Applications across Scales and Disciplines)
Abstract
:Myocardial infarction (MI) is a silent condition that irreversibly damages the heart muscles. It expands rapidly and, if not treated timely, continues to damage the heart muscles. An electrocardiogram (ECG) is generally used by the clinicians to diagnose the MI patients. Manual identification of the changes introduced by MI is a time-consuming and tedious task, and there is also a possibility of misinterpretation of the changes in the ECG. Therefore, a method for automatic diagnosis of MI using ECG beat with flexible analytic wavelet transform (FAWT) method is proposed in this work. First, the segmentation of ECG signals into beats is performed. Then, FAWT is applied to each ECG beat, which decomposes them into subband signals. Sample entropy (SEnt) is computed from these subband signals and fed to the random forest (RF), J48 decision tree, back propagation neural network (BPNN), and least-squares support vector machine (LS-SVM) classifiers to choose the highest performing one. We have achieved highest classification accuracy of 99.31% using LS-SVM classifier. We have also incorporated Wilcoxon and Bhattacharya ranking methods and observed no improvement in the performance. The proposed automated method can be installed in the intensive care units (ICUs) of hospitals to aid the clinicians in confirming their diagnosis.
1. Introduction
Myocardial infarction (MI) is a condition that indicates the injury of a heart cell due to the lack of oxygenated blood in the cardiac arteries [1]. The main cause of MI is coronary heart disease (CHD), which is responsible for nearly one-third of all deaths in the age group of above 35 years [2,3]. MI is silent in nature and may lead to fast and non-recoverable damage to the muscles of heart [3]. If MI is not controlled timely, then myocardial structure and functions of the left ventricle (LV) continue to be damaged further. For the diagnosis of MI, the electrocardiogram (ECG) is used due to its low operating cost and non-invasive nature [4]. Vital information related to the functioning of the heart can be assessed by analyzing the ECG signals. Moreover, the MI results in the ST deviations and T wave abnormalities in the ECG signal [4]. Manual identification of the changes in the ECG signals is a difficult task. Only 82% ST-segment elevation in MI subjects may be recognised by the experienced cardiologists [5]. Therefore, an automated identification system for MI patients is needed to facilitate the clinicians in their accurate diagnosis.The classification of ECG signals and the extracted beats from ECG signals have been studied in the literature for diagnosis of heart disorders [6,7,8].
In literature, various studies are performed for the detection of MI patients. In [9], a total integral of one ECG cycle and T-wave integral are suggested as features for the detection of MI. Time-domain features computed from 12-lead ECG signals are explored with fuzzy multi-layer perception (FMLP) network to classify the MI ECG signals [10]. In [11], a new multiple instance learning based approach is proposed for the detection of MI. The Hermite basis functions are used to decompose the multilead ECG signals and the obtained coefficients are found effective for the detection of acute MI [12]. The phase space fractal dimension features and the artificial neural network classifier are explored to detect the MI [13]. In [4], authors have applied neuro-fuzzy approach for the diagnosis of MI patients using multilead ECG signals. A hybrid approach based on hidden Markov models (HMMs) and Gaussian mixture models (GMMs) is proposed to distinguish the MI and normal ECG signals in [14].
In [15], characterization of the QRS complex of normal and MI subjects is performed using discrete wavelet transform (DWT). Three different wavelets are used to decompose the ECG signals up to the fourth level of decomposition. The Daubechies wavelet performed best among the three chosen wavelets. The DWT technique is incorporated to extract the QRS complex of ECG signals, and it is found that identification of the MI subject is possible by detecting the QRS complex [16]. In [17], the phase of the complex wavelet coefficients obtained from the dual tree complex wavelet transform (DTCWT) of 12-lead ECG signals is computed. Then, multiscale phase alteration values are used as features to identify the normal, MI, and other abnormal ECG signals. In [18], the ECG signals of normal, MI, and coronary artery disease (CAD) are applied to DWT, empirical mode decomposition (EMD), and discrete cosine transform (DCT) techniques. The authors in this study achieved the best performance when features obtained using DCT technique are subjected to the k-nearest neighbour classifier (k-NN) classifier. Contourlet transform (CT) and shearlet transform (ST) based technique is proposed to distinguish normal, MI, CAD, and congestive heart failure (CHF) subjects using ECG beats in [19]. The performance of the CT based technique is found to be better in comparison to the ST based method.
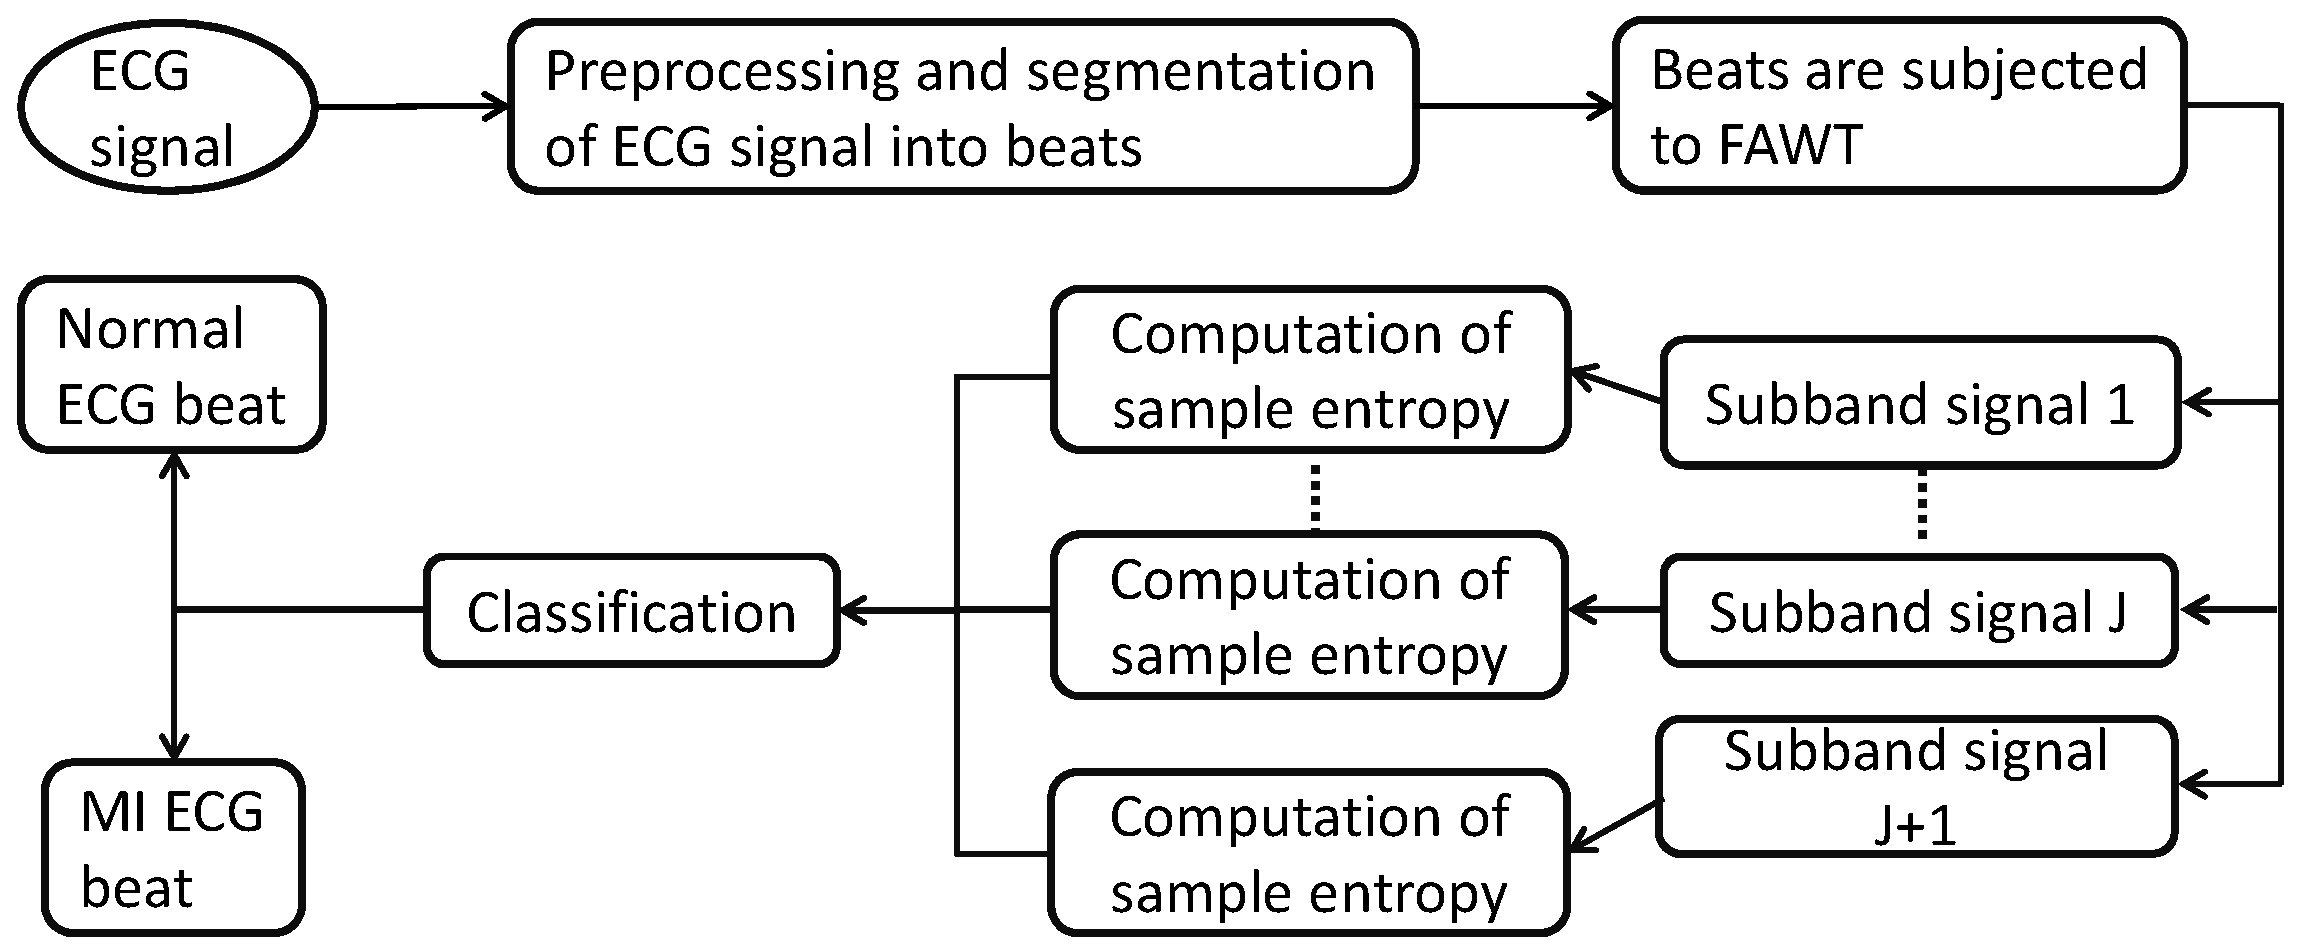
Our aim is to develop a method for automated diagnosis of MI patients in this work. We have analyzed normal and ECG beats using sample entropy (SEnt) in flexible analytic wavelet transform (FAWT) [20,21] framework. First, preprocessing is performed to remove the baseline wandering and other noise present in the ECG signals. Then, ECG signals are segmented into the beats. Furthermore, these beats are decomposed up to the 24th level of decomposition using FAWT. Sample entropy (SEnt) is computed from each subband signal, which is reconstructed from the corresponding coefficients of the FAWT based decomposition. The computed features are subjected to the random forest (RF) [22], J48 decision tree [23,24], back propagation neural network (BPNN) [25], and least-squares support vector machines (LS-SVM) [26] classifiers for separating the ECG beats of MI and normal classes. The steps performed in the present work are shown in Figure 1.
The organization of the remaining sections of the paper is as follows: the dataset used, preprocessing and segmentation of the ECG signals into beats, FAWT, SEnt, and classification methods are provided in Section 2. The obtained results in this work are given in Section 3 and discussed in Section 4. Finally, Section 5 presents the conclusions of the work.
2. Methodology
2.1. Dataset Studied in This Work
The dataset, containing normal and MI ECG signals, has been obtained from Physikalisch Technische Bundesanstalt (PTB) diagnostic ECG database from the Physiobank [27,28]. Each signal was acquired at the sampling rate of 1000 Hz. The dataset contains normal ECG recordings of 52 subjects and MI ECG recordings of 148 subjects. The ECG signals obtained from the lead-2 have been used in present work.
2.2. Preprocessing and Segmentation of ECG Signals
We have used Daubechies 6 (db6) wavelet basis function to eliminate baseline wander and noise present in the ECG signals [29]. After preprocessing, each ECG signal is segmented into beats based on R-peak detection. The Pan–Tompkins algorithm is applied to identify the R-peaks [30]. The 250 samples from the left and 400 samples from the right of the R-point are considered as one ECG beat [3]. Thus, each ECG beat contains 651 samples. Finally, we have 40,182 MI ECG beats and 10,546 normal ECG beats.
2.3. Computation of Features in FAWT Framework
In this work, we have computed SEnt in FAWT domain to classify MI and normal ECG beats. The brief explanation of FAWT method is given below.
• FAWT
The FAWT is a rational-dilation wavelet transform, which allows one to easily adjust the dilation factor, Quality (Q)-factor, and redundancy (R). The FAWT employs the fractional sampling rate in high pass and low pass channels. Moreover, it provides analytic bases by separating positive and negative frequencies in high-pass channels [20]. Employing fractional sampling rate and analytic bases in FAWT provides shift-invariance, tunable oscillatory bases, and flexible time-frequency covering [21]. These properties make this transform suitable for analysing the transient and oscillatory components of the signals. Q-factor controls the frequency resolution of FAWT. The high Q-factor provides finer filter banks for analysing the signals in the frequency domain. For fixed dilation and Q-factors, the redundancy controls the position of the wavelet.
The mathematical expressions of the filter banks for FAWT are given in Table 1. This table also provides expression for perfect reconstruction condition for FAWT.
In Table 1, A and B are used to adjust the sampling rate of the low-pass channel, and C and D are used to adjust the sampling rate of high-pass channels. The and are the cutoff frequencies of the pass-band and stop-band for the low pass filter, respectively. The and are the stop-band cutoff frequencies for the high pass filter, and and are the pass-band cutoff frequencies.
Redundancy is defined as follows [20]:
We have used , , , and [21,31,32] in the present work. Level of decomposition is kept at . The selection procedure of J is given in Section 3. FAWT has been utilized for detecting the CAD in [31,32], in order to diagnose CHF in [33], to identify electroencephalogram (EEG) signals of focal and non-focal classes in [34], and for the faults identification in rotating machinery [21]. We have used the Matlab toolbox ( Bayram, stanbul Technical University, stanbul, Turkey) available for FAWT implementation at [35].
2.4. Sample Entropy
SEnt [36] measures the complexity of the time series. It improves the performance by excluding the bias due to the self matches counted in the computation of approximate entropy. Higher values of SEnt indicate more complexity of the signal; on the other hand, the lower value of SEnt shows less complexity of the signal.
Let us consider a time-series () of length P for which the SEnt can be computed as [37]:
where is defined as follows [37]:
and
where is the total count for which without considering the self-matches.
The parameter is the distance between and vectors. and can be given as [37]:
where j and k vary from 1 to and .
In this work, we have experimentally chosen threshold , delay , and embedding dimension . Parameter selection procedure has been explained in the Section 3.
2.5. Studied Classification Techniques
We have used RF, J48 decision tree, BPNN, and LS-SVM in this work to perform the classification of normal and MI ECG beats based on the extracted features. In this work, we have used Waikato environment for knowledge analysis (WEKA) toolbox (version 3.7.13, The University of Waikato, Hamilton, New Zeland) for the implementation of RF, J48 decision tree, and BPNN classifiers [38]. We have used default parameters provided in WEKA toolbox for RF, J48 decision tree, and BPNN classifiers. Recently, RF, J48 decision tree, and BPNN classifiers have been used to analyze the sleep stages from EEG signals in [39].
Mathematical expression for decision making function of LS-SVM is given as follows [26]:
In the above expression, , , , b, , and Z represent a kernel function, Lagrangian multiplier, the z-th input vector of D-dimensions, bias term, target vector, and total data points, respectively.
Kernel functions are used with LS-SVM to map the input space to the higher dimension space and the two classes can be separated using an optimal hyperplane [26]. In this work, linear, polynomial, radial basis function (RBF), and Morlet wavelet kernels are employed with LS-SVM to perform the classification. The mathematical expressions of these kernels are provided in Table 2. In Table 2, x represents the order of the polynomial kernel, determines the width of RBF kernel, and q and D represent the scale factor of the Morlet wavelet kernel and the dimension of the feature set, respectively. LS-SVM is widely used in various biomedical signals classifications [40,41,42,43,44].
In the present work, we have evaluated the classification performance in terms of accuracy, specificity, and sensitivity [45].
3. Results
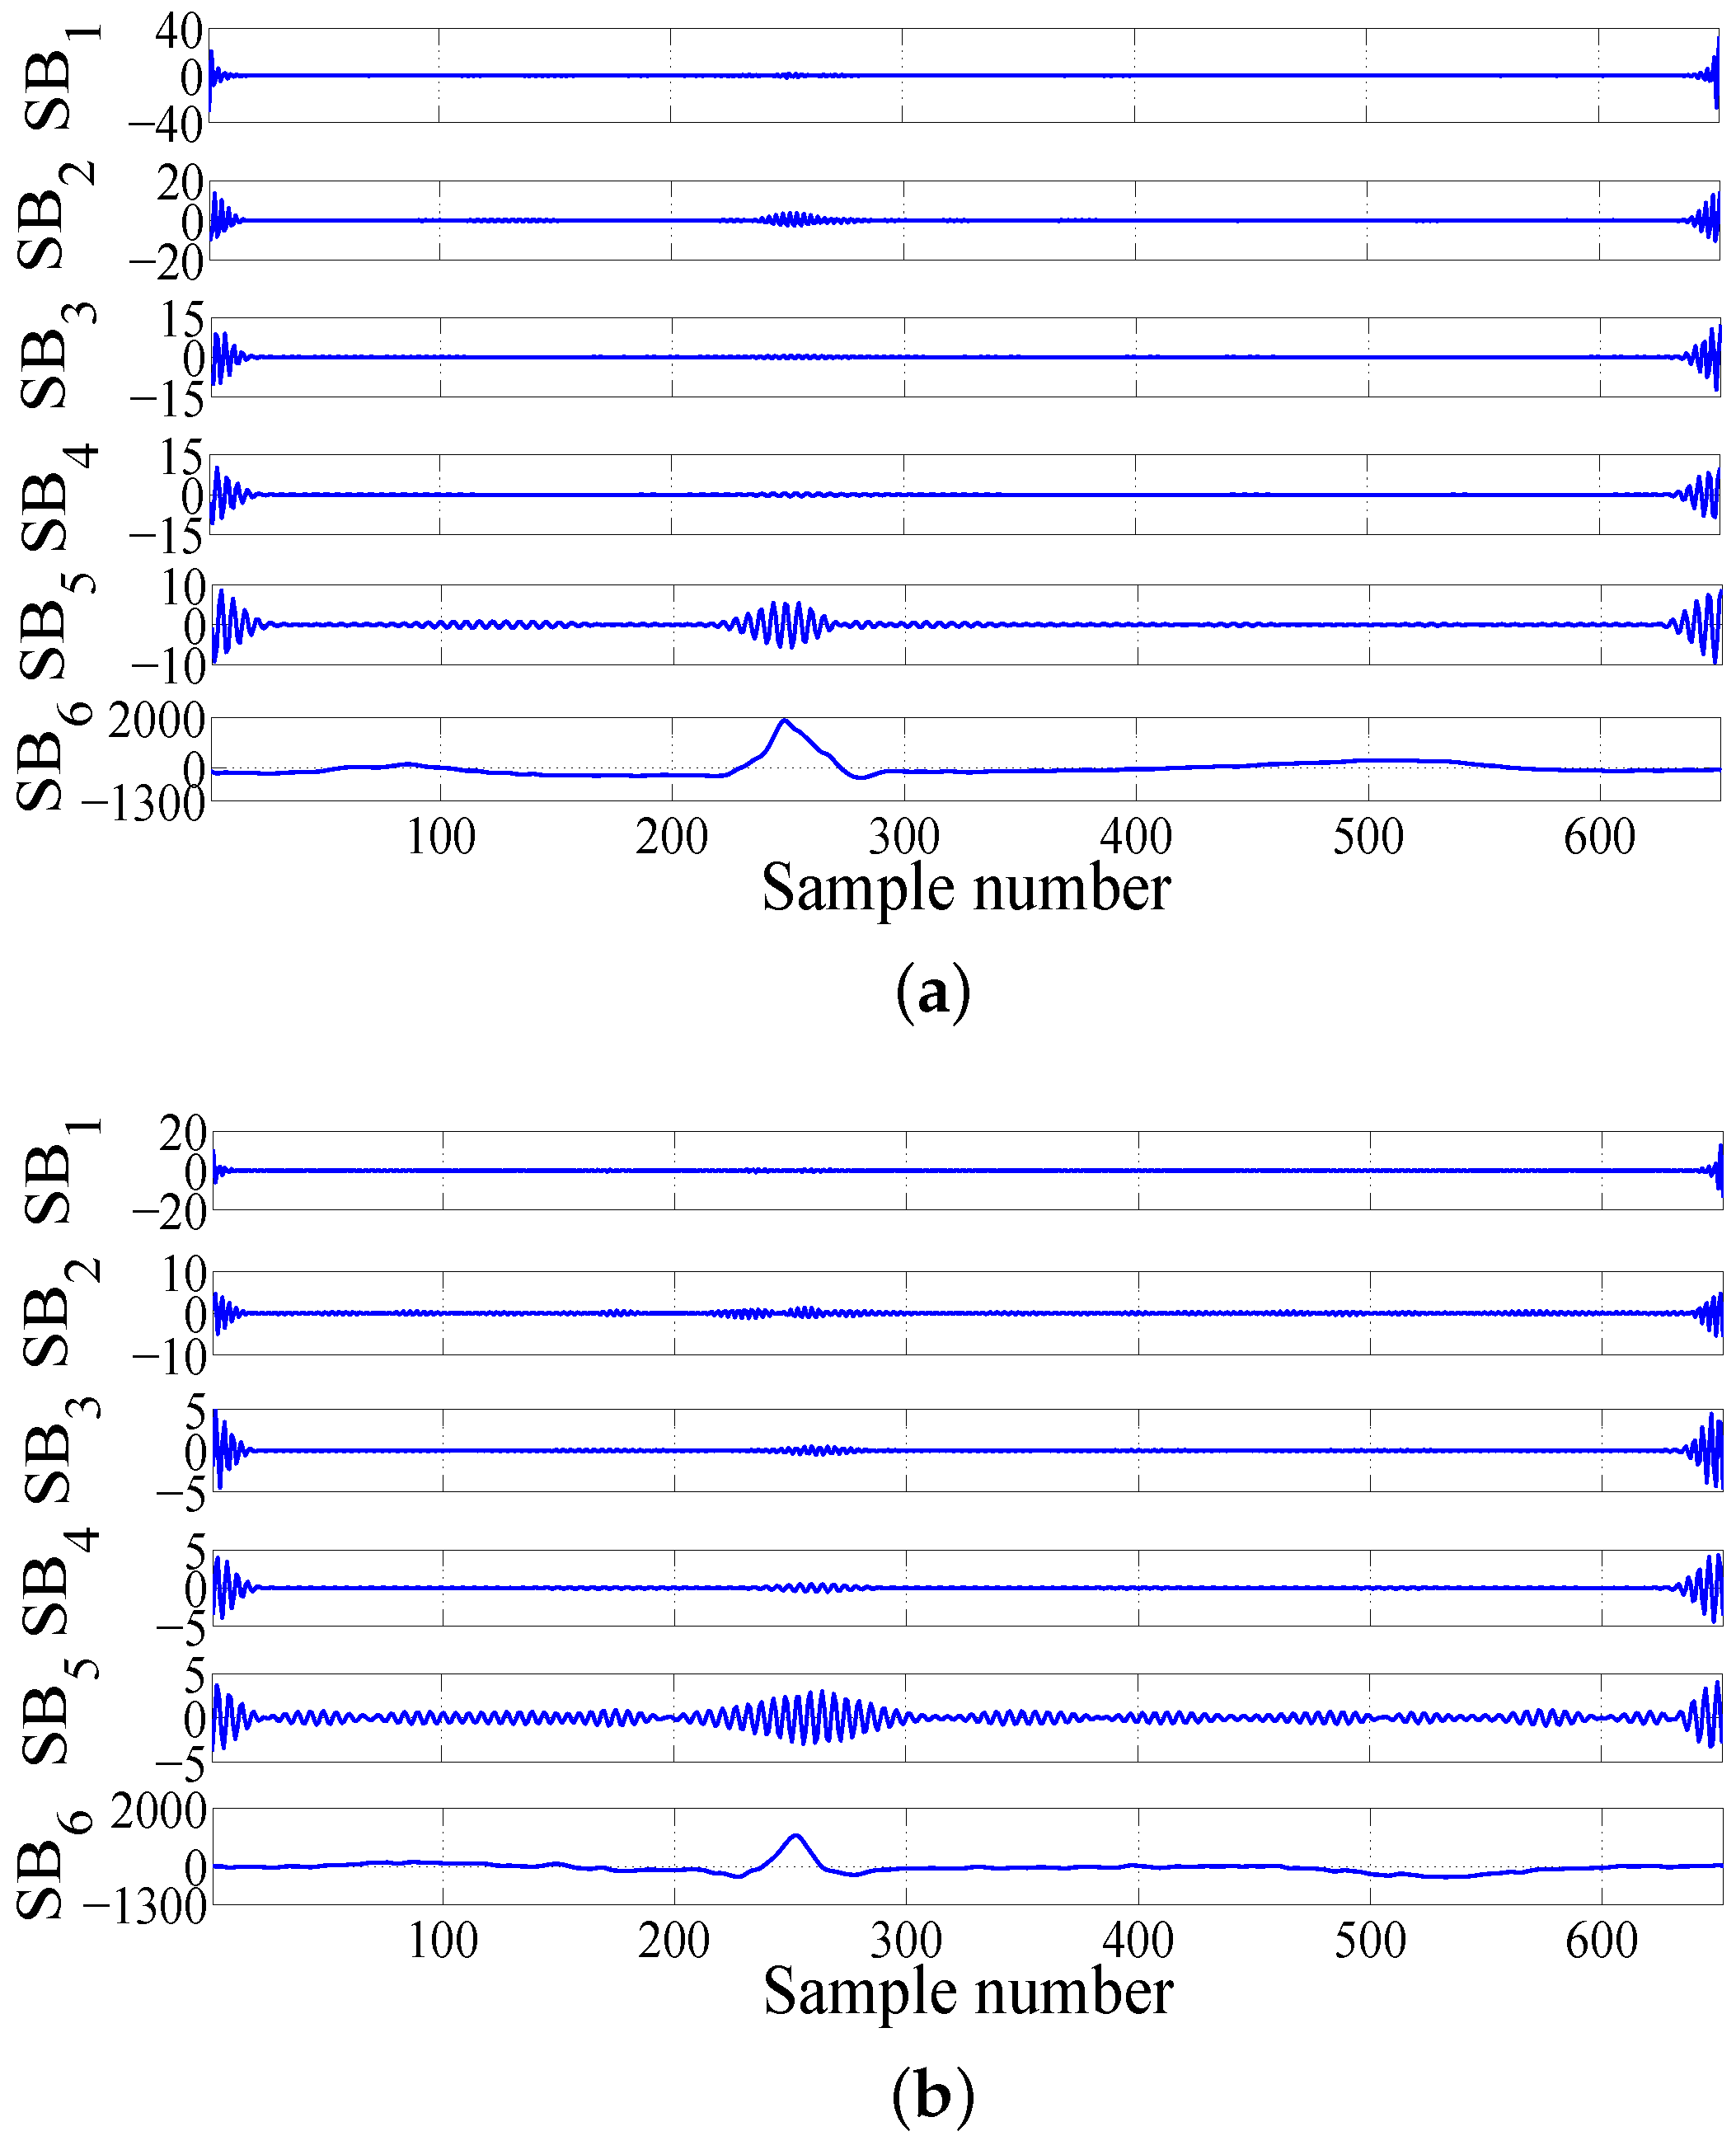
First, we have segmented the MI and normal ECG signals into the beats. Each ECG beat of both classes is decomposed into different subband signals using FAWT. The sample entropies are computed from these different subband signals. We start performing the experiments with and initial parameters for SEnt , , and are choosen [37]. Typical subband signals extracted from the decomposition of normal and MI ECG beats at the 5th level of decomposition using FAWT are shown in Figure 2a,b, respectively. In Figure 2, subband signals SB to SB are reconstructed from the detail coefficients from level 1 to level 5, and SB is reconstructed from the approximate coefficients at level 5.
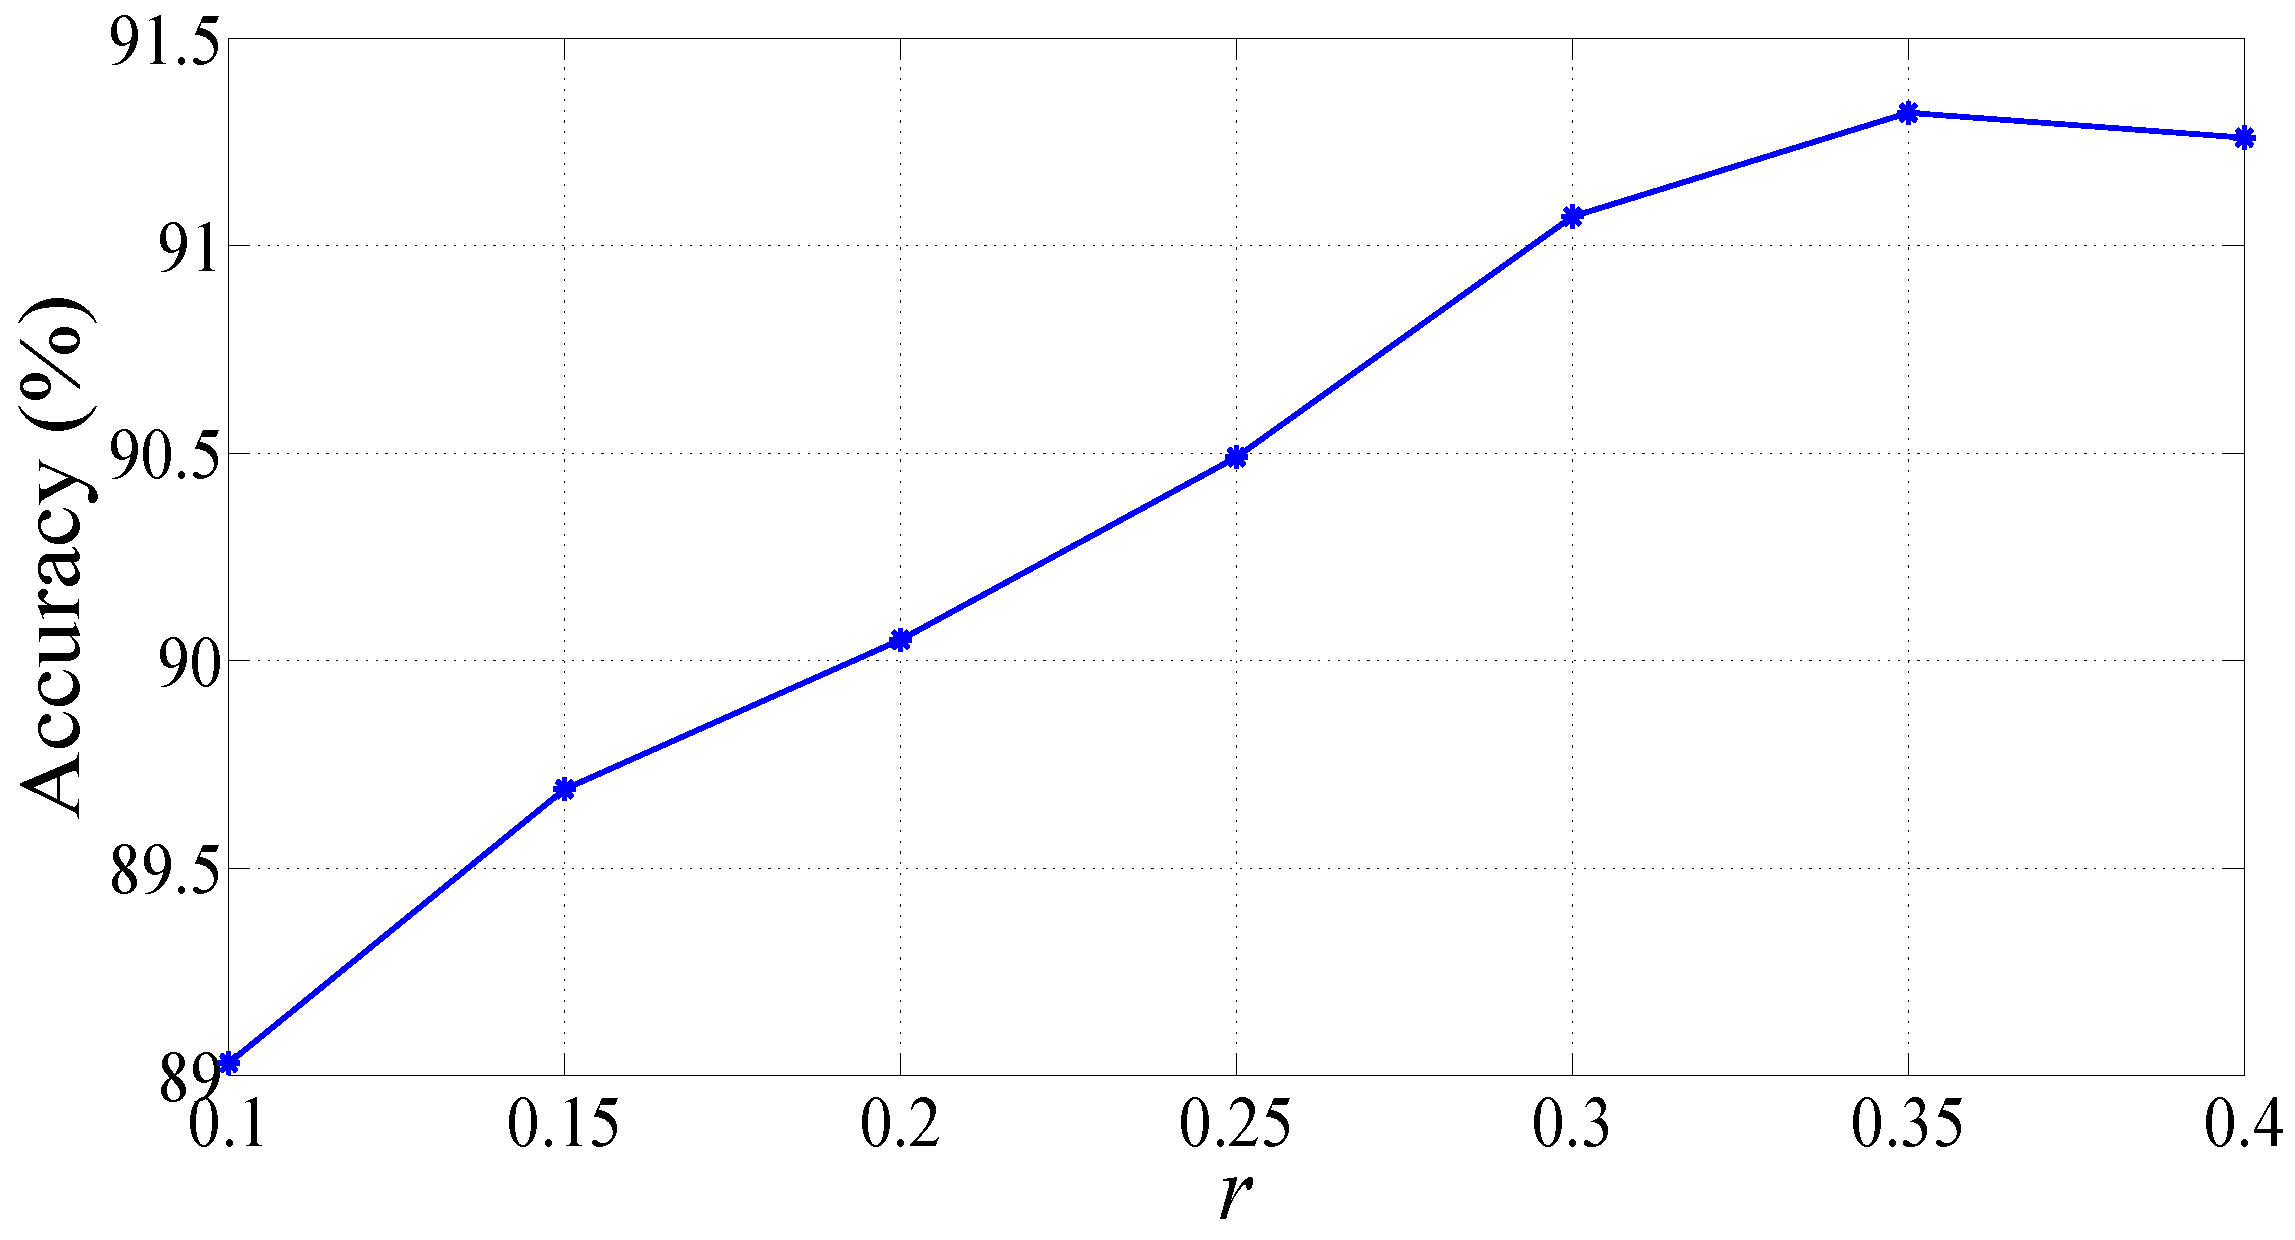
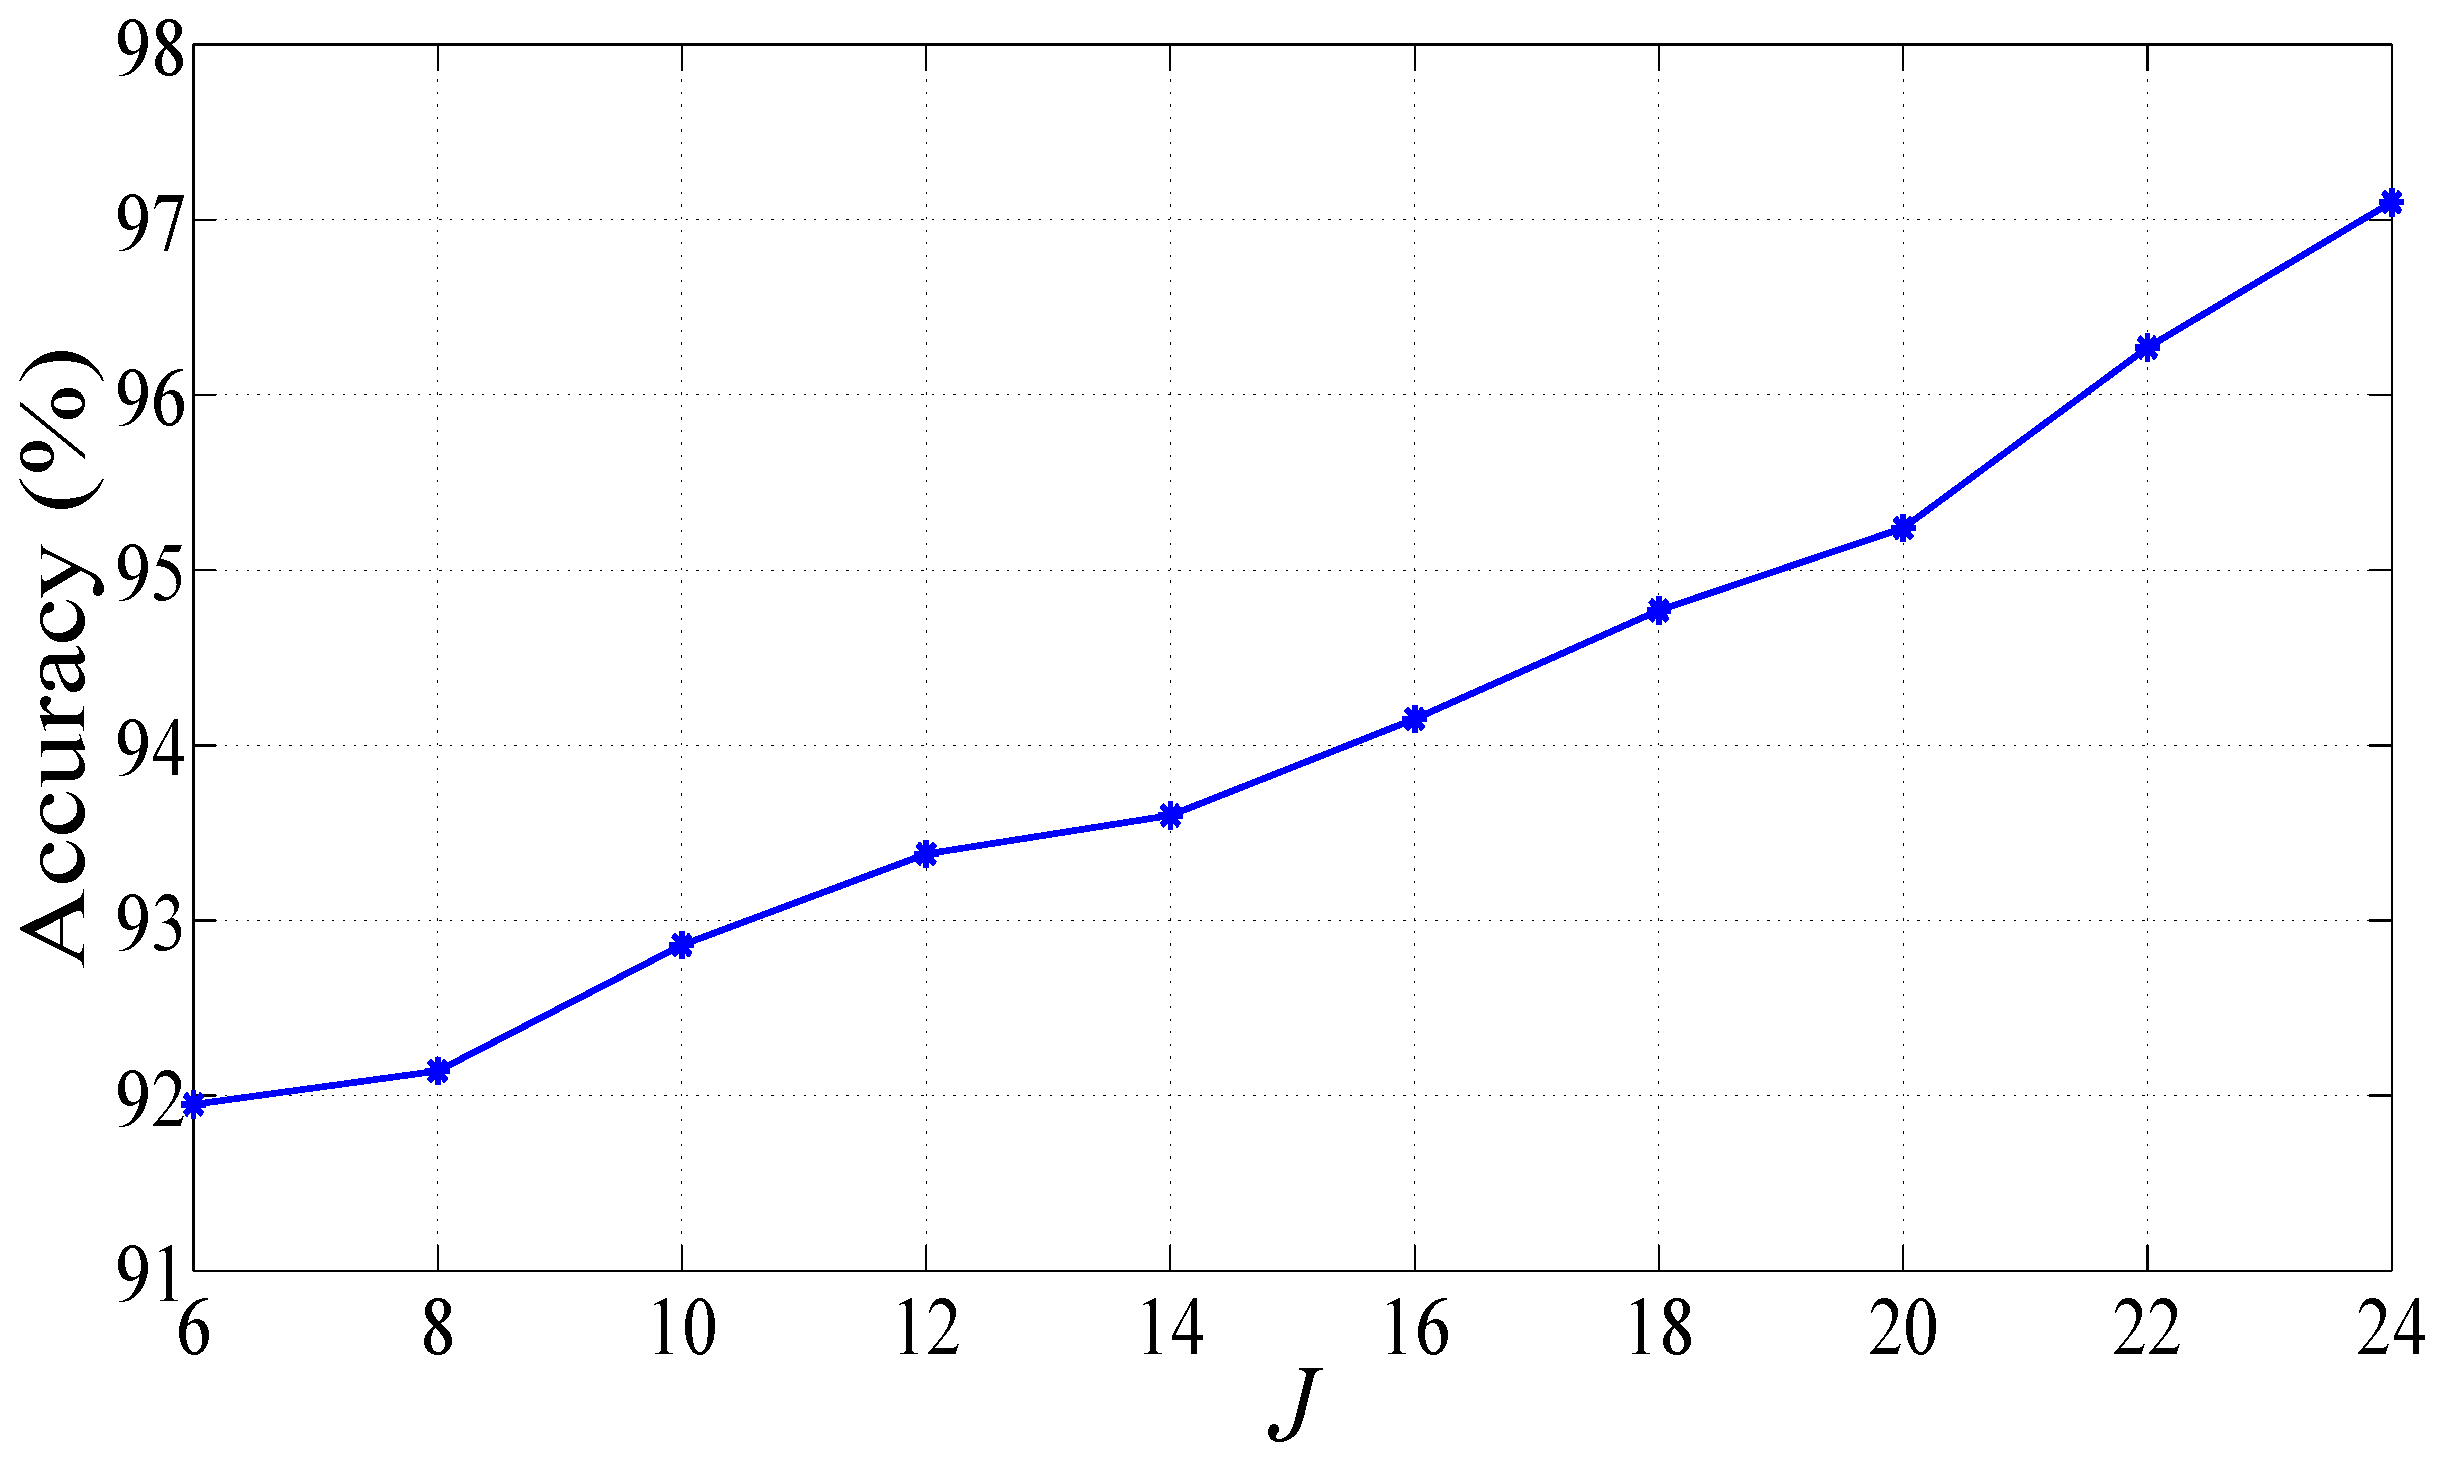
We fed the features to the RF classifier for selecting the suitable parameters. Variation of classification accuracies for various values for m and is provided in Table 3. It can be inferred from the table that accuracy of classification is highest for and . Classification accuracy for various values of r is shown in Figure 3. We have achieved the maximum classification accuracy for . Hence, we have used the parameters , , and to compute the sample entropies in this work. Moreover, we have increased the decomposition level to , and observed that the classification accuracy is increased to 91.95%. Hence, we further increased the decomposition level up to the maximum possible decomposition level using FAWT with parameters values , , , and which is [35]. The plot of classification accuracy versus decomposition levels is shown in Figure 4. We can observe that accuracy is increasing with increase in the decomposition level. The highest classification accuracy of 97.10% is achieved with RF classifier at . We have employed a 10-fold cross-validation procedure for the training and testing of the classifier [49]. The classification accuracy achieved using J48 decision tree and BPNN classifiers are 93.97% and 92.85%, respectively.
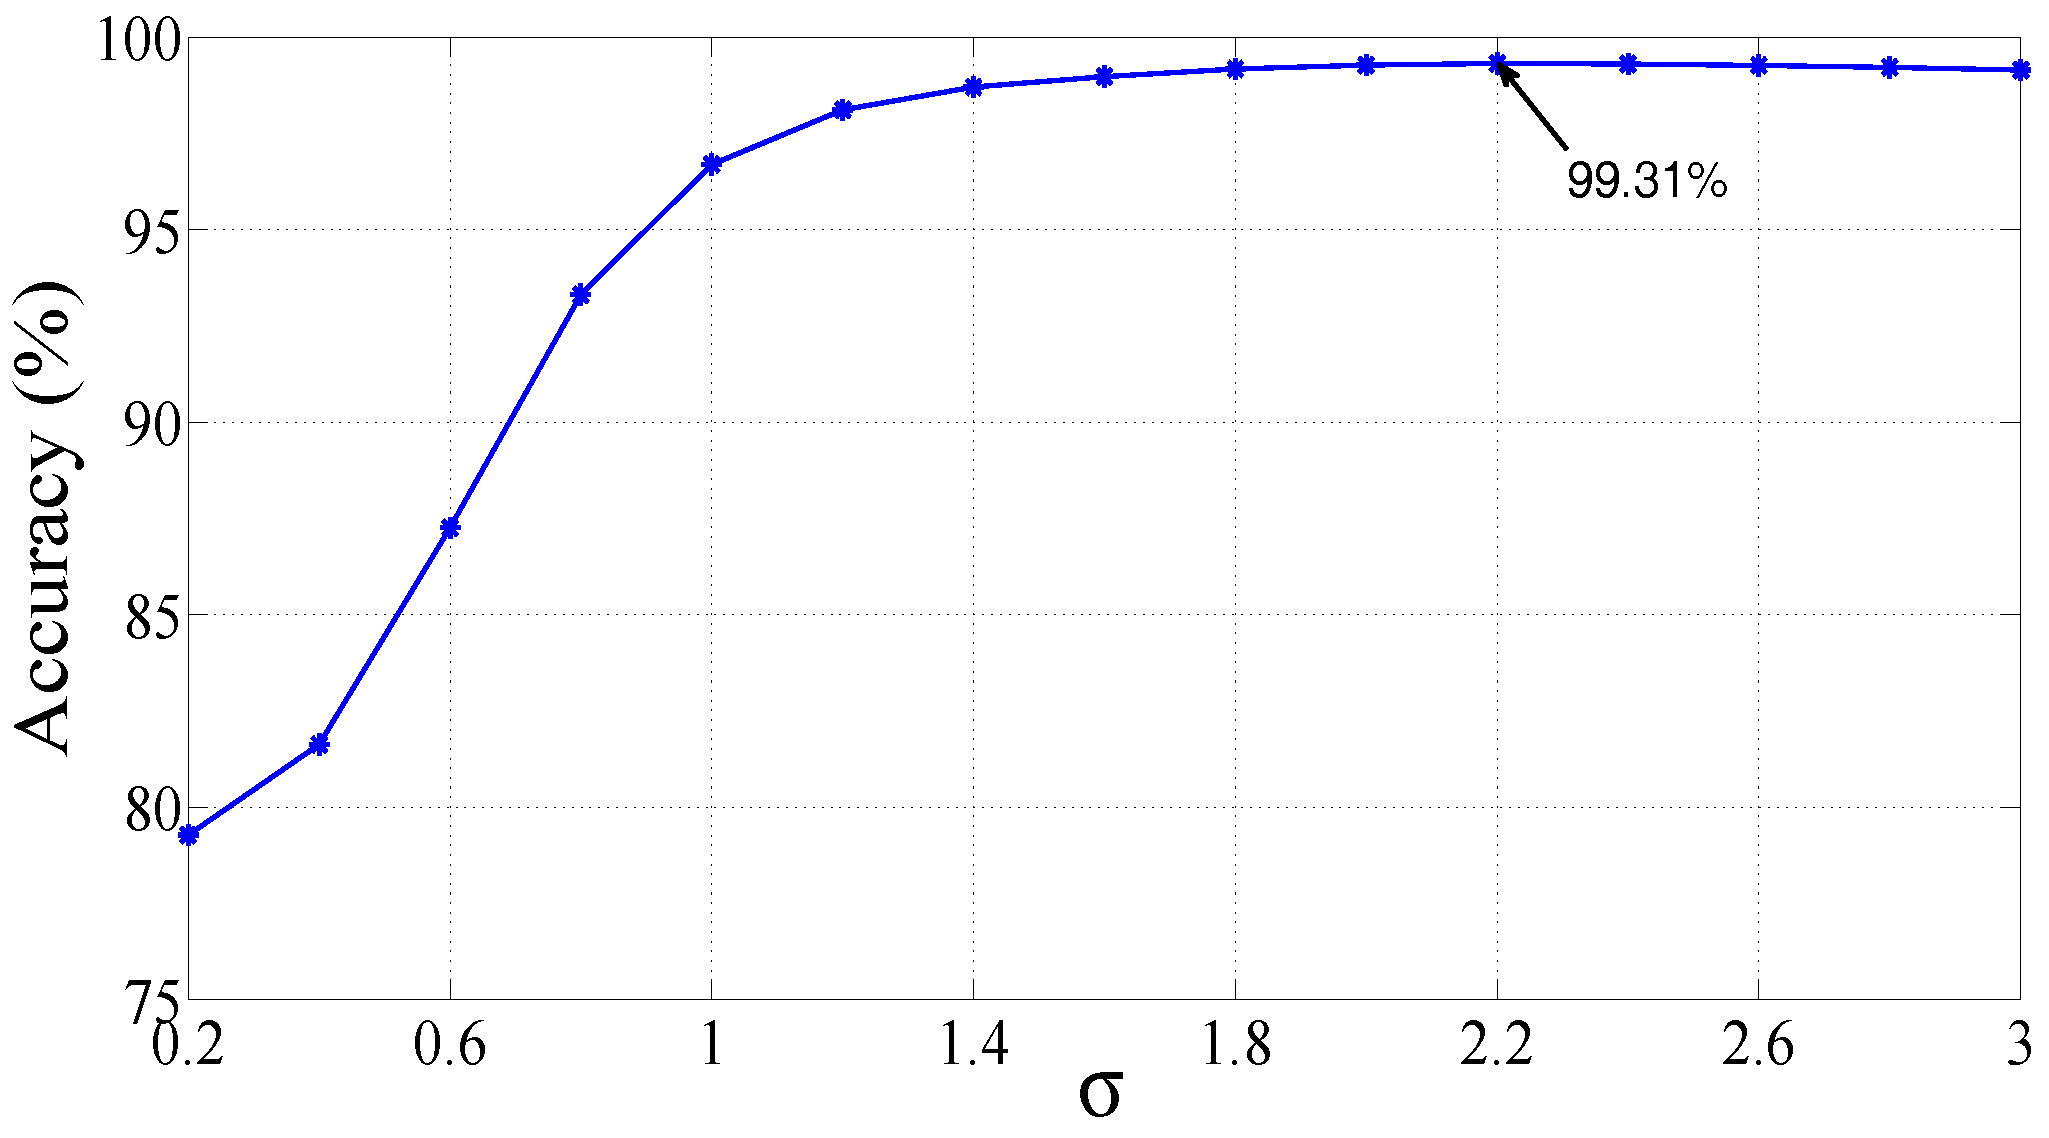
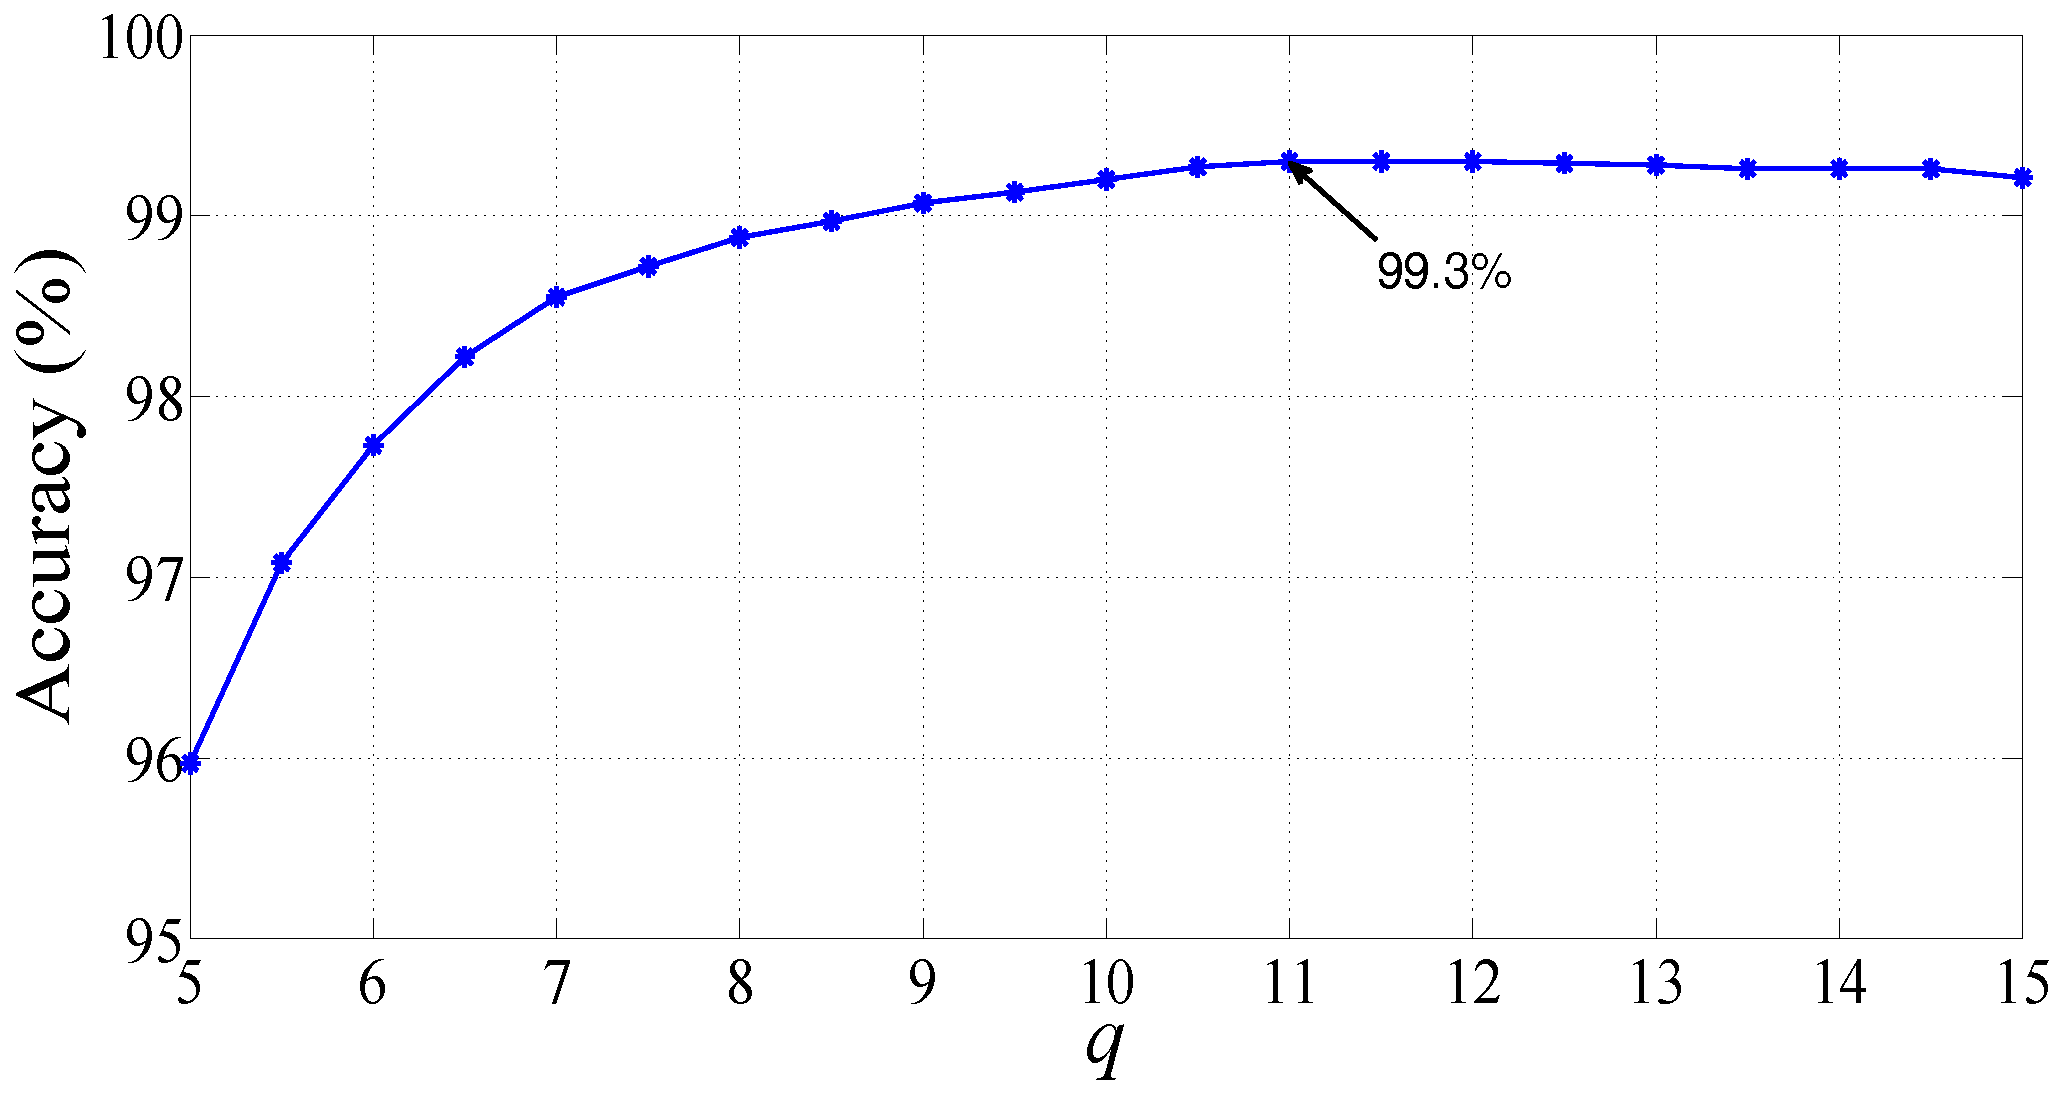
Furthermore, we have also tested the features with LS-SVM classifier with different kernel functions, namely, polynomial, linear, RBF, and Morlet wavelet kernels at . Variation of classification accuracy (%) with the RBF kernel parameter is shown in Figure 5. We can observe from Figure 5 that classification accuracy of LS-SVM is at a maximum for RBF kernel parameter = 2.2. Plot of changes in the value of accuracy (%) for variation in the parameter q of Morlet wavelet kernel is shown in Figure 6. LS-SVM showed maximum accuracy with Morlet wavelet kernel at q = 11. The performance of LS-SVM, using four different kernels used in our work, is summarized in Table 4. LS-SVM yielded the highest classification performance with RBF kernel, and achieved an accuracy, specificity, and sensitivity of 99.31%, 98.12%, and 99.62%, respectively.
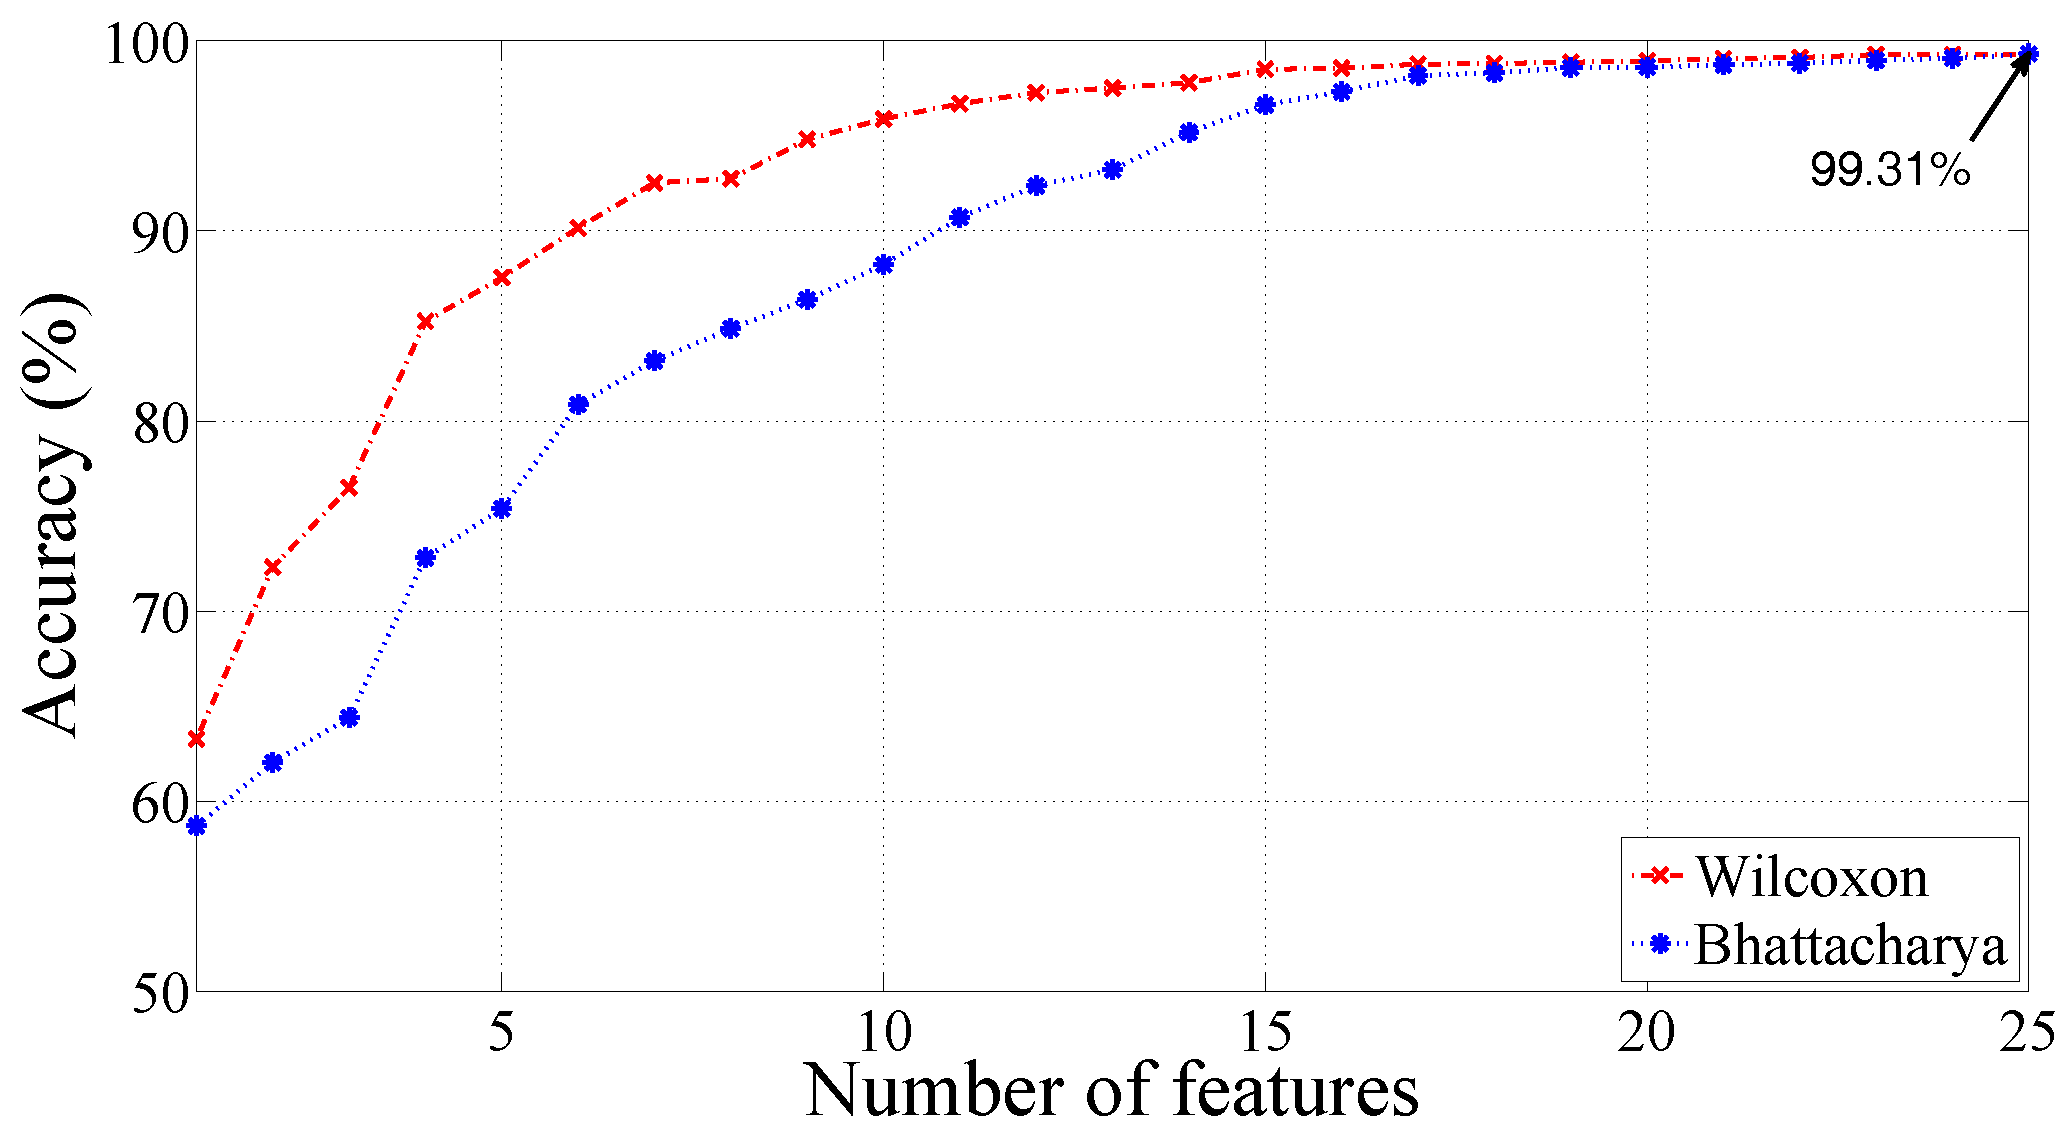
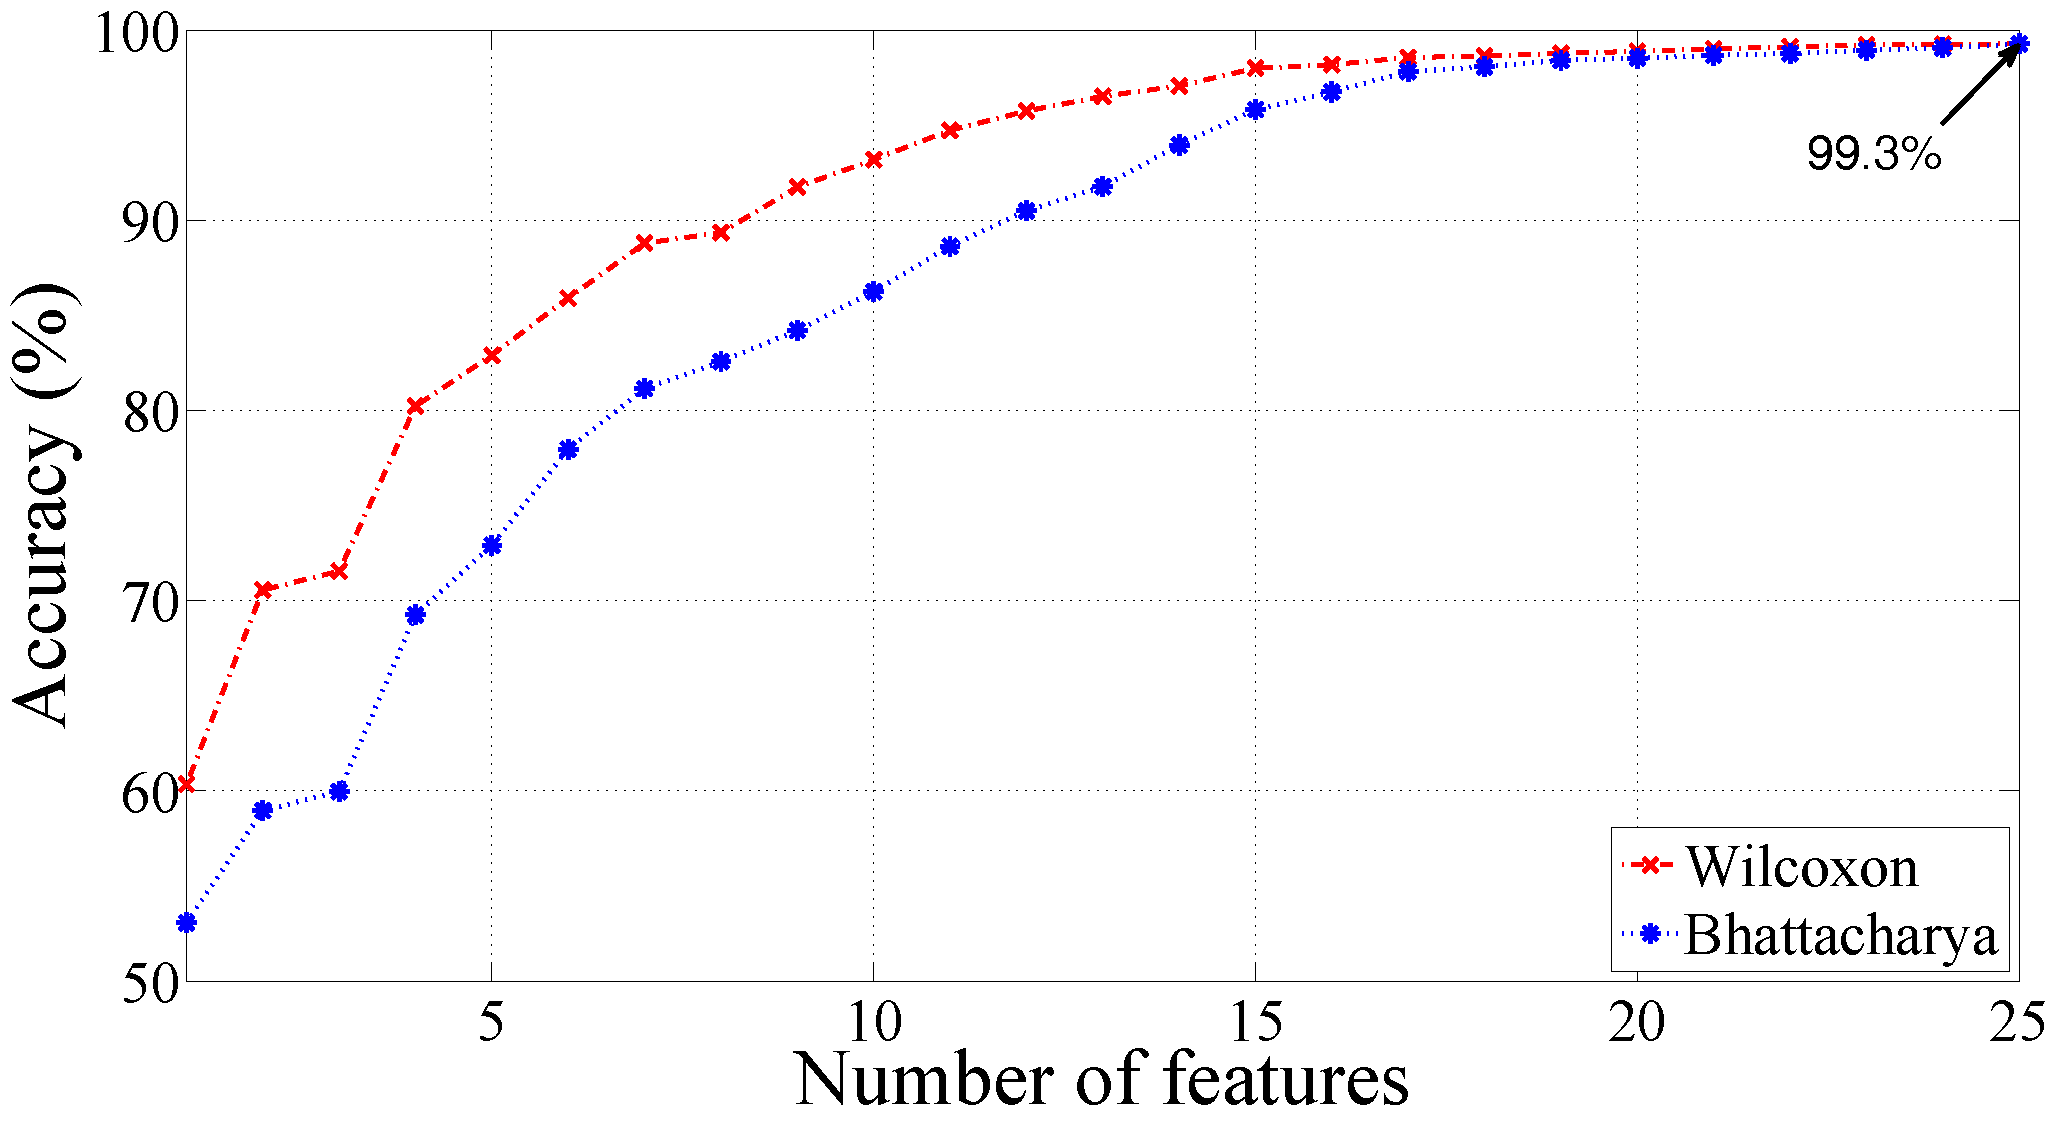
We have also employed Wilcoxon and Bhattacharya ranking methods for improving the performance of the proposed system [50,51]. The plots of the classification accuracy (%) for various ranked features are shown in Figure 7 and Figure 8 for RBF and Morlet wavelet kernels, respectively. It can be noted that the ranking methods are not able to improve the classification performance. The discrimination ability of the features is determined by computing the p-values using the Kruskal–Wallis (KW) test [52]. Recently, the KW test has been explored to test the statistical significance of the features in various biomedical signal analysis applications [53,54,55]. The p-values are found significantly low (p < 0.0001) for all the features (SEnt computed from 25 subband signals), which indicate good discrimination ability of all the computed features. Mean and standard deviation values for features are provided in Table 5. In Table 5, SEnt refers to the sample entropy and the subscript refers to the corresponding subband signal from which SEnt is computed.
Furthermore, we test the classification performance with balanced dataset (10,546 beats of each class) with the same parameter values of SEnt and FAWT. Classification accuracy for this case using LS-SVM classifier is presented in Table 6.
4. Discussions
In the present work, the ECG beats are decomposed into the 24th level of FAWT for obtaining subband signals. Furthermore, SEnt is computed from each of the subband signal. We can observed from Table 5 that SEnt computed from the lower frequency subband signals (SB21, SB22, SB24, and SB25) showed higher values for normal ECG beats in comparison to the MI ECG beats. Therefore, lower frequency subband signals show higher complexity for normal ECG beats than MI ECG beats. However, lower values of SEnt are observed for higher frequency subband signals extracted from normal ECG beats. Hence, complexity of higher frequency subband signals is lower for normal ECG beats. Finally, our method achieved 99.31% accuracy using LS-SVM classifier with RBF kernel.
Summary of the comparison of the present work with the other existing work is provided in Table 7. In [56], and time-domain features are computed from 12-lead ECG signals. The computed features are fed to the BPNN classifier, which yielded sensitivity of 97.5%. In [57], the time-domain method is used for extracting the features from the ECG signals to diagnose the MI patients. The authors have used 12-lead ECG signals of 20 normal and 20 MI subjects. They achieved a sensitivity of 85% to detect the MI subjects. In [58], the authors proposed a method based on the spectral differences of cross wavelet transform (XWT) of the ECG signals. Furthermore, they proposed threshold based classifier and achieved 97.6% classification accuracy. In [5], an algorithm based on the parametrization of ECG signal is developed. In this algorithm, a 20th order polynomial is fitted with the ECG signal. Their method showed 94.4% classification accuracy with J48 decision tree model for the diagnosis of MI. The approach presented in [59] utilized the evaluation of multiscale energy and eigenspace (MEES) features. The suggested method used support vector machine (SVM) classifier with RBF kernel and achieved 96.15% classification accuracy. In [3], ECG beats are decomposed up to the 4th level of decomposition using DWT. From the DWT coefficients, 12 nonlinear parameters are extracted. The authors achieved 98.8% accuracy using a k-NN classifier. They also performed statistical tests for determining the significance levels of the studied features. A method to automatically detect the MI using ECG signals is also proposed in [60]. The achieved accuracies were 93.53% and 95.22% using convolutional neural network (CNN) algorithms for the ECG beats with noise and without noise removal, respectively.
We have achieved highest accuracy in comparison to the existing methods that are mentioned in Table 7. Moreover, the methods suggested in [5,56,57,58,59] used ECG recordings of the multiple leads. However, our method uses only lead-2 ECG recordings, which makes our method less complex than multiple leads methods. The method suggested in [3] also requires ECG records of one lead (lead-11) only. However, the method in [3] achieved 98.8% classification accuracy with 47 features. In comparison to the method in [3], our method has achieved 99.31% accuracy with 25 features. Our method showed better results than the method in [3] with a lesser number of features. The study proposed in [60] also used lead-2 ECG signals and achieved 95.22% accuracy with an 11-layer deep neural network. This method is more complex than our method and also time-consuming.
5. Conclusions
In this work, normal and MI ECG beats are analyzed using SEnt in FAWT framework. We have achieved the highest classification performance using lead-2 ECG signals as compared to the reported works. We have identified the suitable parameters to compute the SEnt in FAWT domain for the detection of MI subjects accurately. Parameters for the computation of SEnt and the decomposition level in FAWT domain are selected on the basis of classification accuracy computed using an RF classifier. Achieved classification accuracies with RF, J48 decision tree, BPNN, and LS-SVM classifiers are 97.10%, 93.97%, 92.85%, and 99.31%, respectively, using the entire dataset. Our method achieved classification accuracy of 98.27% with LS-SVM using balanced data set. Therefore, we can conclude that our methodology has performed well for the detection of MI patients using both balanced and unbalanced (entire) datasets. Our automated system can be used to assist cardiologists to cross check their diagnosis. It can be extended to diagnose the severity of MI. Along with the echocardiography, it can be used to localize the MI.
Author Contributions
Ram Bilas Pachori and U. Rajendra Acharya designed the research problem. Mohit Kumar carried out the research work and wrote the manuscript. All authors edited the manuscript. All authors have read and approved the final manuscript.
Conflicts of Interest
The authors declare no conflict of interest.
References
- Thygesen, K.; Alpert, J.S.; Jaffe, A.S.; Simoons, M.L.; Chaitman, B.R.; White, H.D. Third universal definition of myocardial infarction. Eur. Heart J. 2012, 33, 2551–2567. [Google Scholar] [CrossRef] [PubMed]
- Sanchis-Gomar, F.; Perez-Quilis, C.; Leischik, R.; Lucia, A. Epidemiology of coronary heart disease and acute coronary syndrome. Ann. Transl. Med. 2016, 4, 256. [Google Scholar] [CrossRef] [PubMed]
- Acharya, U.R.; Fujita, H.; Sudarshan, V.K.; Oh, S.L.; Adam, M.; Koh, J.E.W.; Tan, J.H.; Ghista, D.N.; Martis, R.J.; Chua, C.K.; et al. Automated detection and localization of myocardial infarction using electrocardiogram: A comparative study of different leads. Knowl. Based Syst. 2016, 99, 146–156. [Google Scholar] [CrossRef]
- Lu, H.L.; Ong, K.; Chia, P. An automated ECG classification system based on a neuro-fuzzy system. Comput. Cardiol. 2000, 27, 387–390. [Google Scholar]
- Liu, B.; Liu, J.; Wang, G.; Huang, K.; Li, F.; Zheng, Y.; Luo, Y.; Zhou, F. A novel electrocardiogram parameterization algorithm and its application in myocardial infarction detection. Comput. Biol. Med. 2015, 61, 178–184. [Google Scholar] [CrossRef] [PubMed]
- Crippa, P.; Curzi, A.; Falaschetti, L.; Turchetti, C. Multi-class ECG beat classification based on a Gaussian mixture model of Karhunen-Loève transform. Int. J. Simul. Syst. Sci. Technol. 2015, 16. [Google Scholar] [CrossRef]
- Biagetti, G.; Crippa, P.; Curzi, A.; Orcioni, S.; Turchetti, C. A Multi-class ECG beat classifier based on the truncated KLT representation. In Proceedings of the European Modelling Symposium, Pisa, Italy, 21–23 October 2014; pp. 93–98. [Google Scholar]
- Li, H.; Liang, H.; Miao, C.; Cao, L.; Feng, X.; Tang, C.; Li, E. Novel ECG signal classification based on KICA nonlinear feature extraction. Circuits Syst. Signal Process. 2016, 35, 1187–1197. [Google Scholar] [CrossRef]
- Safdarian, N.; Dabanloo, N.J.; Attarodi, G. A new pattern recognition method for detection and localization of myocardial infarction using T-wave integral and total integral as extracted features from one cycle of ECG signal. J. Biomed. Sci. Eng. 2014, 7, 818–824. [Google Scholar] [CrossRef]
- Bozzola, P.; Bortolan, G.; Combi, C.; Pinciroli, F.; Brohet, C. A hybrid neuro-fuzzy system for ECG classification of myocardial infarction. In Proceedings of the Computers in Cardiology, Indianapolis, IN, USA, 8–11 September 1996; pp. 241–244. [Google Scholar]
- Sun, L.; Lu, Y.; Yang, K.; Li, S. ECG analysis using multiple instance learning for myocardial infarction detection. IEEE Trans. Biomed. Eng. 2012, 59, 3348–3356. [Google Scholar] [CrossRef] [PubMed]
- Haraldsson, H.; Edenbrandt, L.; Ohlsson, M. Detecting acute myocardial infarction in the 12-lead ECG using Hermite expansions and neural networks. Artif. Intell. Med. 2004, 32, 127–136. [Google Scholar] [CrossRef] [PubMed]
- Lahiri, T.; Kumar, U.; Mishra, H.; Sarkar, S.; Roy, A.D. Analysis of ECG signal by chaos principle to help automatic diagnosis of myocardial infarction. J. Sci. Ind. Res. 2009, 68, 866–870. [Google Scholar]
- Chang, P.C.; Hsieh, J.C.; Lin, J.J.; Chou, Y.H.; Liu, C.H. A hybrid system with hidden Markov models and Gaussian mixture models for myocardial infarction classification with 12-lead ECGs. In Proceedings of the 11th IEEE International Conference on High Performance Computing and Communications, Seoul, Korea, 25–27 June 2009; pp. 110–116. [Google Scholar]
- McDarby, G.; Celler, B.G.; Lovell, N.H. Characterising the discrete wavelet transform of an ECG signal with simple parameters for use in automated diagnosis. In Proceedings of the 2nd International Conference on Bioelectromagnetism, Melbourne, Australia, 15–18 February 1998; pp. 31–32. [Google Scholar]
- Banerjee, S.; Mitra, M. ECG feature extraction and classification of anteroseptal myocardial infarction and normal subjects using discrete wavelet transform. In Proceedings of the International Conference on Systems in Medicine and Biology, Kharagpur, India, 16–18 December 2010; pp. 55–60. [Google Scholar]
- Tripathy, R.K.; Dandapat, S. Detection of cardiac abnormalities from multilead ECG using multiscale phase alternation features. J. Med. Syst. 2016, 40, 143. [Google Scholar] [CrossRef] [PubMed]
- Acharya, U.R.; Fujita, H.; Adam, M.; Lih, O.S.; Sudarshan, V.K.; Hong, T.J.; Koh, J.E.W.; Hagiwara, Y.; Chua, C.K.; Poo, C.K.; et al. Automated characterization and classification of coronary artery disease and myocardial infarction by decomposition of ECG signals: A comparative study. Inf. Sci. 2017, 377, 17–29. [Google Scholar] [CrossRef]
- Acharya, U.R.; Fujita, H.; Sudarshan, V.K.; Oh, S.L.; Adam, M.; Tan, J.H.; Koo, J.H.; Jain, A.; Lim, C.M.; Chua, K.C. Automated characterization of coronary artery disease, myocardial infarction, and congestive heart failure using contourlet and shearlet transforms of electrocardiogram signal. Knowl. Based Syst. 2017, 132, 156–166. [Google Scholar] [CrossRef]
- Bayram, İ. An analytic wavelet transform with a flexible time-frequency covering. IEEE Trans. Signal Process. 2013, 61, 1131–1142. [Google Scholar]
- Zhang, C.; Li, B.; Chen, B.; Cao, H.; Zi, Y.; He, Z. Weak fault signature extraction of rotating machinery using flexible analytic wavelet transform. Mech. Syst. Signal Process. 2015, 64–65, 162–187. [Google Scholar] [CrossRef]
- Breiman, L. Random forests. Mach. Learn. 2001, 45, 5–32. [Google Scholar] [CrossRef]
- Quinlan, J.R. Induction of decision trees. Mach. Learn. 1986, 1, 81–106. [Google Scholar] [CrossRef]
- Quinlan, J.R. C4.5: Programs for Machine Learning; Morgan Kaufmann: San Francisco, CA, USA, 1993. [Google Scholar]
- Jang, J.S.R.; Sun, C.T.; Mizutani, E. Neuro-Fuzzy and Soft Computing: A Computational Approach to Learning and Machine Intelligence; Pearson: London, UK, 1997. [Google Scholar]
- Suykens, J.A.K.; Vandewalle, J. Least squares support vector machine classifiers. Neural Process. Lett. 1999, 9, 293–300. [Google Scholar] [CrossRef]
- Bousseljot, R.; Kreiseler, D.; Schnabel, A. Nutzung der EKG-Signaldatenbank CARDIODAT der PTB über das Internet. Biomed. Tech. Biomed. Eng. 1995, 40, 317–318. [Google Scholar] [CrossRef]
- Goldberger, A.L.; Amaral, L.A.; Glass, L.; Hausdorff, J.M.; Ivanov, P.C.; Mark, R.G.; Mietus, J.E.; Moody, G.B.; Peng, C.K.; Stanley, H.E. Physiobank, physiotoolkit, and physionet: Components of a new research resource for complex physiologic signals. Circulation 2000, 101, e215–e220. [Google Scholar] [CrossRef] [PubMed]
- Martis, R.J.; Acharya, U.R.; Min, L.C. ECG beat classification using PCA, LDA, ICA and discrete wavelet transform. Biomed. Signal Process. Control 2013, 8, 437–448. [Google Scholar] [CrossRef]
- Pan, J.; Tompkins, W.J. A real-time QRS detection algorithm. IEEE Trans. Biomed. Eng. 1985, 32, 230–236. [Google Scholar] [CrossRef] [PubMed]
- Kumar, M.; Pachori, R.B.; Acharya, U.R. An efficient automated technique for CAD diagnosis using flexible analytic wavelet transform and entropy features extracted from HRV signals. Expert Syst. Appl. 2016, 63, 165–172. [Google Scholar] [CrossRef]
- Kumar, M.; Pachori, R.B.; Acharya, U.R. Characterization of coronary artery disease using flexible analytic wavelet transform applied on ECG signals. Biomed. Signal Process. Control 2017, 31, 301–308. [Google Scholar] [CrossRef]
- Kumar, M.; Pachori, R.B.; Acharya, U.R. Use of accumulated entropies for automated detection of congestive heart failure in flexible analytic wavelet transform framework based on short-term HRV signals. Entropy 2017, 19, 92. [Google Scholar] [CrossRef]
- Gupta, V.; Priya, T.; Yadav, A.K.; Pachori, R.B.; Acharya, U.R. Automated detection of focal EEG signals using features extracted from flexible analytic wavelet transform. Pattern Recogn. Lett. 2017, 94, 180–188. [Google Scholar] [CrossRef]
- Bayram, İ. An Analytic Wavelet Transform with a Flexible Time-Frequency Covering. Available online: http://web.itu.edu.tr/ibayram/AnDWT/ (accessed on 11 June 2017).
- Richman, J.S.; Moorman, J.R. Physiological time–series analysis using approximate entropy and sample entropy. Am. J. Physiol. Heart Circ. Physiol. 2000, 278, H2039–H2049. [Google Scholar] [PubMed]
- Sokunbi, M.O.; Fung, W.; Sawlani, V.; Choppin, S.; Linden, D.E.J.; Thome, J. Resting state fMRI entropy probes complexity of brain activity in adults with ADHD. Psychiatry Res. Neuroimaging 2013, 214, 341–348. [Google Scholar] [CrossRef] [PubMed]
- Hall, M.; Frank, E.; Holmes, G.; Pfahringer, B.; Reutemann, P.; Witten, I.H. The WEKA data mining software: An update. SIGKDD Explor. 2009, 11, 10–18. [Google Scholar] [CrossRef]
- Sharma, R.; Pachori, R.B.; Upadhyay, A. Automatic sleep stages classification based on iterative filtering of electroencephalogram signals. Neural Comput. Appl. 2017, 1–20. [Google Scholar] [CrossRef]
- Sharma, R.; Pachori, R.B.; Acharya, U.R. An integrated index for the identification of focal electroencephalogram signals using discrete wavelet transform and entropy measures. Entropy 2015, 17, 5218–5240. [Google Scholar]
- Pachori, R.B.; Kumar, M.; Avinash, P.; Shashank, K.; Acharya, U.R. An improved online paradigm for screening of diabetic patients using RR-interval signals. J. Mech. Med. Biol. 2016, 16, 1640003. [Google Scholar] [CrossRef]
- Sharma, R.; Pachori, R.B.; Acharya, U.R. Application of entropy measures on intrinsic mode functions for the automated identification of focal electroencephalogram signals. Entropy 2015, 17, 669–691. [Google Scholar] [CrossRef]
- Sharma, R.; Pachori, R.B. Classification of epileptic seizures in EEG signals based on phase space representation of intrinsic mode functions. Expert Syst. Appl. 2015, 42, 1106–1117. [Google Scholar] [CrossRef]
- Sharma, R.; Kumar, M.; Pachori, R.B.; Acharya, U.R. Decision support system for focal EEG signals using tunable-Q wavelet transform. J. Comput. Sci. 2017, 20, 52–60. [Google Scholar] [CrossRef]
- Azar, A.T.; El-Said, S.A. Performance analysis of support vector machines classifiers in breast cancer mammography recognition. Neural Comput. Appl. 2014, 24, 1163–1177. [Google Scholar] [CrossRef]
- Khandoker, A.H.; Lai, D.T.H.; Begg, R.K.; Palaniswami, M. Wavelet-based feature extraction for support vector machines for screening balance impairments in the elderly. IEEE Trans. Neural Syst. Rehabil. Eng. 2007, 15, 587–597. [Google Scholar] [CrossRef] [PubMed]
- Zavar, M.; Rahati, S.; Akbarzadeh-T, M.R.; Ghasemifard, H. Evolutionary model selection in a wavelet-based support vector machine for automated seizure detection. Expert Syst. Appl. 2011, 38, 10751–10758. [Google Scholar] [CrossRef]
- Bajaj, V.; Pachori, R.B. Classification of seizure and nonseizure EEG signals using empirical mode decomposition. IEEE Trans. Inf. Technol. Biomed. 2012, 16, 1135–1142. [Google Scholar]
- Kohavi, R. A study of cross-validation and bootstrap for accuracy estimation and model selection. In Proceedings of the 14th International Joint Conference on Artificial Intelligence, Montreal, QC, Canada, 20–25 August 1995; pp. 1137–1143. [Google Scholar]
- Derryberry, D.R.; Schou, S.B.; Conover, W.J. Teaching rank-based tests by emphasizing structural similarities to corresponding parametric tests. J. Stat. Educ. 2010, 18, 1–19. [Google Scholar]
- Theodoridis, S.; Koutroumbas, K. Feature Selection. In Pattern Recognition, 2nd ed.; Academic Press: San Diego, CA, USA, 2003; pp. 163–205. [Google Scholar]
- McKight, P.E.; Najab, J. Kruskal-Wallis Test. Corsini Encyclopedia of Psychology; John Wiley and Sons, Inc.: Hoboken, NJ, USA, 2010. [Google Scholar]
- Pachori, R.B. Discrimination between ictal and seizure-free EEG signals using empirical mode decomposition. Res. Lett. Signal Process. 2008. [Google Scholar] [CrossRef]
- Pachori, R.B.; Avinash, P.; Shashank, K.; Sharma, R.; Acharya, U.R. Application of empirical mode decomposition for analysis of normal and diabetic RR-interval signals. Expert Syst. Appl. 2015, 42, 4567–4581. [Google Scholar] [CrossRef]
- Sood, S.; Kumar, M.; Pachori, R.B.; Acharya, U.R. Application of empirical mode decomposition-based features for analysis of normal and CAD heart rate signals. J. Mech. Med. Biol. 2016, 16, 1640002. [Google Scholar] [CrossRef]
- Arif, M.; Malagore, I.A.; Afsar, F.A. Automatic detection and localization of myocardial infarction using back propagation neural networks. In Proceedings of the 4th International Conference on Bioinformatics and Biomedical Engineering, Chengdu, China, 18–20 June 2010; pp. 1–4. [Google Scholar]
- Al-Kindi, S.G.; Ali, F.; Farghaly, A.; Nathani, M.; Tafreshi, R. Towards real-time detection of myocardial infarction by digital analysis of electrocardiograms. In Proceedings of the 1st Middle East Conference on Biomedical Engineering, Sharjah, UAE, 21–24 February 2011; pp. 454–457. [Google Scholar]
- Banerjee, S.; Mitra, M. Application of cross wavelet transform for ECG pattern analysis and classification. IEEE Trans. Instrum. Meas. 2014, 63, 326–333. [Google Scholar] [CrossRef]
- Sharma, L.N.; Tripathy, R.K.; Dandapat, S. Multiscale energy and eigenspace approach to detection and localization of myocardial infarction. IEEE Trans. Biomed. Eng. 2015, 62, 1827–1837. [Google Scholar] [CrossRef] [PubMed]
- Acharya, U.R.; Fujita, H.; Oh, S.L.; Hagiwara, Y.; Tan, J.H.; Adam, M. Application of deep convolutional neural network for automated detection of myocardial infarction using ECG signals. Inf. Sci. 2017, 415, 190–198. [Google Scholar] [CrossRef]
Figure 1.
The proposed method to diagnose the myocardial infarction (MI) patients.

Figure 2.
Plot of decomposed subband signals: (a) normal electrocardiogram (ECG) beat, (b) MI ECG beat.
Figure 2.
Plot of decomposed subband signals: (a) normal electrocardiogram (ECG) beat, (b) MI ECG beat.

Figure 3.
Plot of accuracy (%) versus r of SEnt with RF classifier.

Figure 4.
Plot of accuracy (%) versus level of decomposition with RF classifier.

Figure 5.
Plot of accuracies versus of RBF kernel.

Figure 6.
Plot of accuracies versus q of Morlet wavelet kernel.

Figure 7.
Plot of accuracy (%) versus number of features using LS-SVM with RBF kernel.

Figure 8.
Plot of accuracy (%) versus number of features using LS-SVM with Morlet wavelet kernel.


Table 1.
Mathematical expressions for filters and perfect reconstruction condition of flexible analytic wavelet transform (FAWT).
Table 1.
Mathematical expressions for filters and perfect reconstruction condition of flexible analytic wavelet transform (FAWT).
| Filters and Parameters | Mathematical Expressions |
|---|---|
| Used in FAWT | |
| Low pass filter [20] | |
| where, | |
| High pass filter [20] | |
| where, | |
| , | |
| Condition for perfect reconstruction [20] | |
| where, | |
| = |
Table 2.
Different kernel functions and their mathematical expressions.
| Kernel Functions | Mathematical Expressions |
|---|---|
| Linear [26] | |
| Polynomial [26] | |
| Radial basis function (RBF) [46] | |
| Morlet wavelet [47,48] |
Table 3.
Classification accuracies computed using random forest (RF) classifier for different values of m and using Sample entropy (SEnt) with .
Table 3.
Classification accuracies computed using random forest (RF) classifier for different values of m and using Sample entropy (SEnt) with .
| m⟶ | 2 | 3 | 4 | 5 |
|---|---|---|---|---|
| ↓ | ||||
| 1 | 87.716% | 89.353% | 89.353% | 89.629% |
| 2 | 88.92% | 89.128% | 89.32% | 89.075% |
| 3 | 89.126% | 88.84% | 88.739% | 88.84% |
Table 4.
Classification accuracy (%) of least-squares support vector machine (LS-SVM) for different kernel functions.
Table 4.
Classification accuracy (%) of least-squares support vector machine (LS-SVM) for different kernel functions.
| Kernel Function | Parameters | Accuracy (%) | Sensitivity (%) | Specificity (%) |
|---|---|---|---|---|
| Linear | 83.32 | 81.83 | 89.02 | |
| Polynomial | x = 2 | 96.30 | 96.01 | 97.43 |
| x = 3 | 96.74 | 96.44 | 97.92 | |
| RBF | = 2.2 | 99.31 | 99.62 | 98.12 |
| Morlet wavelet | q = 11, = 0.25 | 99.30 | 99.64 | 97.92 |
Table 5.
Mean (M), standard deviation () for normal and MI classes.
| Feature | Normal Class () | MI Class () |
|---|---|---|
| SEnt | ||
| SEnt | ||
| SEnt | ||
| SEnt | ||
| SEnt | ||
| SEnt | ||
| SEnt | ||
| SEnt | ||
| SEnt | ||
| SEnt | ||
| SEnt | ||
| SEnt | ||
| SEnt | ||
| SEnt | ||
| SEnt | ||
| SEnt | ||
| SEnt | ||
| SEnt | ||
| SEnt | ||
| SEnt | ||
| SEnt | ||
| SEnt | ||
| SEnt | ||
| SEnt | ||
| SEnt |
Table 6.
Classification accuracy (%) of LS-SVM with different kernel functions for balanced dataset.
Table 6.
Classification accuracy (%) of LS-SVM with different kernel functions for balanced dataset.
| Kernel Function | Parameters | Accuracy (%) | Sensitivity (%) | Specificity (%) |
|---|---|---|---|---|
| Linear | ||||
| Polynomial | x = 2 | |||
| x = 3 | ||||
| RBF | = 2.2 | |||
| Morlet wavelet | q = 11, = 0.25 |
Table 7.
Summary of automated diagnosis of MI using ECG.
| Author | Year | Dataset | Analyzing | Number | Classification | 10-Fold Cross | Classification |
|---|---|---|---|---|---|---|---|
| Method | of Leads | Method Used | Validation | Performance (%) | |||
| Arif et al. [56] | 2010 | PTB diagnostic | Time-domain | 12-lead | BPNN | No | Sensitivity = 97.5 |
| ECG dtabase | method | ||||||
| Al-Kindi et al. [57] | 2011 | PTB diagnostic | Time-domain | 12-lead | - | No | Sensitivity = 85 |
| ECG dtabase | method | ||||||
| Banerjee et al. [58] | 2014 | PTB diagnostic | XWT based | 3-lead | Threshold based | No | Accuracy = 97.6 |
| ECG dtabase | method | classifier | |||||
| Liu et al. [5] | 2015 | PTB diagnostic | ECG polynomial | 12-lead | J48 | No | Accuracy = 94.4 |
| ECG dtabase | fitting | decision tree | |||||
| Sharma et al. [59] | 2015 | PTB diagnostic | MEES based | 12-lead | SVM with | No | Accuracy = 96.15 |
| ECG dtabase | method | RBF kernel | |||||
| Acharya et al. [3] | 2016 | PTB diagnostic | DWT, Nonlinear | One lead | k-NN | Yes | Accuracy = 98.8 |
| ECG dtabase | features | (lead-11) | |||||
| Acharya et al. [60] | 2017 | PTB diagnostic | No feature extraction | One lead | CNN | Yes | Accuracy = 95.22 |
| ECG dtabase | and selection | (lead-2) | |||||
| Present method | PTB diagnostic | FAWT and | One lead | LS-SVM | Yes | Accuracy = 99.31 | |
| ECG dtabase | SEnt | (lead-2) |
© 2017 by the authors. Licensee MDPI, Basel, Switzerland. This article is an open access article distributed under the terms and conditions of the Creative Commons Attribution (CC BY) license (http://creativecommons.org/licenses/by/4.0/).
Share and Cite
MDPI and ACS Style
Kumar, M.; Pachori, R.B.; Acharya, U.R. Automated Diagnosis of Myocardial Infarction ECG Signals Using Sample Entropy in Flexible Analytic Wavelet Transform Framework. Entropy 2017, 19, 488. https://doi.org/10.3390/e19090488
AMA Style
Kumar M, Pachori RB, Acharya UR. Automated Diagnosis of Myocardial Infarction ECG Signals Using Sample Entropy in Flexible Analytic Wavelet Transform Framework. Entropy. 2017; 19(9):488. https://doi.org/10.3390/e19090488
Chicago/Turabian StyleKumar, Mohit, Ram Bilas Pachori, and U. Rajendra Acharya. 2017. "Automated Diagnosis of Myocardial Infarction ECG Signals Using Sample Entropy in Flexible Analytic Wavelet Transform Framework" Entropy 19, no. 9: 488. https://doi.org/10.3390/e19090488
Note that from the first issue of 2016, this journal uses article numbers instead of page numbers. See further details here.