Article

Design of a Proportional Resonant Controller with Resonant Harmonic Compensator and Fault Ride Trough Strategies for a Grid-Connected Photovoltaic System

1
School of Electrical Engineering, Pusan National University, San 30, ChangJeon 2 Dong, Pusandaehak-ro 63 beon-gil 2, Geumjeong-gu, Busan 46241, Korea
2
School of Electrical Engineering and Computer Science, National University of Sciences and Technology, Islamabad 44000, Pakistan
3
Department of Engineering, Federal University of Santa Catarina Blumenau, Rua João Pessoa, 2750-89036-256, Brazil
*
Author to whom correspondence should be addressed.
Electronics 2018, 7(12), 451; https://doi.org/10.3390/electronics7120451
Submission received: 2 November 2018 / Revised: 9 December 2018 / Accepted: 14 December 2018 / Published: 19 December 2018
(This article belongs to the Special Issue Grid Connected Photovoltaic Systems)

Abstract

:
This paper presents the design and analysis of a proportional resonant controller with a resonant harmonic compensator and switch-type fault current limiter, as a fault-ride through strategy for a three-phase, grid-connected photovoltaic (PV) system under normal conditions and asymmetrical faults. The switch-type fault limiter comprised of current-limiting inductors, a bridge rectifier, a snubber capacitor, linear transformers, and energy absorption bypass. Furthermore, a critical and analytical comparison of switch-type fault limiters is carried out, with the conventional crowbar as the fault-ride through strategy, in combination with a conventionally tuned proportional integrator controller. The designed fault-ride through strategies with proportional integrator and proportional resonant controllers with resonant harmonic compensators are tested at the point of common coupling of the photovoltaic system and at a distance of 19 km from the point of common coupling, in order to analyze the impacts of fault parameter with respect to location. A MATLAB/Simulink model of a 100 kW three-phase grid-connected photovoltaic system is used for analysis. The simulation results of the proposed switch-type fault limiter with proportional resonant controller effectively validate the stable, ripple-free, and robust response compared to all other configurations. In addition, it is also verified that the grid faults on the PV system have a significant impact on fault type, and less impact on fault location.

1. Introduction

The exponential development in the concept of distributed energy resources (DERs), which allows the practice of small scale power sources and energy storage systems for low- to medium-level distribution voltages, is due to their economic, technical, reliability, and environmental advantages [1]. In recent years, the photovoltaic system (PVS) has been playing a key role in the global electric power sector among DERs [2], and is considered one of the most advanced forms of renewable energy (RE) because of its flexibility from low-level (residential) to high-level (commercial) loads [3].
The world is tending towards DERs like the PVS, due the depletion of fossil fuels for conventional energy sources [4]. The reduction in greenhouse gas emissions is possible by adopting RE resources, i.e., PVS, wind energy, hydel energy, etc. Due to the non-linear nature of sunlight, the output of PVS is not constant, so power electronics-based devices, such as the direct current (DC)–DC boost converter and maximum power point tracker (MPPT), are employed to ensure smooth and stable wave forms of photovoltaic (PV) parameters and inverters to convert the DC output of a PVS to AC for the injection of power into the grid. Usually, inverters used in a PVS are voltage source inverters (VSI) because of their simplicity, stability, fast response, and having both control loops, i.e., for voltage and current.
So long as PVSs become more reliable and advanced, the price curve declines, as noted in recent decades. A PVS approaches very rapidly to deliver power to grids, so disconnection of PV system for a long time is unsuitable, because the reliability, stability, and power system operation can be affected severely. Therefore, grid code requirements are modified by many countries to inject PV power to the grid [5,6,7,8]. The implementation of these requirements ensures the reconnection of a PV plant in a minimum time after voltage sag and the restoration of utility grid voltage that usually falls during grid faults [9,10]. This phenomenon is called the low-voltage ride-through (LVRT) or fault-ride through (FRT) capability of the grid, as presented by Energy On (E. ON) a German energy company and CEI (Comitato Elettrotecnico Italiano) [6,10]. A voltage limit curve has been defined by E. ON during abnormal conditions at the point of common coupling (PCC) of category 2 power generating plants [6]. To achieve grid stability under abnormal conditions, a reactive power injection is required to hold grid voltages, even for a low-voltage grid [11,12]. The DERs must inject an extra-reactive component of current for the sake of grid support, which is 2% of the nominal current for each 1% sag of voltage [13]. However, this leads to 100% reactive current when the voltage sag reaches 50% or above the rated voltage.
The extensive swing of unbalanced voltage of the grid can severely affect the role of a grid-connected inverter and PV module, due to the high current harmonics and power ripples. Various FRT strategies have been proposed to maintain the LVRT capability of PVS above the E. ON curve to handle this problem [14,15,16,17,18,19,20,21,22]. Some FRT strategies have improved the power quality considerably, such as minimizing ripples but compromising at high currents, and vice versa [14,15]. According to [16,17], active and reactive control were proposed instantaneously, which combined give a non-sinusoidal output wave form of currents during asymmetrical faults. A positive and negative sequence balancing components control is proposed using inverter power [18]. Nevertheless, there is still the problem of oscillatory harmonics with reactive and active components injection. However, most of the studies illustrated above have a proportional integral (PI) controller to control the grid-connected inverter and crowbar-based circuit and meet the LVRT capability for a grid-connected PVS.
Although PI control is simple and has many applications on the industrial level, it has some limitations because of its sensitivity towards parametric variables and non-linear behavior in a dynamic environment. Until now, the proposed crowbar circuit is generally used to protect the inverter from overcurrents, but it violates the utility to resume normal operation and grid connection requirements [21]. To overcome above stated issues, we are proposing a novel proportional resonant controller, with a resonant harmonic compensator and switch-type fault current limiter (STFCL) as an FRT strategy for grid connected PVS under normal conditions and asymmetrical faults. The contributions of the paper are listed below:
  • Design and simulation analysis of the grid-connected PVS is carried out—i.e., the PV side, grid side parameters, and DC link voltage are optimized to the acceptable limits, not only at the PCC, but also at a 19 km distance from the PCC.
  • A novel switch-type fault–current limiter (STFCL) topology is implemented to improve the LVRT capability of the PVS.
  • A detailed and precise comparison of the conventional crowbar strategy with STFCL topology is performed.
  • Proportional resonant (PR) with resonant harmonic compensator (RHC) is designed and compared with previously practiced PI controllers.
  • Asymmetrical faults are applied for 150 ms to verify the fault-tolerant capability of the proposed PR with RHC along with the STFCL, in to compare to the conventional PI and crowbar strategy.
  • Performance evaluation analysis is performed to verify the stability of the proposed controller and strategy i.e., integral absolute error (IAE), integral-square error (ISE), and integral of time-weighted absolute error (ITAE).
The remaining of the paper is organized as follows: Section 2 discuss the mathematical modeling of a PV cell, modeling of DC–DC boost converter, modeling of an inverter, a proposed model and design of a controller, and an FRT strategy. Results and discussion are carried out in Section 3, and the paper conclusion is in Section 4.

2. Mathematical Modeling

The mathematical modeling of important equivalent circuitries included in proposed model are described as below.

2.1. Mathematical Modeling of a Photovoltaic Cell

A solar PV cell is essentially a semiconducting p–n junction, that becomes forward-biased when exposed to light. The unidirectional current generated from a solar cell is linearly dependent on the solar irradiance. An equivalent circuit of the ideal PV cell is presented in Figure 1. Practically no solar cell is ideal, which is why a parallel resistance ( R s h ) of high value and a series resistance ( R s e ) of small value are added to the model.
By applying Kirchhoff’s current law, we have
I c = I p h ( I d + I s h )
I C = I p h [ I s a t · { exp ( V + I c · R s e V T ) 1 } + { V + I c · R s e R s h } ]
where I c is the output current (A) of the cell; I s a t is the diode reverse saturation current (A) of 5.25 × e 9 ; I p h is the insulation current (5.96 A); R s e   is 0.083 ohm ;   R s h   is 819 ohms; and V T is the thermal voltage, which is given by
V T = K T q Q d N s h N s e r
here, K is the Boltzmann constant, 1.38 × 10⁻²³ (j/k) ,   T is the absolute temperature of the junction (25 °C), Q d is the diode quality factor (1.25), q is the electron charge (1.6 × 10⁻¹⁹ C) ,   N s h represents the number of parallel strings (66), and N s e r is the number of series-connected modules per string (5).

2.2. Mathematical Modeling of a DC-DC Boost Converter

Mostly, the two topologies of maximum power point tracking (MPPT) have been studied throughout the world for grid-connected PV plants, i.e., one-stage and two-stage PVSs. However, in the proposed system, two-stage topology is employed, because when the PV voltage is low the boost converter will boost it for the use of an inverter, and the cost is reduced. Figure 2 illustrates the DC–DC boost converter circuit having input voltage Vin, switch SW, boost inductor L, diode D, filtering capacitor C, and resistive load R. A capacitor is used between the PVS and the DC–DC circuit to minimize harmonics in frequency (CPV) which is given in Equation (4) [23].
C P V = D V P V 4 Δ V P V   f s w 2   L b o o s t
where D is the duty cycle of the boost converter, VPV is the PV array output voltage (273 V), f s w is the switching frequency of boost converter (5 kHz), and L b o o s t is the boost inductor (5 Mh).
To calculate the value of boost inductor [24],
L b o o s t = V i n · ( V o u t V i n ) Δ I L · f s w · V o u t
here,
Δ I L = I o u t V o u t V i n
where V i n is the input voltage for the boost converter, which is the output of the PV array (273 V), and V o u t is the output voltage of boost converter (500 V). To calculate the value of the boost inductor [24],
L b o o s t = V i n · ( V o u t V i n ) Δ I L · f s w · V o u t
here,
Δ I L = I o u t V o u t V i n
the duty cycle from the voltage balance equation is
D = 1 V P V V d c   L i n k
the duty cycle of the boost converter is controlled to track the maximum power point of PVS.

2.3. Modeling of the Inverter

Two types of inverters are used widely, i.e., current source inverters (CSI) and voltage source inverters (VSI), for the conversion of DC to alternating current (AC) sources. VSI type 3 phase grid-connected inverters are normally used, because the loads require a constant voltage supply. This phase inverter can be modeled in MATLAB/Simulink (R2014a, Pierre Giroux, MATLAB detailed model) using six Insulated Gate Bipolar IGBT switches [25].
The most essential part, rather than obtaining maximum power from the PVS, is the control of the inverter. The control structure of an inverter is responsible for taking care of grid synchronization, power flow management, and pulse width modulation (PWM) of the inverter. In designing the proposed model, synchronous reference frame is used for control. Equations (10) and (11) are used to transform voltage and current to a dq reference frame from a natural frame for simplification.
[ v d v q ] = 2 3 [ sin ω τ sin ( ω τ 2 π 3 ) sin ( ω τ + 2 π 3 ) cos ω τ cos ( ω τ 2 π 3 ) cos ( ω τ + 2 π 3 ) ]
[ i d i q ] = 2 3 [ sin ω τ sin ( ω τ 2 π 3 ) sin ( ω τ + 2 π 3 ) cos ω τ cos ( ω τ 2 π 3 ) cos ( ω τ + 2 π 3 ) ]
The desired voltages obtained from the current controller are then used to generate gate pulse signals for the inverter, using sine PWM. The desired voltage wave forms are compared with a triangular carrier wave of 30 kHz, and transformed back to a natural frame using reverse matrix calculations.

2.4. Proposed System

This section provides comprehensive details about the proposed model of 100 kW grid-connected PVS simulated from SimPower examples of MATLAB/Simulink. The three-phase PV array with a capacity of 100 kW delivers power to a 110-kV utility grid through a 20 kV distribution unit followed by a DC–DC converter and a three-phase, three-level voltage source inverter (VSC), as shown in Figure 3. The cell temperature in Celsius (C) and sun irradiance in watts per meter squared (W/m2) are the inputs for the PV array. The system PV array includes 330 SunPower SPR-305-WHT (manufactured by Sun Power, San Jose, CA, USA) modules, which consists of 66 strings of five parallel series-connected modules [26]. Additionally, the nominal parameters of the model are elaborated in Table A1 of Appendix A.
The PV array maximum voltage of 273 V is boosted to 500 V through a 5 kHz DC–DC converter, and maximum power point tracking is carried out in a DC–DC boost converter through an incremental conductance methodology [27]. Through such a type of MPPT control switching, the duty cycle automatically varies to extract the required voltage.
A three-level VSC alters the DC link voltage to 260 V AC, with a switching frequency of approximately 2 kHz. The control structure of the three-level VSC is responsible for managing DC link voltage for interconnection with the grid, which has a dual control loop. The internal control loop is responsible for regulation of reactive (Iq) and real components (Id) of grid currents, whereas the Iq reference is set to zero to keep the unity power factor; however, the external loop is used to regulate DC link voltage from two split capacitors to +/−250 V. The DC-link voltage is set to 500 V, as reference. The current controller output in the dq frame is converted to three modulating signals, U_(abc_ref), which are then used by the PWM generator.
Two different controllers, i.e., PI and PR with RHC, are employed and simulated for controlling dq reference frame quantities. The grid-connected PVS parameters, such as voltage sag, limiting of current, power, etc., are optimized by implementing two different FRT strategies i.e., crowbar and STFCL. The asymmetrical grid faults are simulated and analyzed at two different locations, at PCC of PVS and at 19 km away from PCC, i.e., at the other side of PVS, as shown by Figure 3.

2.5. Design of Controller and Fault-Ride Through Strategy

Various control schemes and FRT strategies have been designed to protect the PVS, due to the diverse nature of grid-connected inverter topologies. These control schemes manage the DC link voltage, to be maintained at constant reference. However, the FRT strategies are employed to optimize the grid parameters, such as constant power, grid synchronization, improved power factor, and phase sequence under abnormal conditions. This paper proposes a control scheme (PR with RHC) and FRT strategy (STFCL), and its comparison with a conventional PI controller with the crowbar strategy.

2.5.1. Controller Design

To elaborate, the proposed control scheme for balancing the power of the VSC, a short overview is carried out below:
1. Proportional Integral (PI) Controller
The control block shown in Figure 4 demonstrates the measurement and comparison of DC-link voltage with a constant reference, using a synchronous reference based on a PI controller. A synchronous or dq frame is used by the PI controller, because they have better responses when operating at DC variables. By transforming towards a DC frame, the controlling parameters become DC, so their control and filtering become easier [28]. A new compensated current reference is produced by the outer voltage loop using the PI controller. The output of the outer loop is the Id reference current, and the Iq component is set to zero to maintain the unity power factor. The inner current loop generated voltage components (Vd, Vq) are used to give the reference of three modulating voltage waveforms that are used for PWM generation.
2. Proportional Resonant Controller with Harmonic Compensator
PR and PI controllers have much in common, but the PR has the upper hand due to the integration property. Static error and phase shift do not occur in PR controllers, due to the action of integration of frequency near resonance frequency. However, even with the use of high-order filters at the grid side, it is very difficult to achieve an optimized current wave without ripples during faulty conditions. Thus, for the purpose of improving current quality, harmonic compensators are employed with PR controllers at the current control loop, as depicted in Figure 5. Table A2 of Appendix A presents the values of the constant used for the controllers.
A PR controller comprises of two parts, i.e., the proportional and resonant parts, expressed by the equation below:
D G P R ( s ) = K p + K i ( S S 2 + ω 2 )
Here ω is a resonant frequency. Owing to the high gain at a narrow band at the resonant frequency, the PR controller has the ability to eliminate steady-state errors. K i is the time constant integral, which is related to band width, and K p is proportional gain, which determines the phase of band width and gain margin [29].
The harmonic compensator is parallelized with the PR controller to maintain the quality of the grid current [30,31]. Harmonic compensators can be mathematically expressed as
G H C ( s ) = h = 3 , 5 , 7 , G H C h   ( s )
here, G H C h ( s ) is the resonant controller with the h t h order, where h is the harmonic order. However, in particular
G H C h ( s ) = k i h   s s 2 + ( h ω ) 2
here k i h is the gain of particular order of resonant controller.

2.5.2. Fault-Ride Through (FRT) strategies

It is inevitable to say that “a power system can be designed as accurate that the occurrence of a fault is not possible”. Therefore, different FRT strategies have been introduced until now to overcome the amplitude of fault current and optimize voltage sag during fault conditions. The proposed paper presents the conventional crowbar strategy and a new STFCL strategy for grid-connected PVS, and a keen comparison is illustrated by the results.
1. Crowbar Strategy
The implemented crowbar strategy is shown in Figure 6, which is comprised of two-dimensional conditioned switches, one with a fault and other without fault; only one of these will be on, according to the condition of the fault detection algorithm. If any unbalance fault occurs, the fault current will follow the resistance included with fault switch path by activating its gate. The grid variables like current, voltage, and power are optimized through current limiting arrangement at an abnormal diversion. However, the power flow in a normal environment will follow its conventional path by trigging without fault switch.
2. Switch-Type Fault Current Limiters (STFCL)
Although, the STFCL strategy has been proposed for the enhancement of the LVRT capability of a doubly-fed induction generator (DFIG) [32]. However, for a grid-connected PVS, the STFCL strategy has not been investigated until now to improve the LVRT capability of PVS according to grid requirements. This paper proposes the STFCL as an FRT strategy to overcome fault currents free of ripples. The results authenticate that with STFCL voltage, current spikes are suppressed during occurrence and clearing fault time, under unbalanced voltage sag at both the grid side and PV side.
STFCL circuitry is comprised of fault current-limiting inductors ( L f ) and resistances ( R f ) for each phase, as well as a full-bridge rectifier, linear transformers, power electronic switches, a snubber capacitor ( C f ) to minimize voltage transients during switching, and a series branch of R a and C a in parallel with the snubber capacitor as a path for the absorption of fault energy, as shown in Figure 7. Moreover, FRT strategies (Crowbar and STFCL) constants are listed in Table A3 of Appendix A.
The switch (SW) is kept triggered during normal conditions, bypassing fault current limiting inductors and the resistance branch. Whenever any abnormality at the grid occurs, SW is turned off.

3. Results and Discussion

The fault-tolerant capability and effectiveness of the proposed strategy, i.e., STFCL with PR based on RHC, is carried out by analyzing and comparing it with conventional PI and crowbar FRT strategies. A three-phase PVS is subjected with asymmetrical faults that occur at PCC and 19 km from PCC. The faults at the grid are imposed for 150 ms, which are applied at 0.1 s. For better understanding, the fault of PI with FRT and PR with FRT is cleared at 0.3 s, to avoid congestion at the single point 0.25 s. The behavior and comparison of the proposed approach with conventional approaches are graphically discussed, and also analyzed through performance measures as noted below.

3.1. Single-Phase to Ground Fault

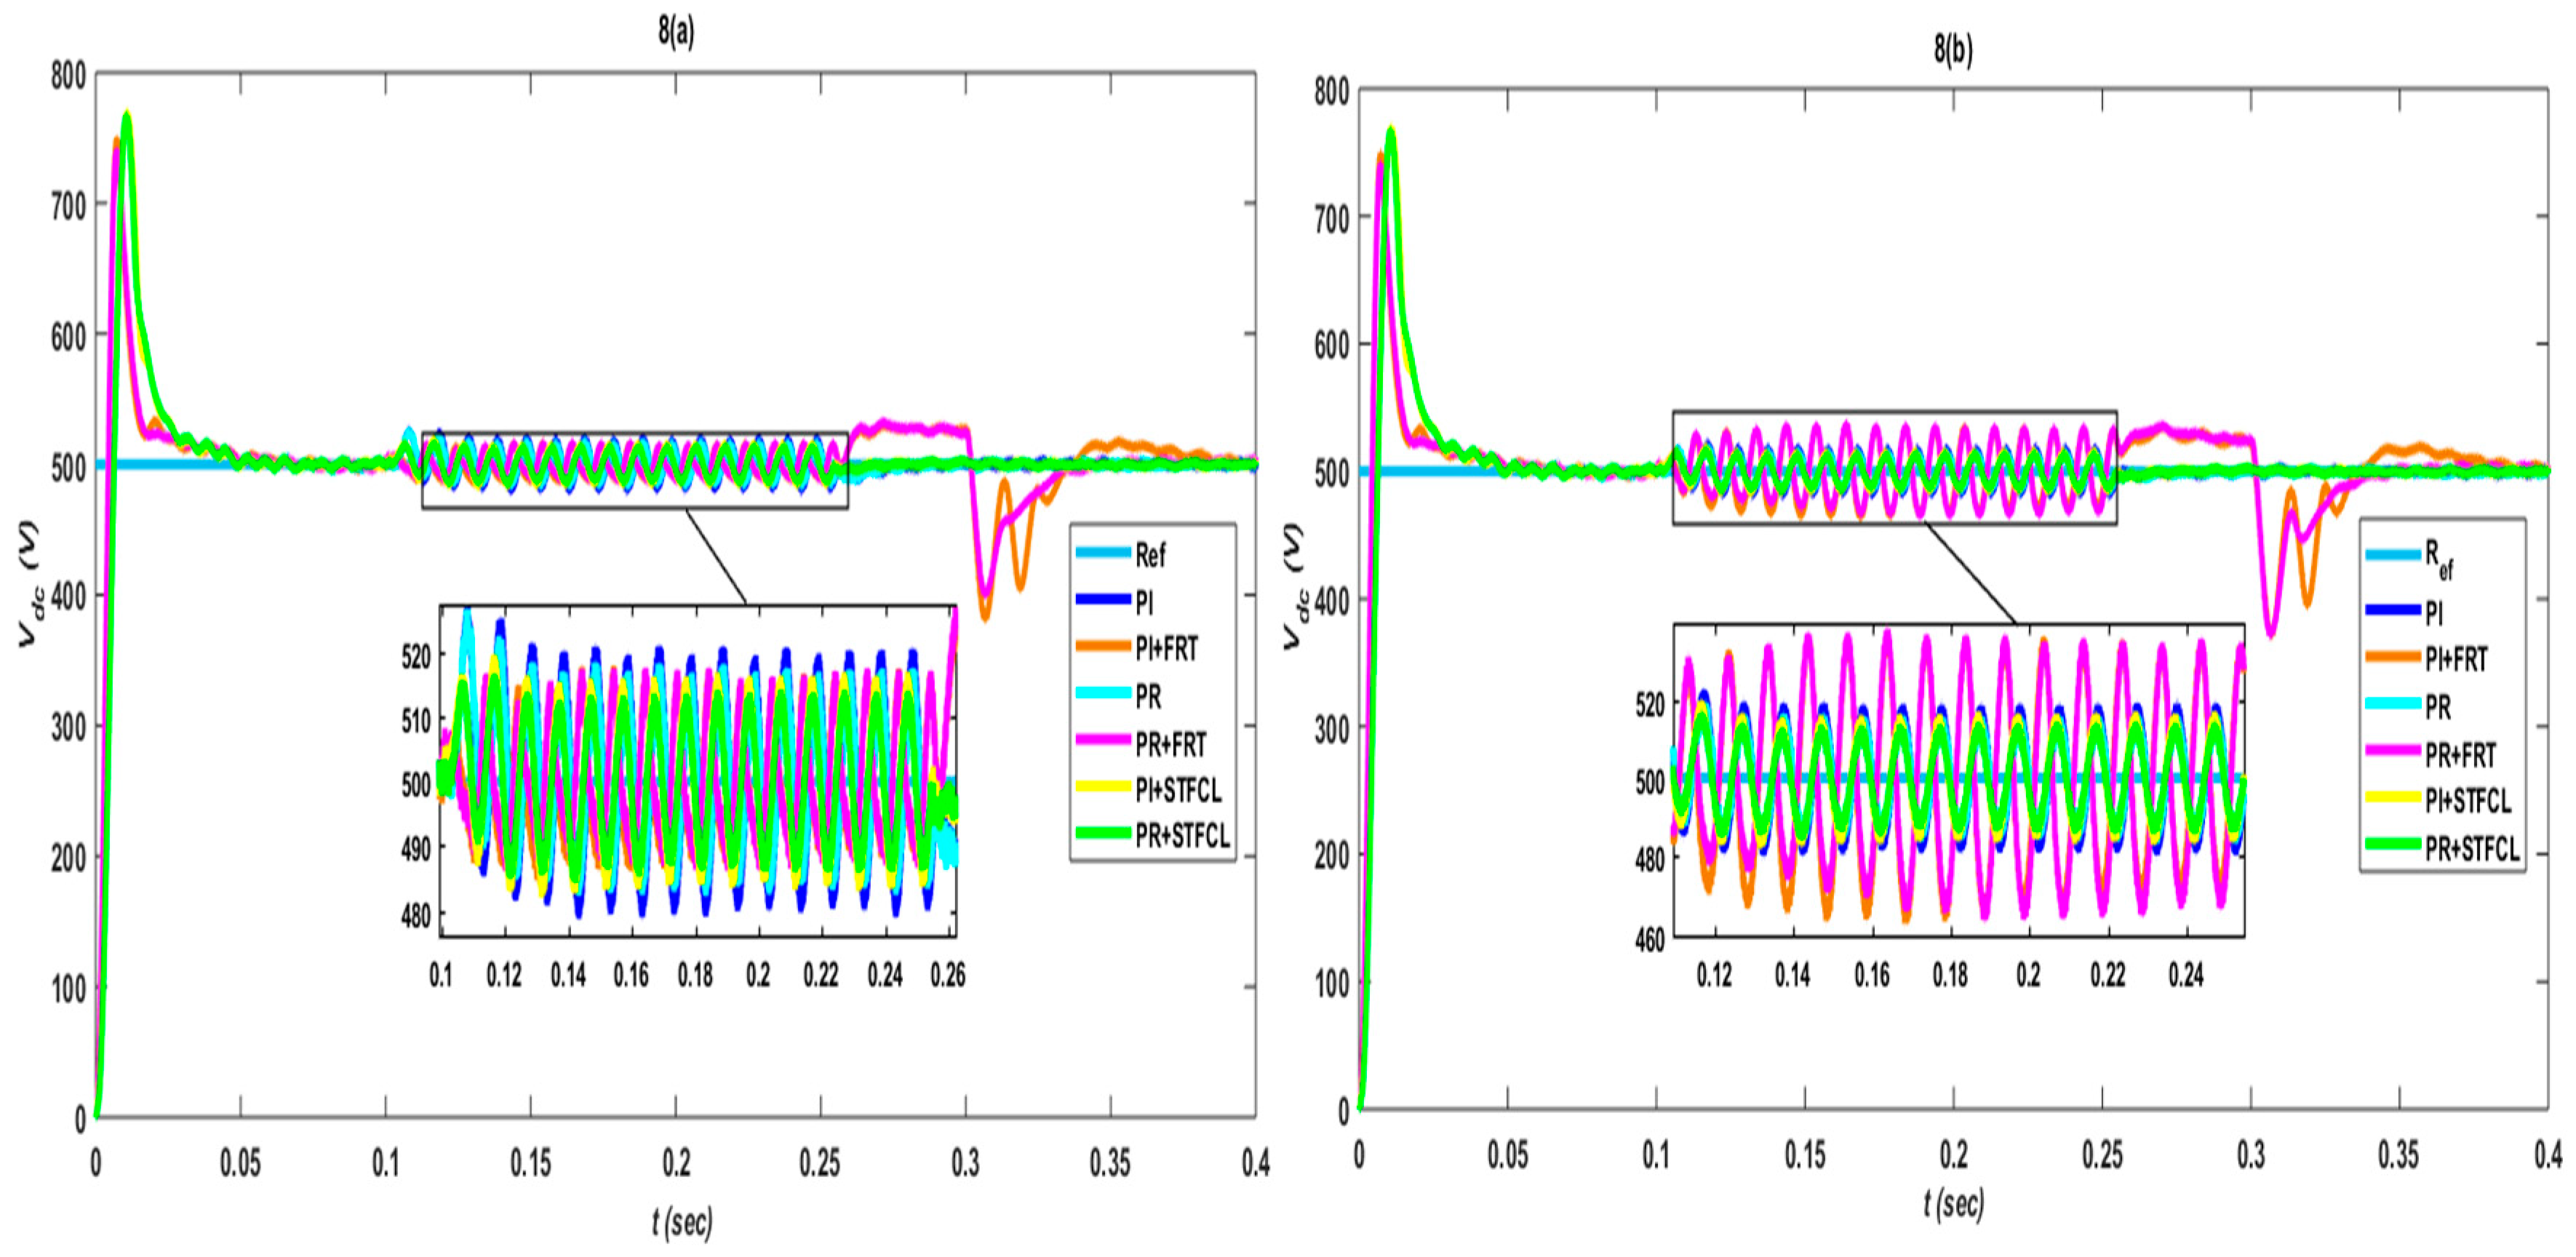
The single-phase to ground (S–G) fault is applied on the PCC and distribution line. The results of fault that occur at the PCC and distribution line are depicted in Figure 8a,b respectively. The figure shows the response of different control strategies and FRT schemes on DC link voltage. The response of PR and PR with STFCL is the same in pre-fault, during fault, and post-fault conditions. However, the response of a PR with FRT controller alone and PI with FRT shows the emergence of transients during fault clearance. The PCC fault shows little influence of DC link voltage. Only the control strategy without FRT can keep the DC link voltage at the reference value. Similarly, all the different control strategies and FRT schemes show the same response in the case of fault occurring in the distribution line. However, in this case the DC link voltage is subjected to oscillation with a larger amplitude, as compared to fault occurred at PCC. However, the proposed strategy of PR with STFCL is reluctant to fault. Hence, this reduces the amplitude of oscillation occurring in DC link voltage during fault, as shown in Figure 8b.
Performance evaluation of the proposed strategy with other configurations is carried out in Table 1 for DC link voltage (VDC). In the performance evaluation in Table 1, three control measures—i.e., integral absolute error (IAE), integral square error (ISE), and integral time-weighted absolute error (ITAE) are calculated for all cases, which gives a very precise and exact comparison between the different combinations of controllers and FRT strategies. The lower values of ITAE, ISE and IAE authenticate the higher efficiency. The PI + STFCL and PR + STFCL strategies give better performances when compared with PI + FRT and PR + FRT, as tabulated in Table 1 for VDC.
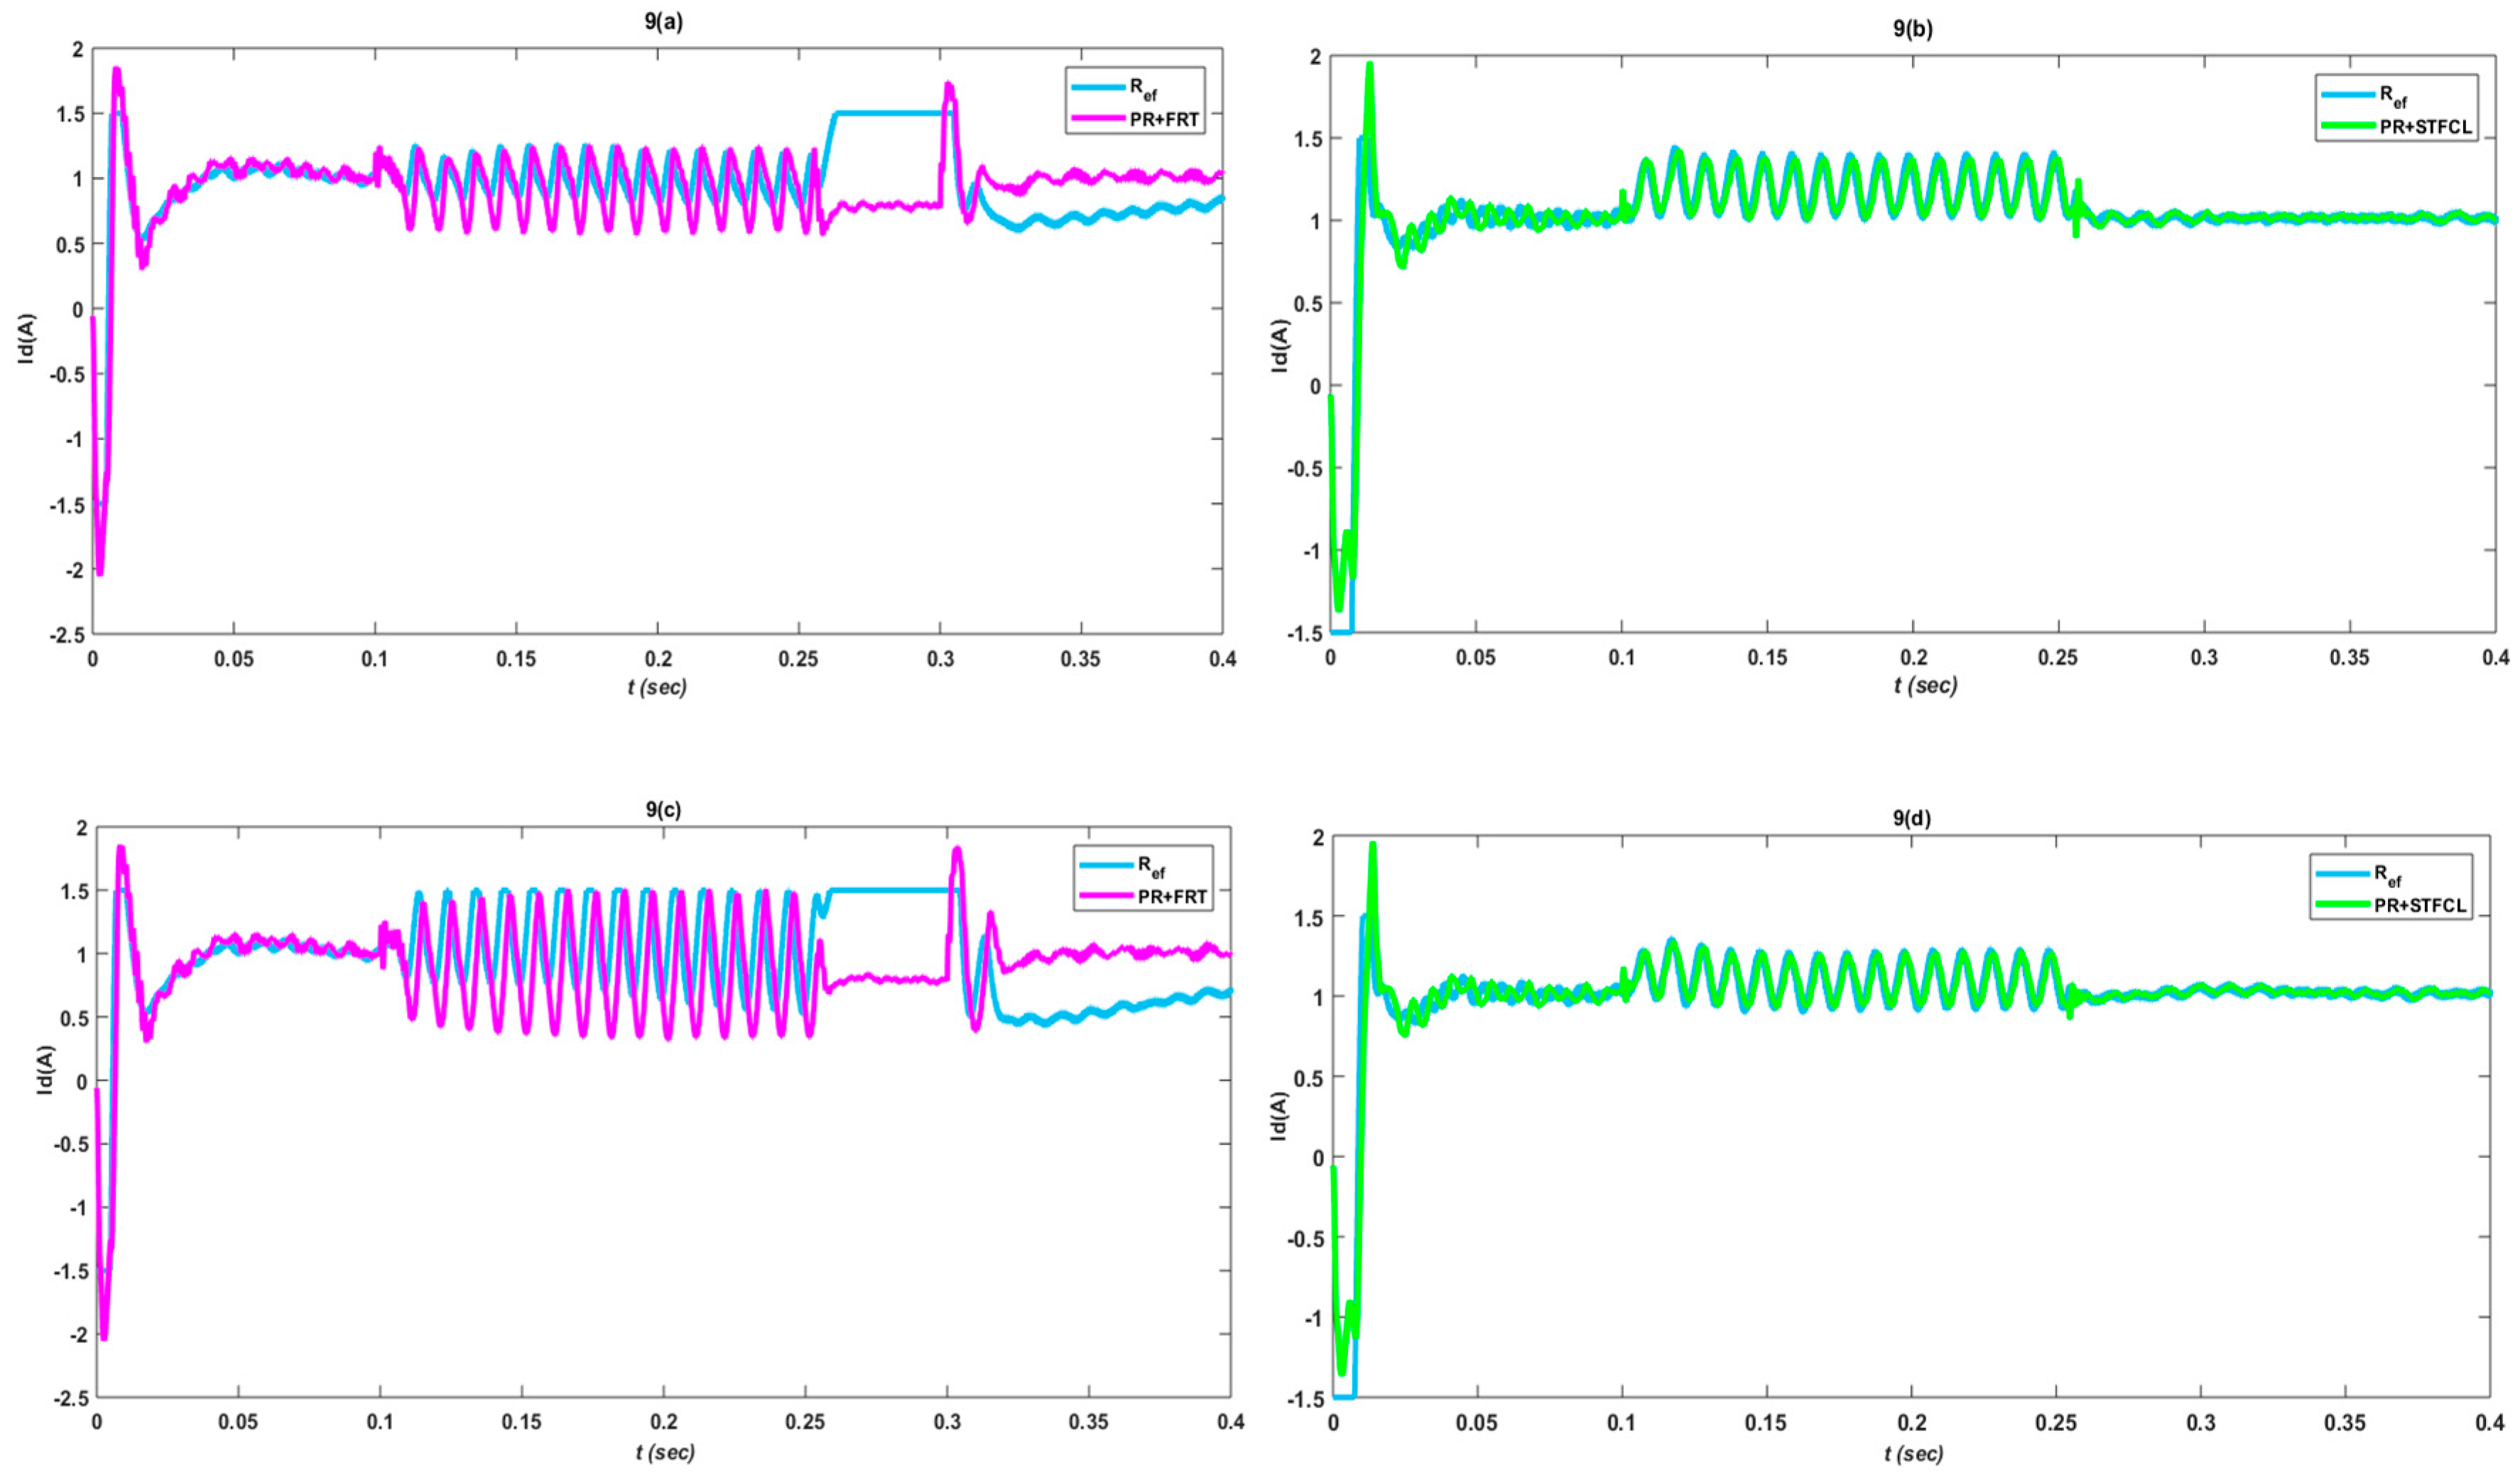
Figure 9a,b shows the simulated response for the PR with RHC controller, with FRT and STFCL schemes, respectively. These responses are presented for fault occurring at PCC. The response of the PR controller accompanied with an FRT scheme shows oscillation during fault, followed by current spike at fault clearance. However, the inductive effect of STFCL opposes the change in current, hence the response of the Id current results in low-amplitude oscillations. Similarly, Figure 9c,d shows the response of the d-axis current during the occurrence of fault at the distribution line. Figure 9c depicts the response of Id in the case of a PR controller with FRT, while Figure 9d shows the response of Id in the case of a PR controller with STFCL. Both the responses of Id currents are the same during fault, except the amplitude of oscillation. The STFCL has ability to dampen the oscillation, as compared to FRT. Hence, the oscillation occurring in the case of STFCL has a lower amplitude, comparatively. The reactive component
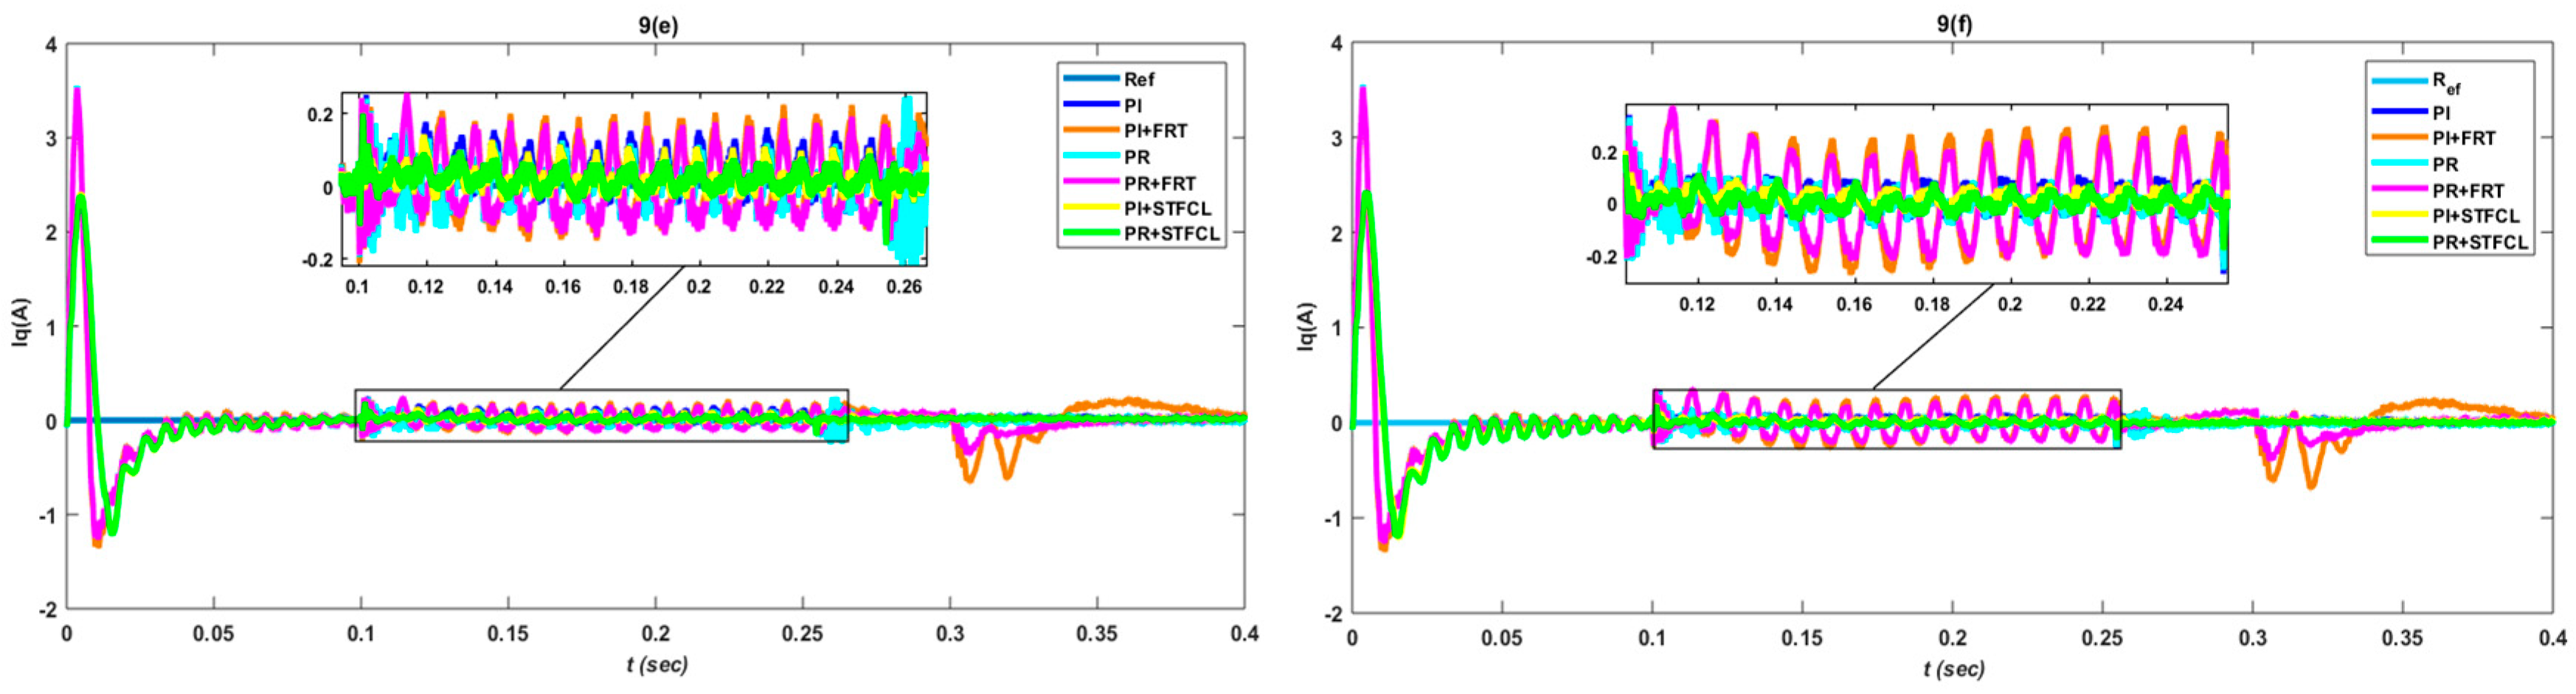
 Iq from Figure 9e at PCC results in smooth and spike-free responses with the proposed PR with RHC controller with STFCL strategy. However, the conventional FRT strategy with any of the controllers give spikes after fault clearance. The statement is same for faults at 19 km at the distribution line from PCC, as depicted in Figure 9f.
Performance evaluation of the proposed strategy with other configurations is carried out in Table 2 for the active component of the current (Id). Table 2 authenticates the better performance of the proposed strategy and controller for Id.
Moreover, performance evaluations for reactive current components for all possible configurations are depicted by Table 3. The PI with STFCL and PR with STFCL strategy gives better performances when compared with the PI with FRT and PR with FRT strategies, as tabulated in Table 3 for Iq.
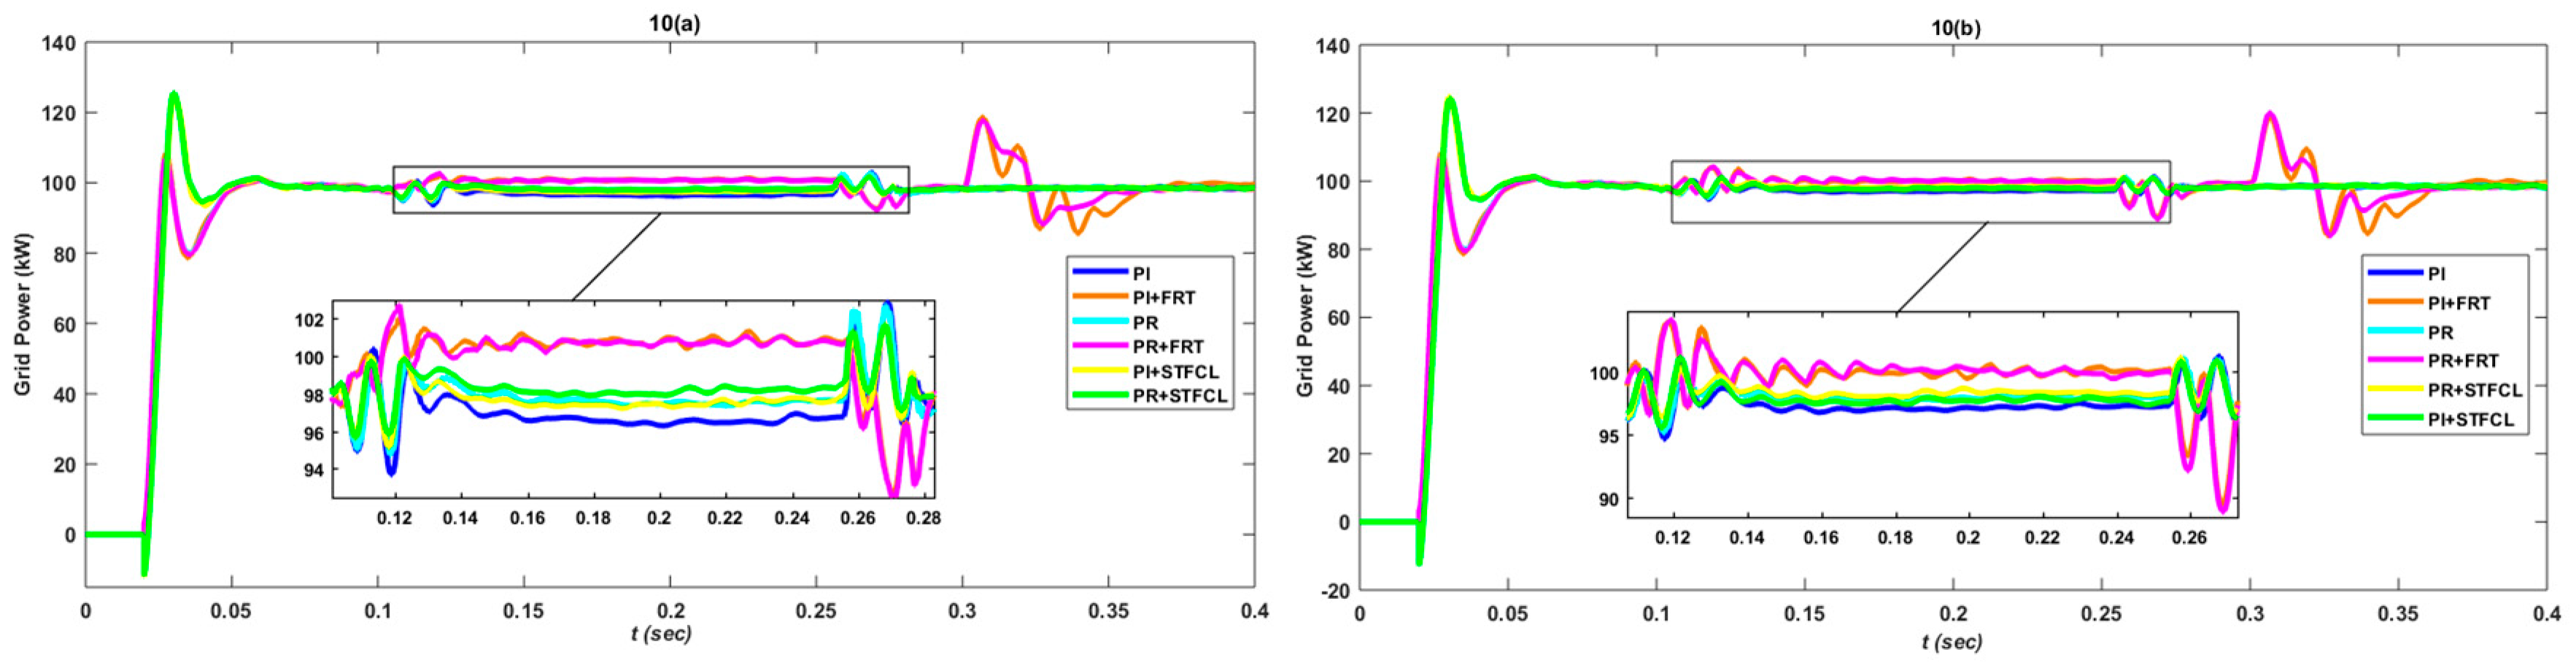
Figure 10 depicts grid power behavior during S–G fault, which shows a stable and oscillation-free power response with STFCL along with PR, except for minor oscillations at fault occurring and clearing time. However, with FRT strategies, any of the controllers have an increase in power response, with approximately 35% spikes after fault clearance for 0.05 s, as cleared from Figure 10a. So far, at a 19 km distance, the case is the same as for STFCL, but a little wavy for the crowbar, as compared to PCC shown by Figure 10b.
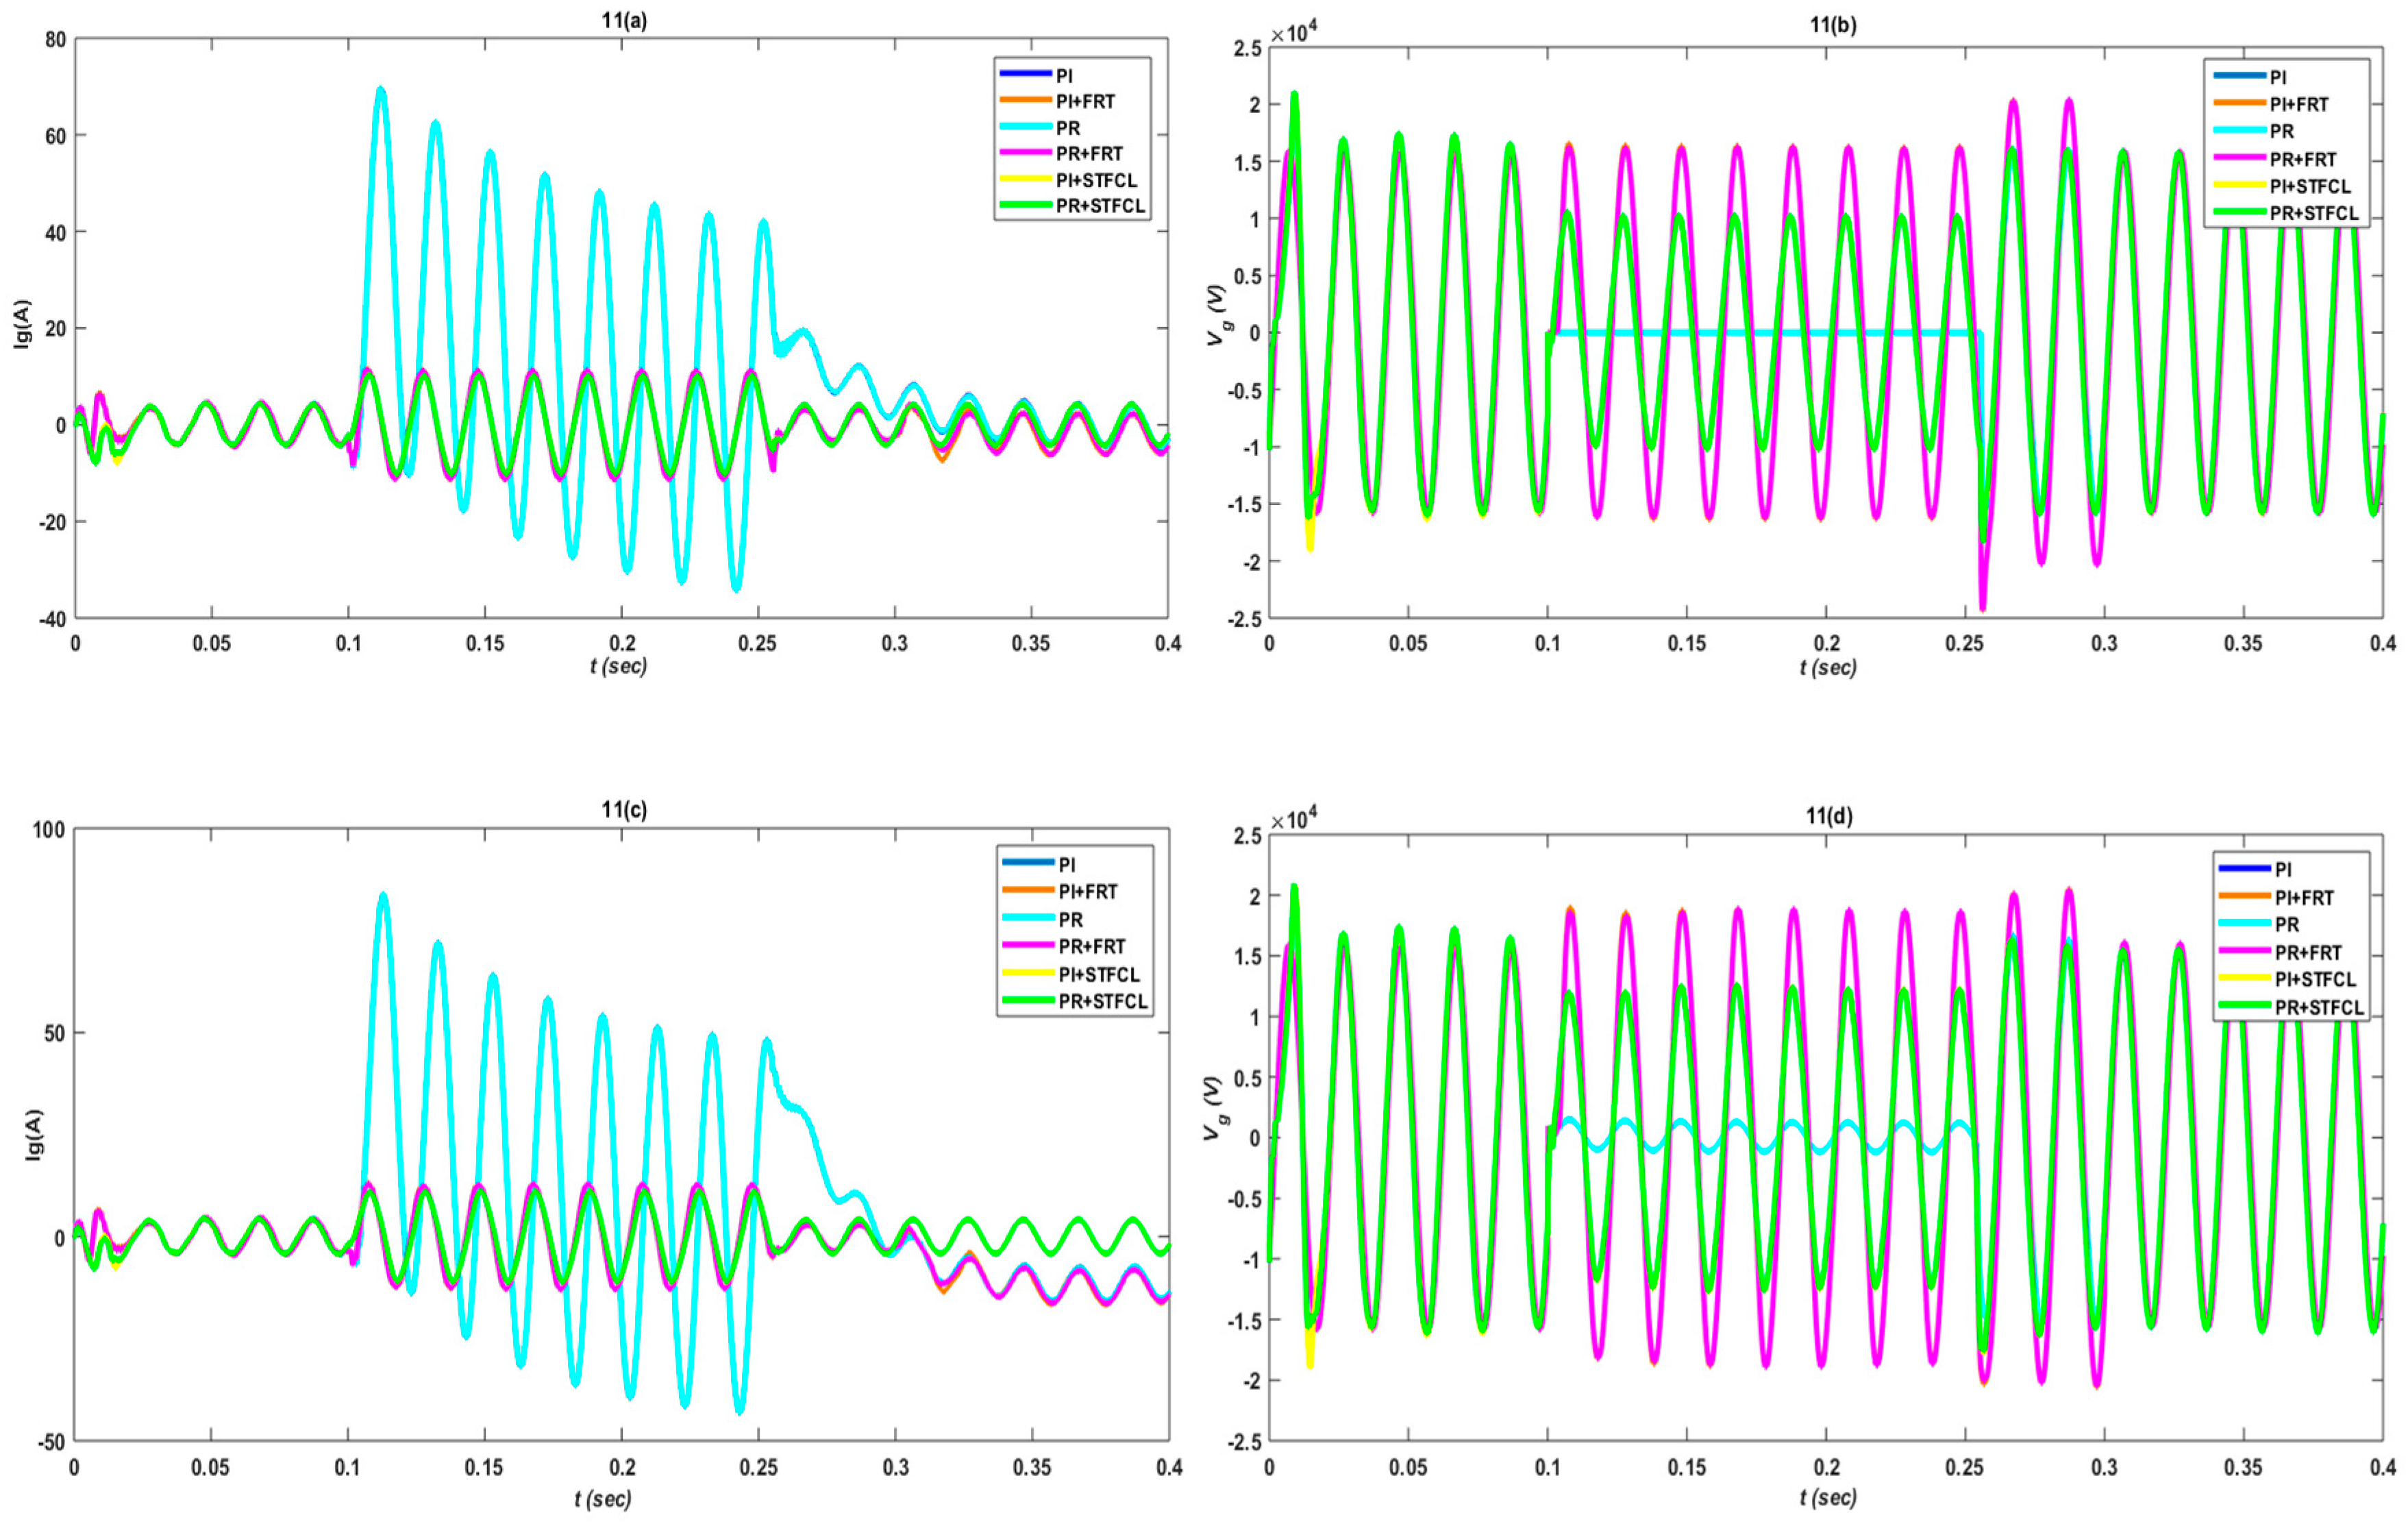
Figure 11 depicts the grid current and voltage for both configuration of controllers and FRT strategies. By simulation results, it was found that high fault currents are optimized to nominal values along and enhancing the voltage drop during fault. Where STFCL gives optimized and ripple-free behavior, the crowbar strategy gives spikes at the PCC, as shown by Figure 11a,b. Whereas for 19 km from the PCC, current wave form depletes from the reference after fault clearance, STFCL maintains its reference, as illustrated by Figure 11c. The grid voltage for 19 km gives some value instead of zero, as in the PCC, due to the line resistance shown by Figure 11d.
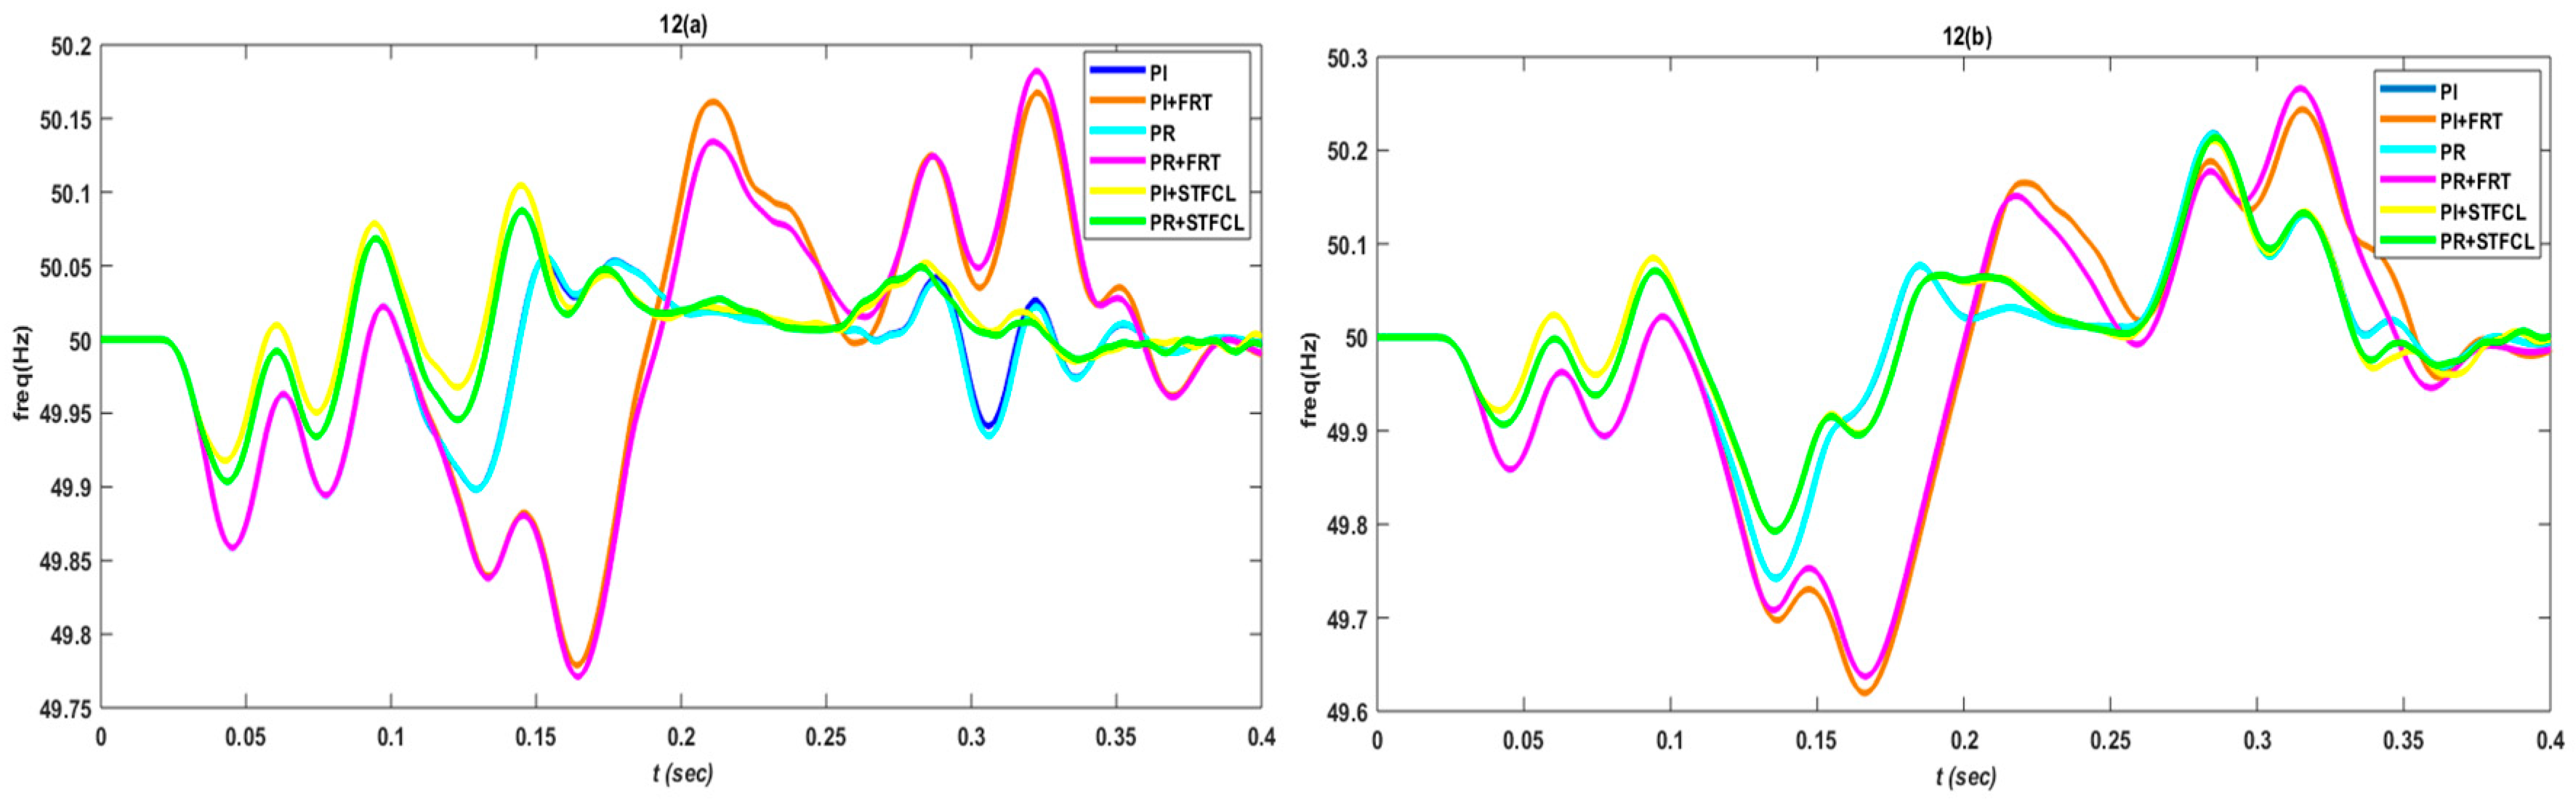
Figure 12 depicts the grid frequency response during S–G fault, which clearly shows that the oscillations in frequency account for approximately 0.4% of the rated frequency with crowbar as the FRT strategy throughout the fault time at the PCC. However, with STFCL along PR as a controller, the oscillations are limited to 0.2%, and only at fault entering time, as in Figure 12a. It is also depicted that STFCL responds well with PR, as compared to PI. Although at a distance of 19 km from PCC, these variations increase to approximately double, as in the PCC shown by Figure 12b.
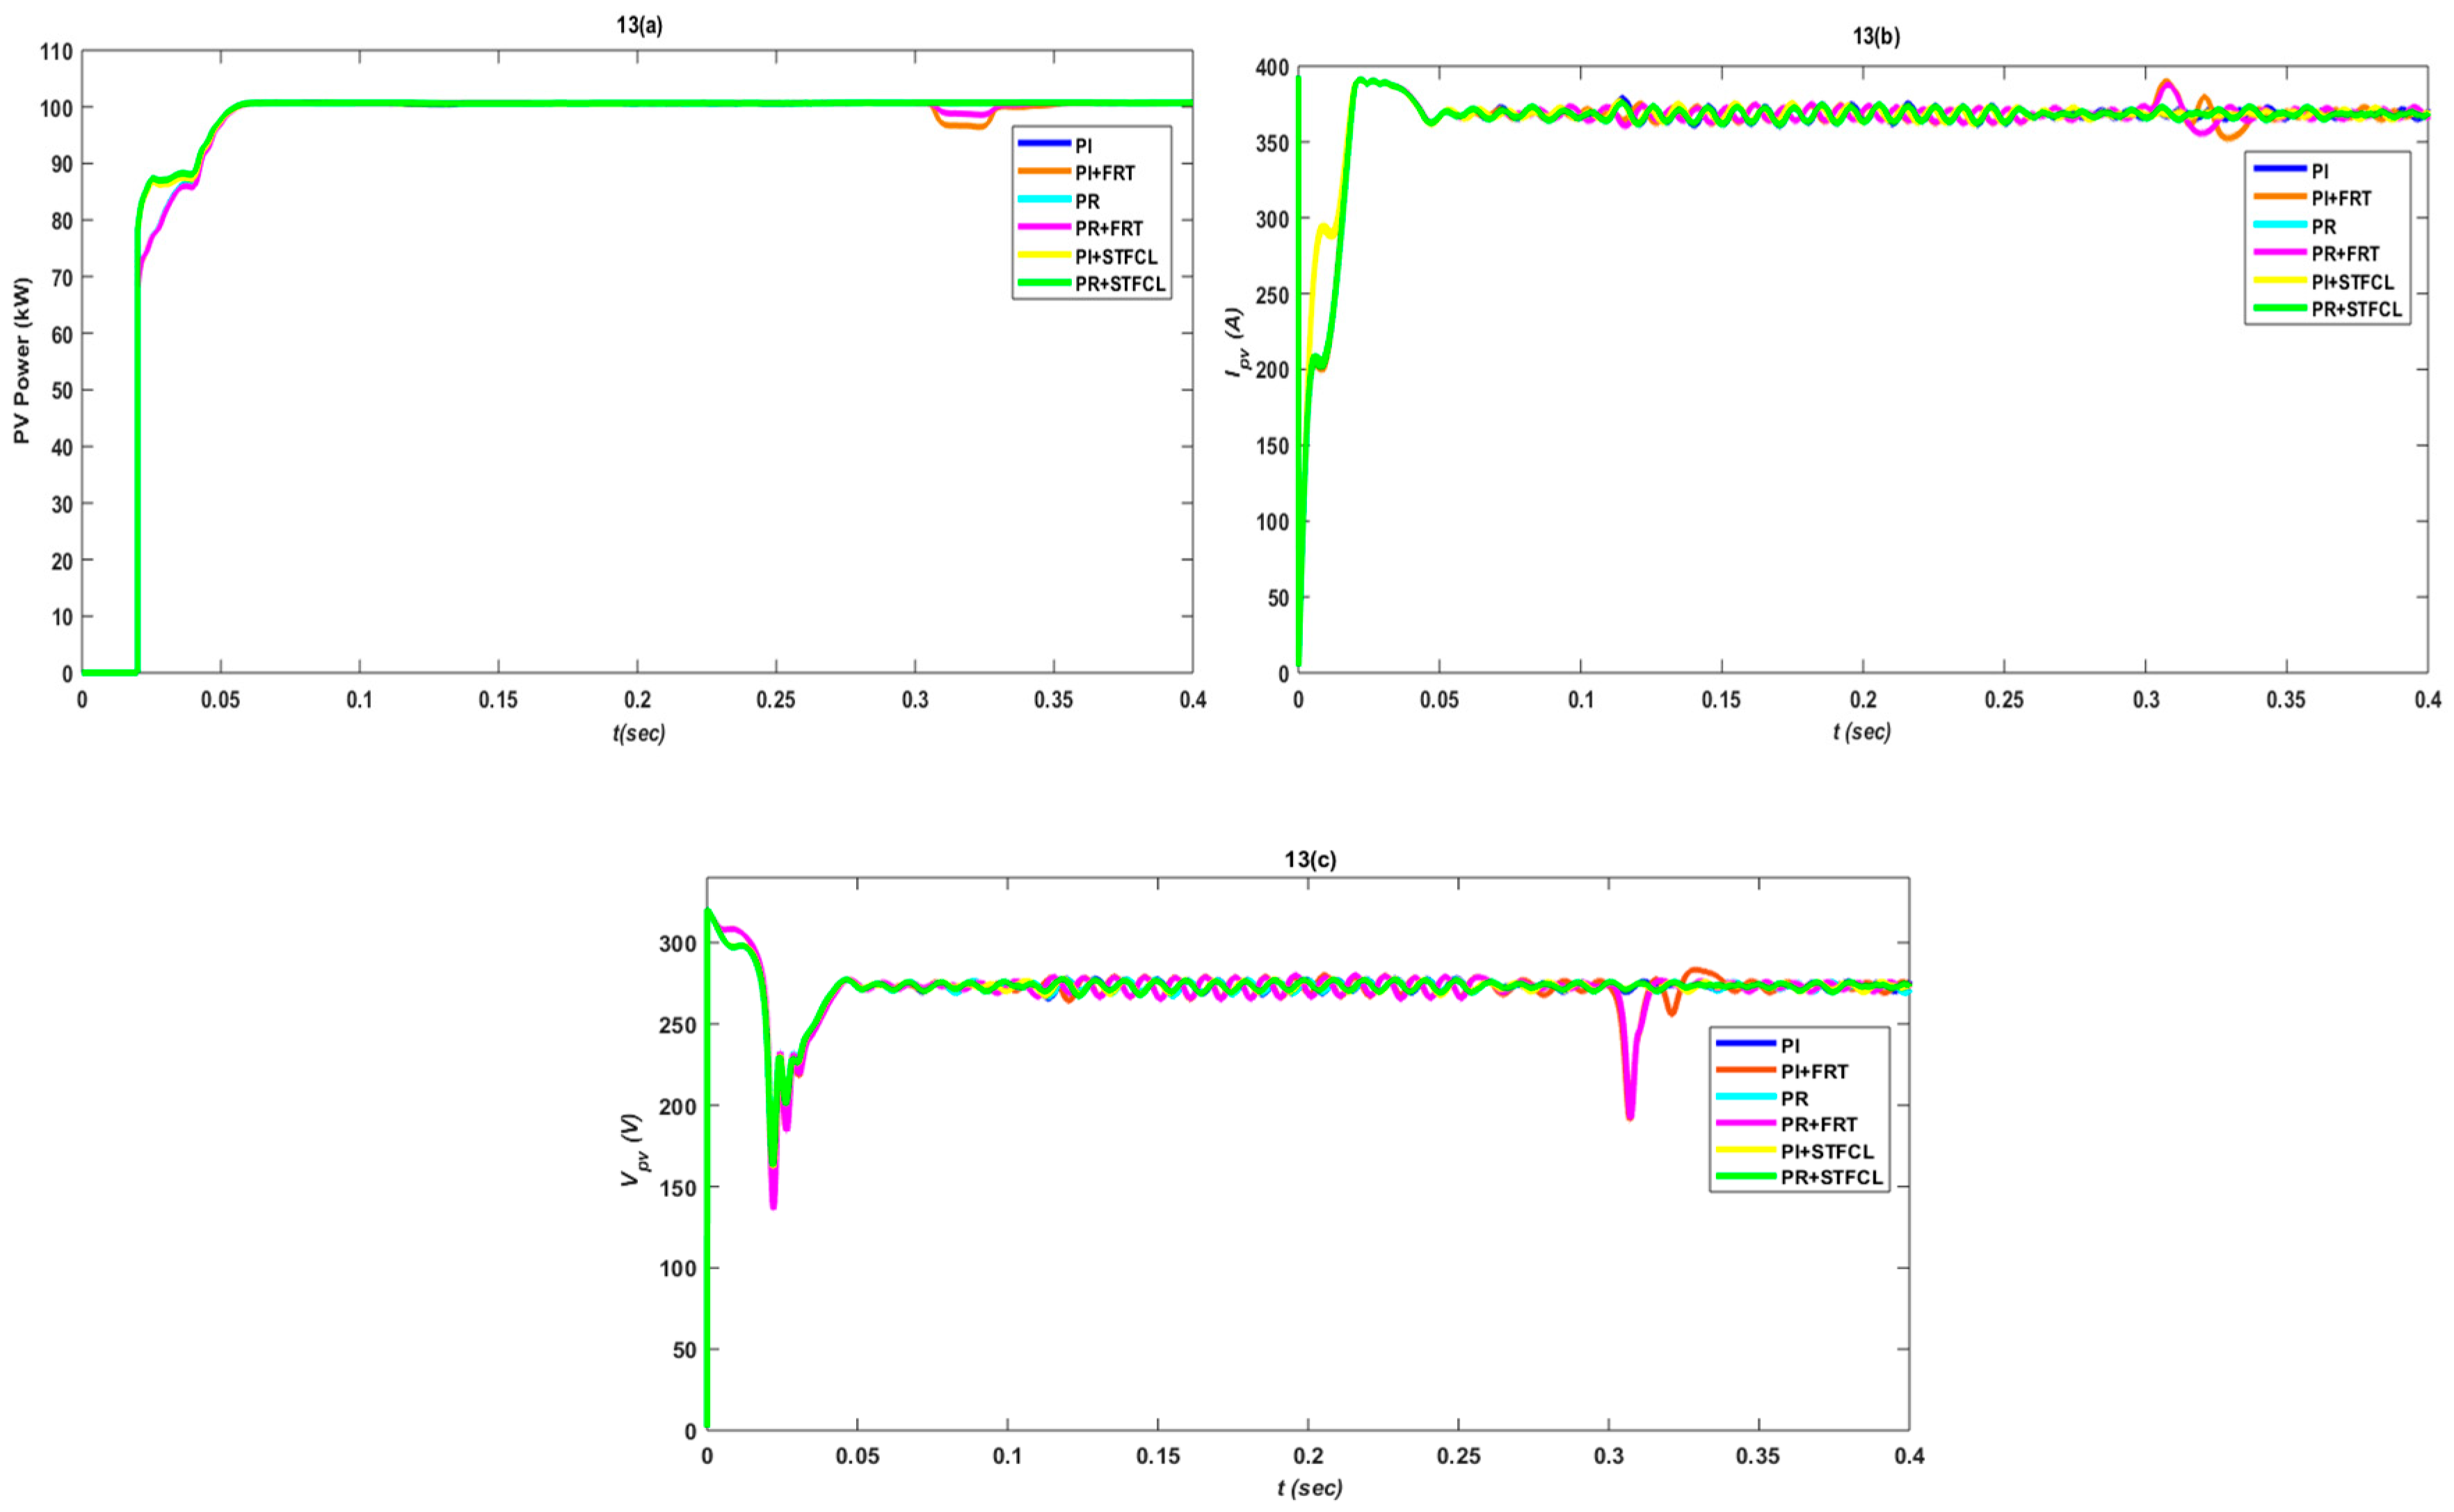
The impact of crowbar and STFCL strategies are illustrated by Figure 13 at the PV side, which clearly highlights the spikes for 0.05 s as fault clearing surges. The PV side parameter likes PV power, current, and voltage, for the STFCL strategy gives a smooth and transient-free response throughout operation at the PCC. The response is approximately same for 19 km distance as in PCC.

3.2. Phase-to-Phase Fault

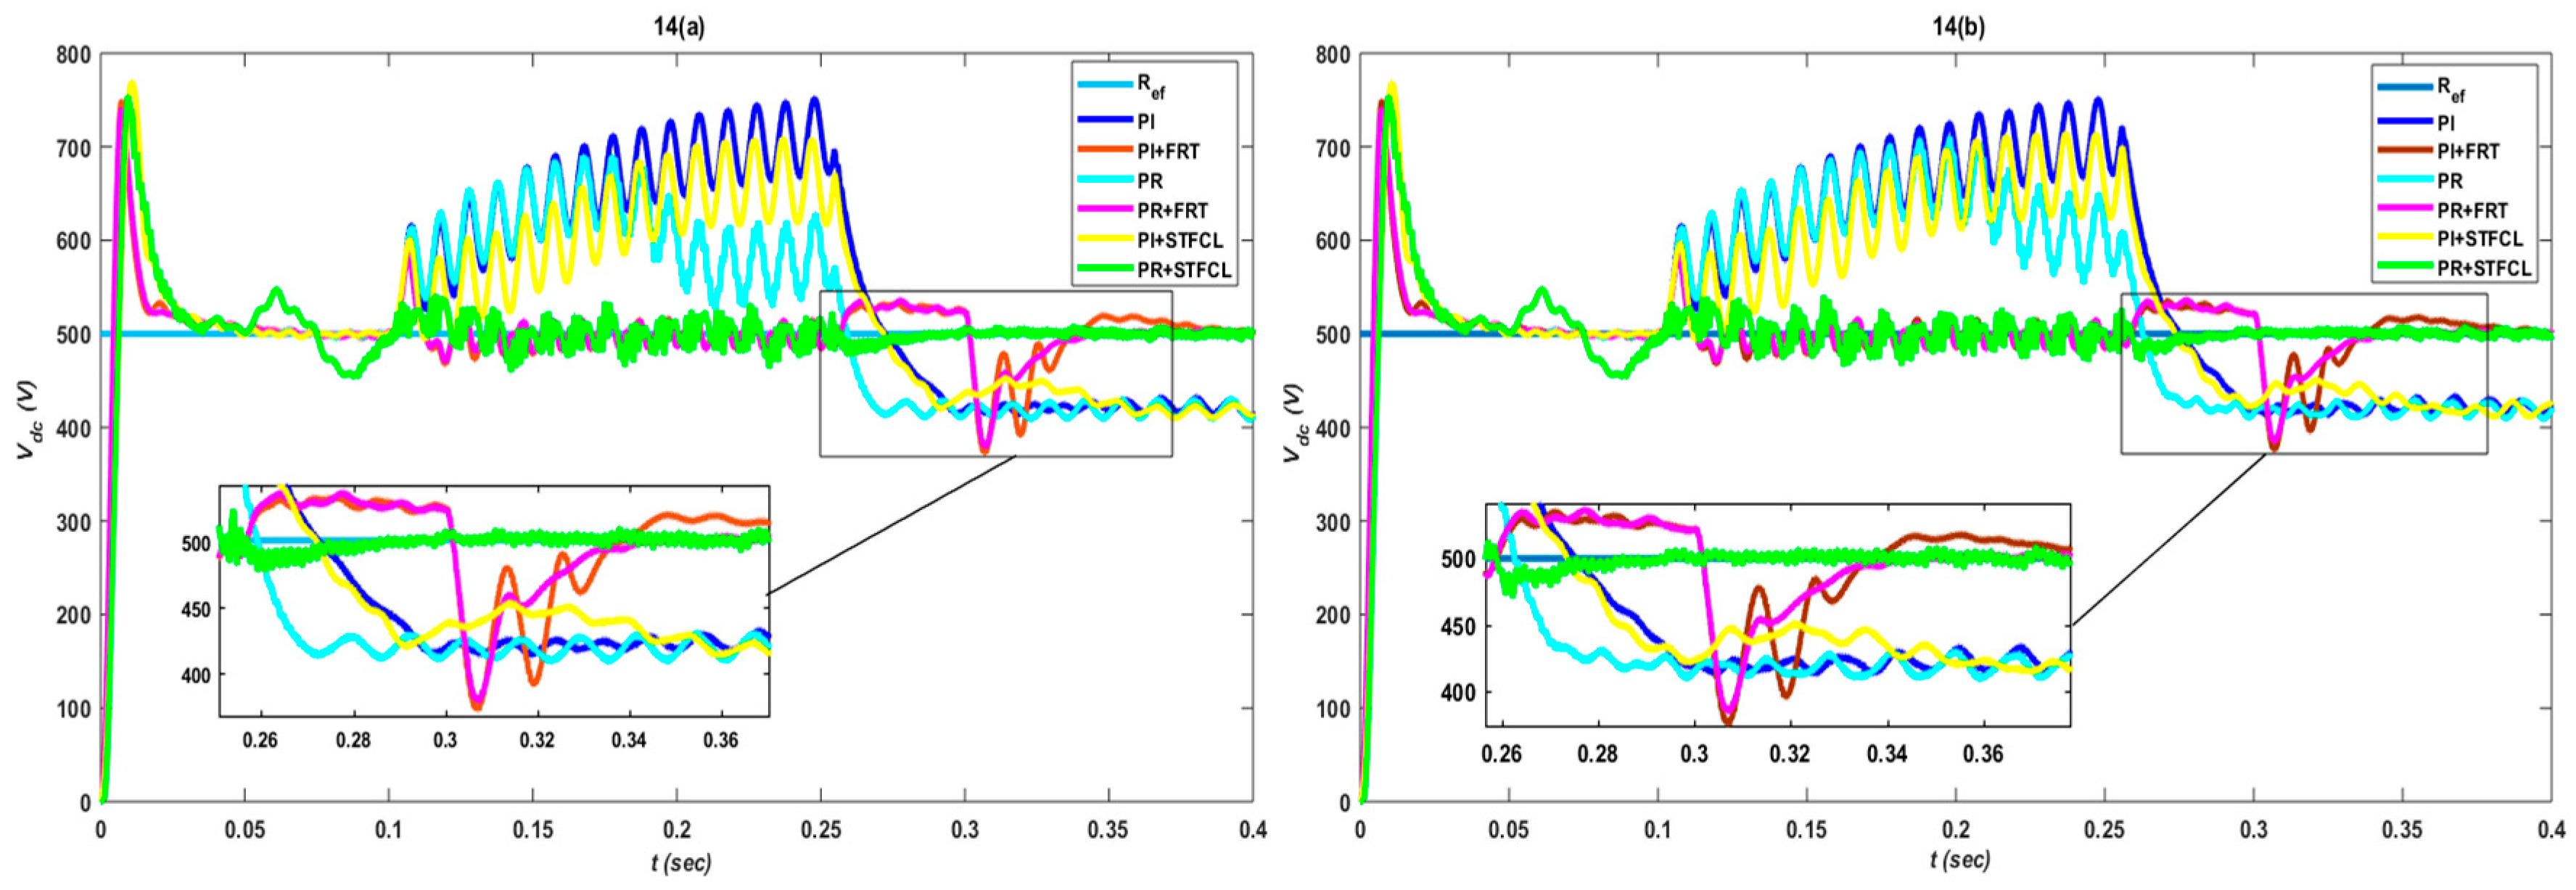
The DC link voltage spikes less in response during phase-to-phase (P–P) fault clearing time with the proposed STFCL strategy in combination with a PR controller, and without rising at fault duration. Unlike all other configurations, as depicted by Figure 14, the response is same at 19 km of distance from the PCC as at the PCC.
As mentioned above, in single phase to ground(P–G) fault the reference frame current components i.e., Id and 
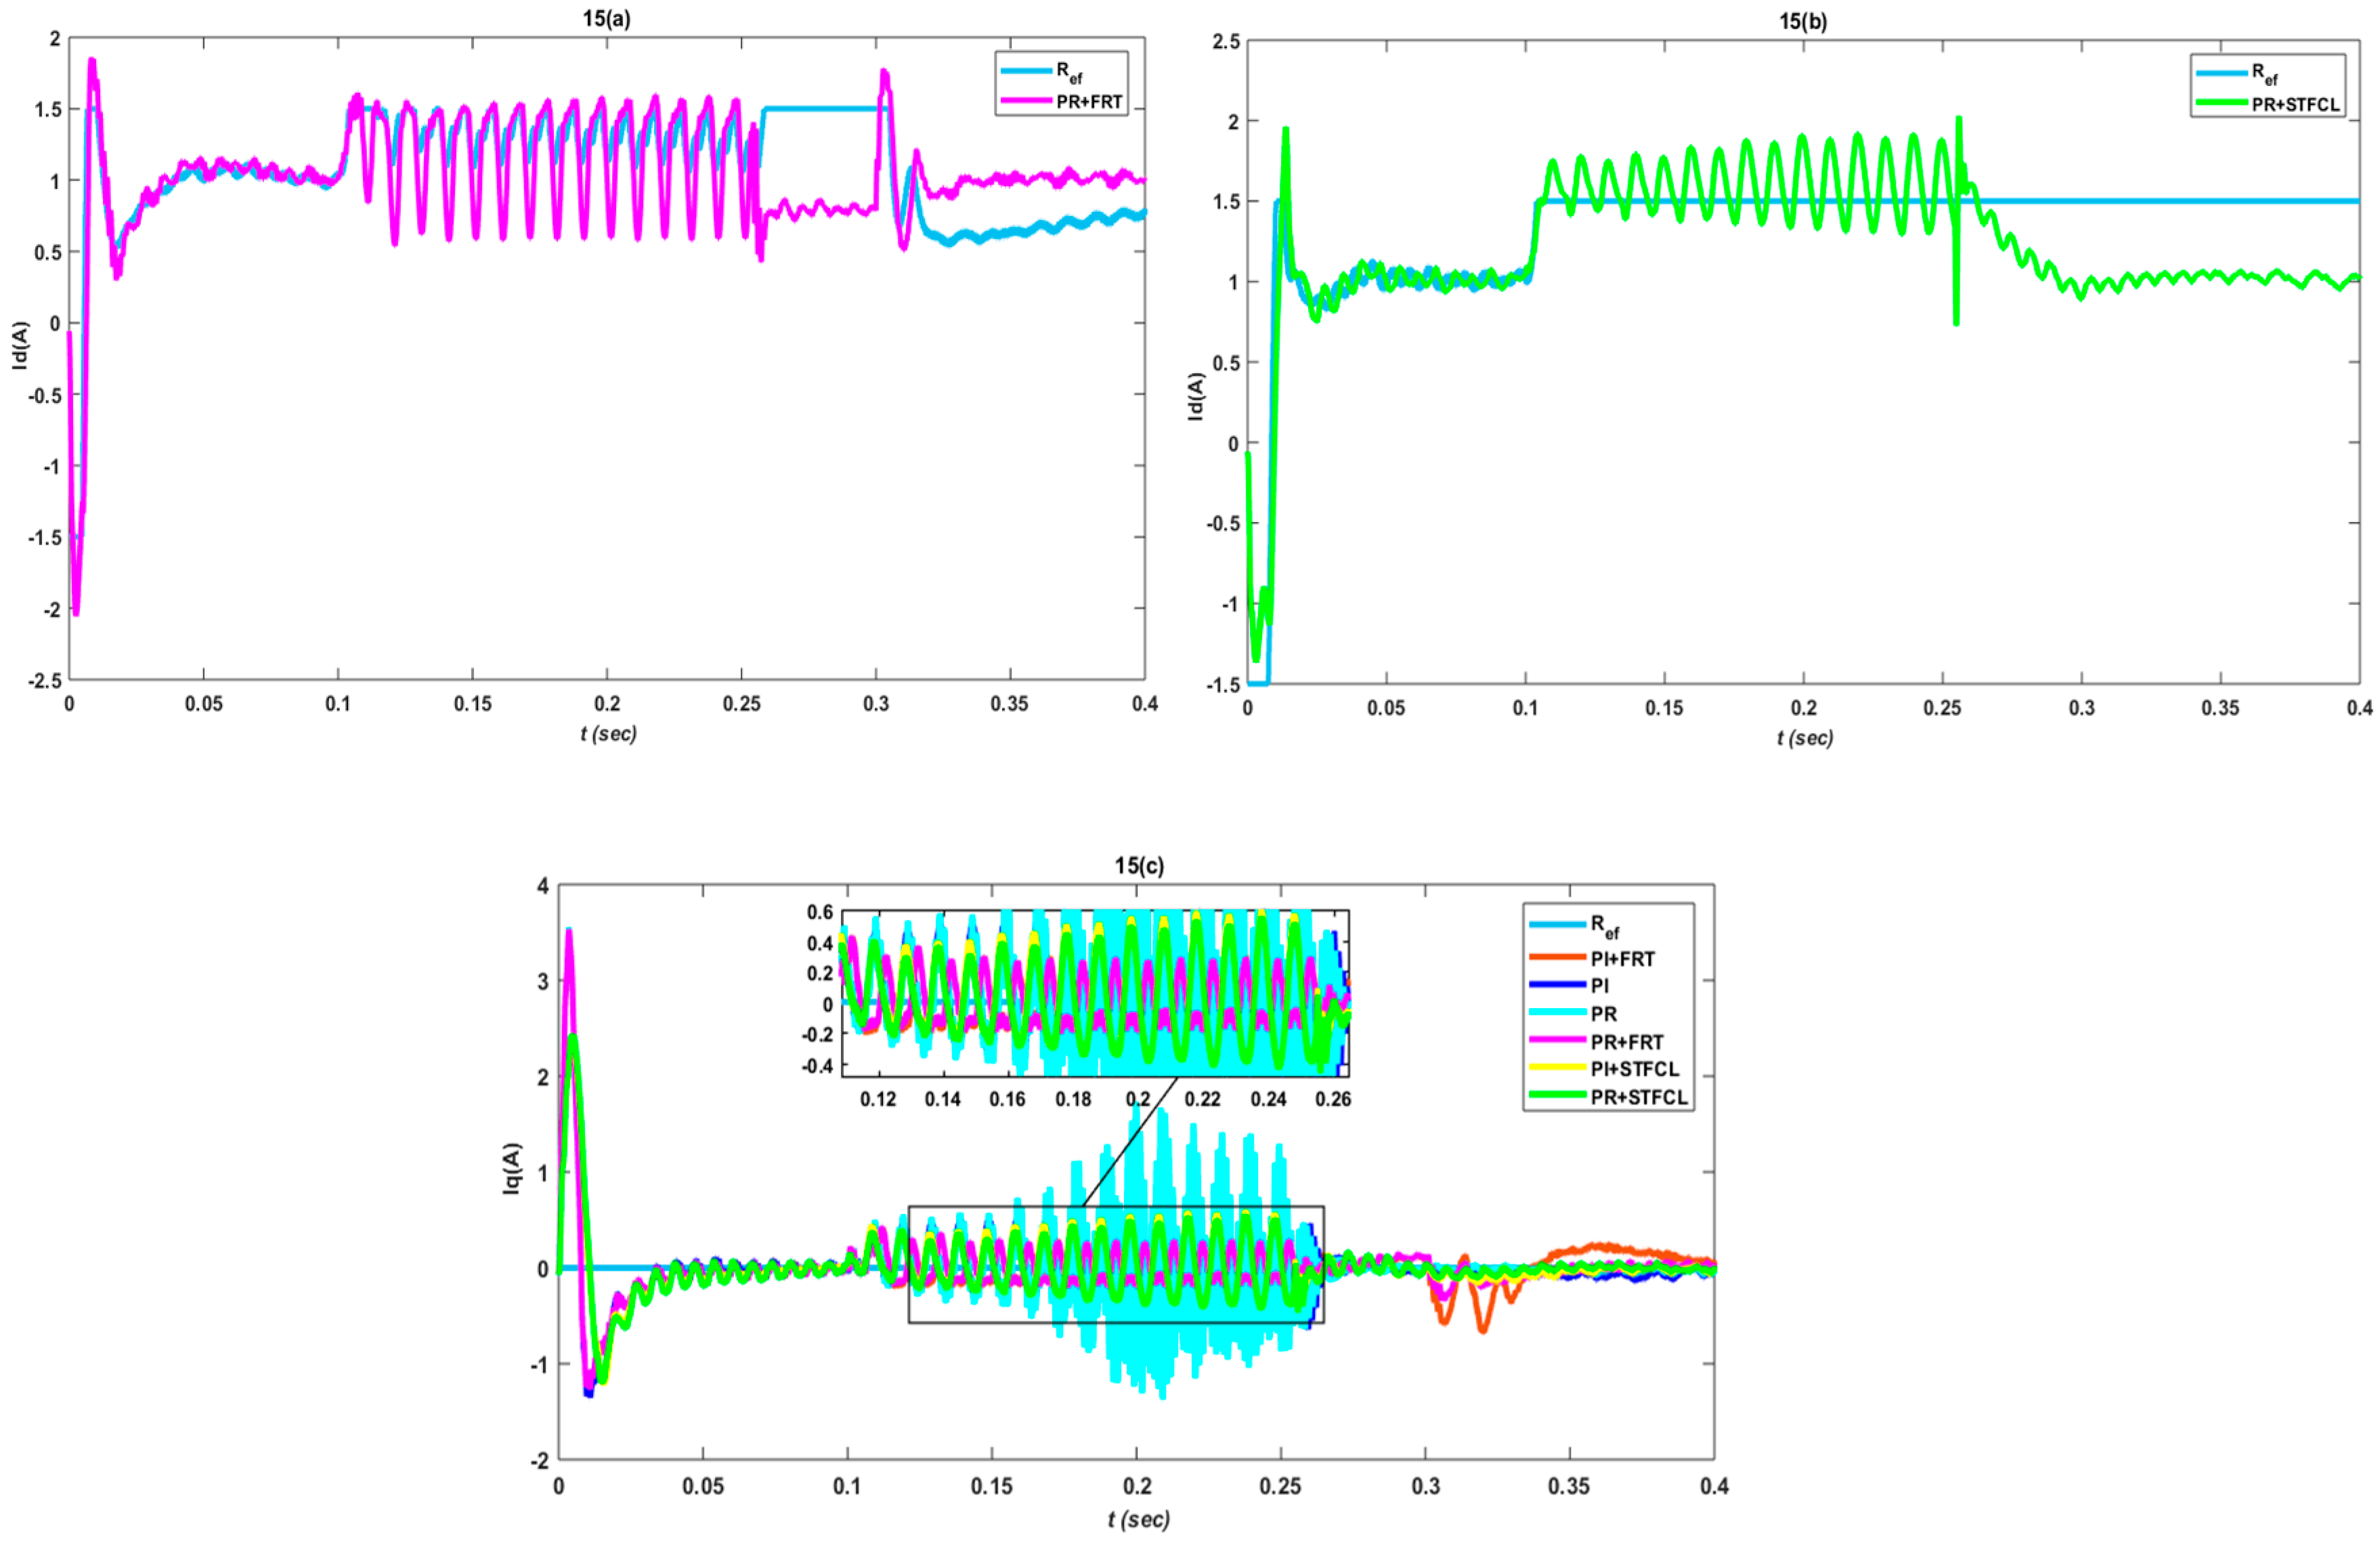
Iq have approximately the same response with respect to location of fault; the case is same for P–P. So here, information needed to analyze the effects with respect to fault type at the PCC is given by Figure 15. The conventional crowbar strategy with PR controller gives high oscillations during fault duration, along with a fault-clearing surge for 0.05 s after the fault is cleared. However, comparatively the proposed STFCL with PR strategy has fewer oscillations during fault, delaying fault clearing spikes instead for an instant. Moreover, the proposed strategy gives smooth and surge-free responses in during P–P fault as well, as depicted by Figure 15c.
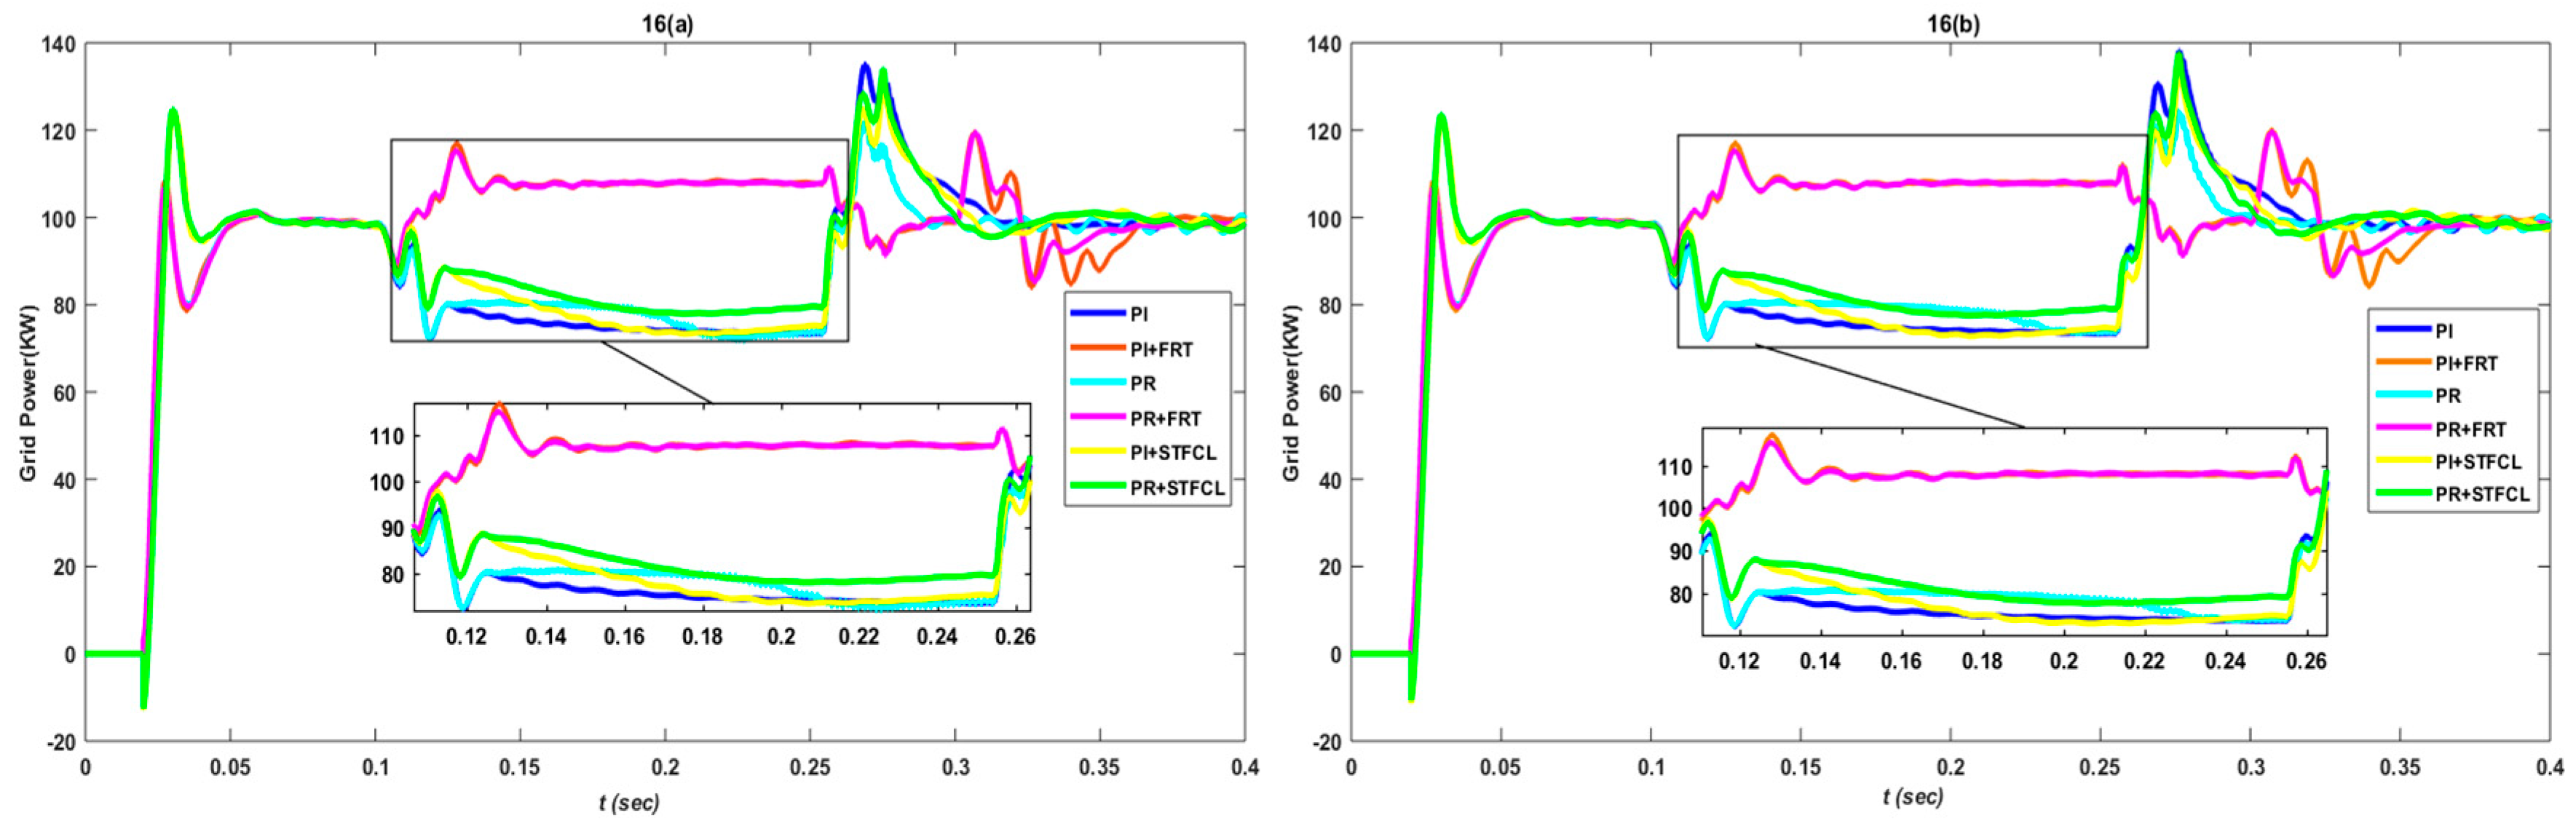
The active grid power during P–P fault falls near 20% of the rated value; however, with the STFCL strategy and PR as a controller, this deficiency remains approximately 10%, with an increasing spike for 0.04 s and then attaining its reference value. Moreover, with the crowbar strategy an increase of 20% can be seen by Figure 16 during the fault time, along with alternating spikes for 0.07 s after fault clearance at 0.3 s. However, grid power is less effected with respect to distance, as shown by comparing Figure 16a,b.
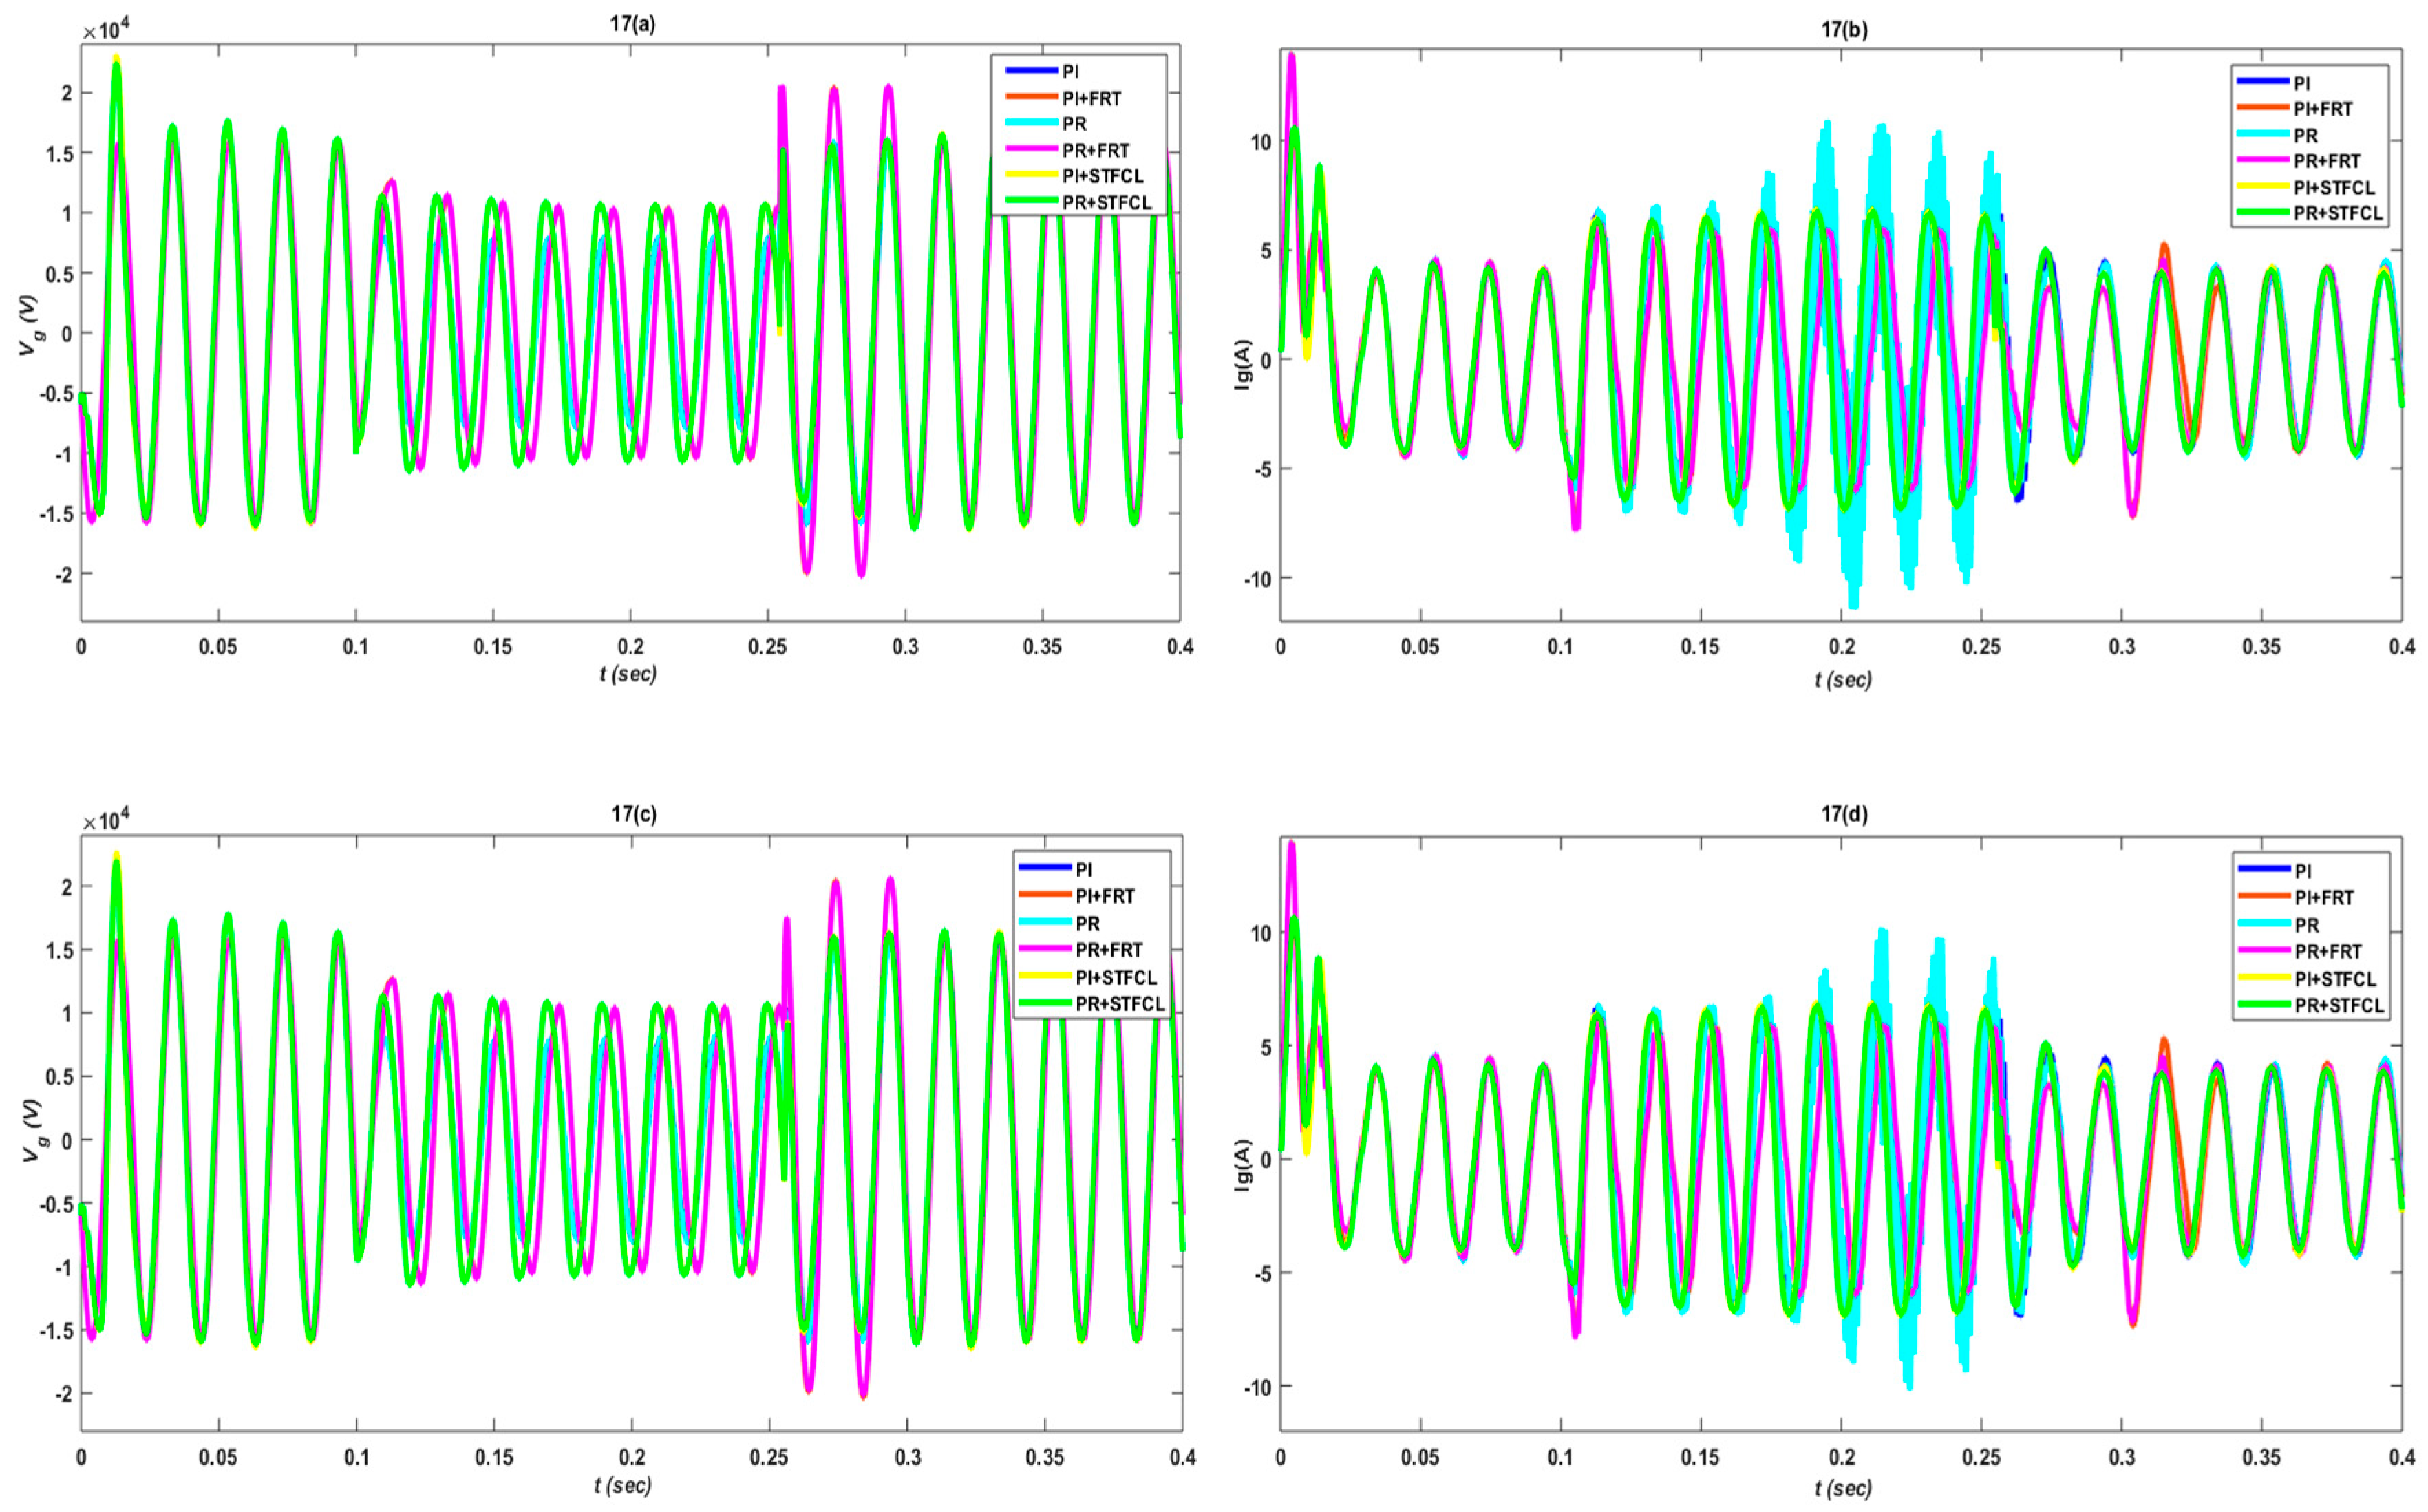
Figure 17 presents grid voltage and current wave form, comparing the LVRT improvement through the proposed STFCL, including a PR controller with the crowbar strategy as FRT. During P–P fault time, the crowbar topology with any of the controller faces a phase shift of 80 degrees at grid voltage and current. However, the proposed topology is free of any surges or phase shifts. Furthermore, grid voltage and current have negligible variations at 19 km of distance from the PCC.
The distortion in frequency to achieve LVRT capability by inducing FRT strategy during P–P fault is there for the total fault time. However, this distortion with the proposed STFCL in combination with a PR controller is approximately half that of the conventional FRT (crowbar) strategy, as depicted by Figure 18a at the PCC and 18b at 19 km away from the PCC.
The effectiveness of the proposed strategy is proved at PV side parameters, i.e., power, current, and voltage. The mentioned parameters are optimized to nominal values, without any disturbances at the entering and clearing of P–P fault through STFCL with a PR controller at the PCC. Except for the STFCL strategy, all the remaining combinations result in dips and rises at entering and clearing time of fault, as Figure 19 shows clearly.

4. Conclusions

Considering the existing grid codes, this paper emphasizes on the improvement of the FRT capability of a two-stage, three-phase, grid-connected PVS under normal conditions and asymmetrical grid faults. The response and stability of PVS during FRT is examined under analysis for the conventional crowbar and proposed STFCL strategies. The results of the proposed STFCL and PR with RHC controller is robust and ripple-free during grid faults. Moreover, the proposed strategy offers an optimized behavior of spikes at entering and clearing time of fault, as compared to crowbar as the FRT strategy with PI or PR controller. The smooth and transient-free behavior of voltage and current during fault time, due to the insertion of inductive impedance, results in the enhancement of power quality at the grid side, as well as at the PV side. The excessive energy stored in fault current limiters is absorbed by the energy absorption branch of STFCL, which results in the reduction of stress at semiconductor devices during fault. Moreover, the effect of faults at various distances have negligible variations, as compared to the type of fault.
The proposed STFCL, in combination with a PR controller for three-phase PVS, can enhance FRT capability and optimize the fault current, through which the ratings of switch gears can be reduced, along with cost. In addition, the simulation results also verify the performance indices, high efficiency, and fault-tolerant capability of the proposed strategy.

Author Contributions

S.U.I., K.Z. and W.U.D. proposed the main idea of the paper. S.U.I. implemented the mathematical derivations, simulation verifications, and analyses. The paper was written by S.U.I., and was revised by K.Z., W.U.D., I.K., M.I., T.D.C.B. and H.J.K. All the authors were involved in preparing the final version of this manuscript. In addition, this whole work is supervised by H.J.K.

Acknowledgments

This research was supported by BK21PLUS, the Creative Human Resource Development Program for IT Convergence.

Conflicts of Interest

The authors declare no conflict of interest.

Appendix A

Table A1. Model nominal parameters.
ParametersValues
Rated PV Power100.7 kW
PV Line Voltage275 V (L-L, rms)
Phases3
Full Load PV current365 A
System Frequency50 Hz
Boost converter Frequency5 kHz
VDC500 V
Grid voltage20 KV
Inductor-capacitor-Indictor (LCL) filter (Lg, Li, Cf)250 × 10−6 H, 150 × 10−6 H, 22.4 × 10⁻⁶ F
Input sun irradiance1000 (W/m2)
Input temperature25 °C
MPPT algorithmIncremental conductance
Full load Grid current2.94 A
Inverter Frequency2 kHz
Table A2. Control schemes constants.
Control SchemesParametersVDCIdIq
PI k p 70.30.3
k i 8002020
PR + RHC k p _ PR 70.50.31
k i _ PR 800520
k i 3 3rd harmonics compensation121212
k i 5 5th harmonics compensation888
k i 5 7th harmonics compensation222
Table A3. Fault-ride through (FRT) strategy constants.
FRT StrategiesParametersValue/Type
Crowbar Resistance   ( R ) 1500 Ω
Switch   type DIAC
Trig _ block Stair   generator
STFCL L l 0.3   H
R l 1800 Ω
C a 5000 × 10−6 F
R a 400 Ω
C f 36 × 10−3 F

References

  1. Willisand, H.L.; Scott, W.G. Distributed Power Generation: Planning and Evaluation; Marcel-Dekker: New York, NY, USA, 2000. [Google Scholar]
  2. PVPS Report—A Snapshot of Global PV—1992-2012, Preliminary information from the IEA PVPS Programme; Report IEA-PVPS T1-22:201; IEA PVPS Programme: Ursen, Switzerland, 2012.
  3. EPIA. Global Market Outlook for Photovoltaics 2013–2017; EPIA: Belgium, European Kingdom, 2013. [Google Scholar]
  4. REN21 Renewables 2014: Global Status Report. 2014, pp. 15–16. Available online: http://www.webcitation.org/6SKF06GAX (accessed on 16 October 2018).
  5. Iov, F.; Hansen, A.D.; Sørensen, P.E.; Cutululis, N.A. Mapping of Grid Faults and Grid Codes; Tech. Rep., Risø National Laboratory; Technical University of Denmark: Lyngby, Denmark, 2007. [Google Scholar]
  6. E. ON GmbH. Grid Code—High and Extra High Voltage. Available online: http://www.eon-netz.com/ (accessed on 24 October 2018).
  7. Braun, M.; Arnold, G.; Laukamp, H. Plugging into the Zeitgeist. IEEE Power Energy Mag. 2009, 7, 63–76. [Google Scholar] [CrossRef]
  8. Comitato Elettrotecnico Italiano. CEI0-21: Reference Technical Rules for Connecting Users to the Active and Passive LV Distribution Companies of Electricity. Available online: http://www.ceiweb.it/ (accessed on 28 September 2018).
  9. Altin, M.; Goksu, O.; Teodorescu, R.; Rodriguez, P.; Jensen, B.B.; Helle, L. Overview of recent grid codes for wind power integration. In Proceedings of the 2010 12th International Conference on Optimization of Electrical and Electronic Equipment, Basov, Romania, 20–22 May 2010; pp. 1152–1160. [Google Scholar]
  10. Beach, T.; Kozinda, A.; Rao, V. Advanced Inverters for Distributed PV: Latent Opportunities for Localized Reactive Power Compensation; Cal x Clean Coalition Energy C226; Cal x Clean Coalition: Menlo Park, CA, USA, 2013. [Google Scholar]
  11. Ding, G.; Gao, F.; Tian, H.; Ma, C.; Chen, M.; He, G.; Liu, Y. Adaptive dc-link voltage control of two-stage photovoltaic inverter during low voltage ride-through operation. IEEE Trans. Power Electron. 2016, 31, 4182–4194. [Google Scholar] [CrossRef]
  12. Stetz, T.; Marten, F.; Braun, M. Improved low voltage grid-integration of photovoltaic systems in Germany. IEEE Trans. Sustain. Energy 2013, 4, 534–542. [Google Scholar] [CrossRef]
  13. Tsili, M.; Papathanassiou, S. A review of grid code technical requirements for wind farms. IET Renew. Power Gener. 2009, 3, 308–332. [Google Scholar] [CrossRef]
  14. Lin, W.M.; Hong, C.M. A new Elman neural network-based control algorithm for adjustable-pitch variable-speed wind-energy conversion systems. IEEE Trans. Power Electron. 2011, 26, 473–481. [Google Scholar] [CrossRef]
  15. Gaing, Z.L. Wavelet-based neural network for power disturbance recognition and classification. IEEE Trans. Power 2004, 19, 1560–1568. [Google Scholar] [CrossRef]
  16. Rodriguez, P.; Timbus, A.V.; Teodorescu, R.; Liserre, M.; Blaabjerg, F. Flexible active power control of distributed power generation systems during grid faults. IEEE Trans. Ind. Electron. 2007, 54, 2583–2592. [Google Scholar] [CrossRef]
  17. Teodorescu, R.; Liserre, M.; Rodriguez, P. Grid Converters for Photovoltaic and Wind Power Systems; Wiley: Hoboken, NJ, USA, 2011; Volume 29. [Google Scholar]
  18. Camacho, A.; Castilla, M.; Miret, J.; Borrell, A.; de Vicuna, L.G. Active and reactive power strategies with peak current limitation for distributed generation inverters during unbalanced grid faults. IEEE Trans. Ind. Electron. 2015, 62, 1515–1525. [Google Scholar] [CrossRef]
  19. Uddin, W.; Zeb, K.; Khan, B.; Ali, S.M.; Mehmood, C.A.; Haider, A. Control of DC link voltage for grid interfaced DFIG using Adaptive Sliding Mode & Fuzzy based on Levenberg-Marquardt algorithm during symmetrical fault. In Proceedings of the 2016 International Conference on Computing, Electronic and Electrical Engineering (ICE Cube), Quetta, Pakistan, 11–12 April 2016; pp. 1–6. [Google Scholar]
  20. Liu, Z.; Li, H.X. A probabilistic fuzzy logic system for modeling and control. IEEE Trans. Fuzzy Syst. 2005, 13, 848–859. [Google Scholar]
  21. Cardenas, R.; Pena, R.; Alepuz, S.; Asher, G. Overview of control system for the operation of DFIGs in wind energy application. IEEE Trans. Ind. Electron. 2013, 60, 2776–2798. [Google Scholar] [CrossRef]
  22. Li, H.X.; Liu, Z. A probabilistic neural-fuzzy learning system for stochastic modeling. IEEE Trans. Fuzzy Syst. 2008, 16, 898–908. [Google Scholar] [CrossRef]
  23. Zeb, K.; Khan, I.; Uddin, W. A Review on Recent Advances and Future Trends of Transformerless Inverter Structures for Single-Phase Grid-Connected Photovoltaic Systems. Energies 2018, 11, 1968. [Google Scholar] [CrossRef]
  24. Massawe, H.B. Grid Connected Photovoltaic Systems with SmartGrid functionality. Master’s Thesis, Dept. ElKraft, NTNU, Trondheim, Norway, 2013. [Google Scholar]
  25. Makhlouf, M.; Messai, F.; Benalla, H. Modeling and control of a single-phase grid connected photovoltaic system. J. Theor. Appl. Inf. Technol. 2012, 37, 289–296. [Google Scholar]
  26. Available online: www.mathworks.com (accessed on 12 September 2018).
  27. Banu, I.V.; Istrate, M. Modeling of maximum power point tracking algorithm for PV systems. In Proceedings of the 2012 International Conference and Exposition on Electrical and Power Engineering (EPE), Iasi, Romania, 25–27 October 2012; pp. 953–957. [Google Scholar]
  28. Kazmierkowski, M.; Krishnan, R.; Blaabjerg, F. Control in Power Electronics—Selected Problems; Academic: New York, NY, USA, 2002. [Google Scholar]
  29. Yuan, X.; Merk, W.; Stemmler, H.; Allmeling, J. StationaryFrame Generalized Integrators for Current Control of Active Power Filters with Zero Steady-State Error for Current Harmonics of Concern under Unbalanced and Distorted Operating Conditions. IEEE Trans. Ind. App. 2002, 38, 523–532. [Google Scholar] [CrossRef]
  30. Daniel, Z.; Cyril, S.S. Design of PR current control with selective harmonic compensators using MATLAB. J. Electr. Syst. Inf. Technol. 2017, 4, 347–358. [Google Scholar]
  31. Zeb, K.; Uddin, W.; Khan, M.A. A Comprehensive Review on Inverter Topologies and Control Strategies for Grid Connected Photovoltaic System; Elsevier: Amsterdam, The Netherlands, 2018; Volume 94, pp. 1120–1141. [Google Scholar]
  32. Uddin, W.; Zeb, K.; Tanoli, A.; Haider, A. Hardware-based hybrid scheme to improve the fault ride through capability of doubly fed induction generator under symmetrical and asymmetrical fault. IET Gener. Transm. Distrib. 2018, 12, 200–206. [Google Scholar] [CrossRef]
Figure 1. Equivalent circuit of a photovoltaic (PV) cell.
Electronics 07 00451 g001
Figure 2. Equivalent circuit of a boost converter.
Electronics 07 00451 g002
Figure 3. Proposed model for three phase grid-connected PVS.
Electronics 07 00451 g003
Figure 4. Control scheme for grid inverter.
Electronics 07 00451 g004
Figure 5. Combined structure of proportional resonance (PR) with a harmonic compensator.
Electronics 07 00451 g005
Figure 6. Crowbar circuit with controlled switches.
Electronics 07 00451 g006
Figure 7. Proposed model with switch-type fault current limiter (STFCL) circuit connection.
Electronics 07 00451 g007
Figure 8. Simulation results of DC link voltage at the PCC (a) and at 19 km (b).
Electronics 07 00451 g008
Figure 9. Id component at PCC (a,b) and for 19 km (c,d). Iq component at PCC and for 19 km (e,f).
Electronics 07 00451 g009aElectronics 07 00451 g009b
Figure 10. Grid active power during S–G fault at the point of common coupling (PCC) (a) and at 19 km from PCC (b).
Electronics 07 00451 g010
Figure 11. Grid current and voltage at the PCC (a,b) and at a 19 km distance (c,d).
Electronics 07 00451 g011
Figure 12. Frequency response during the S–G fault at the PCC (a) and at 19 km from PCC (b).
Electronics 07 00451 g012
Figure 13. PV side parameters power, current, and voltage shown (ac), respectively.
Electronics 07 00451 g013
Figure 14. Direct current (DC) link voltage response at the PCC (a) and at 19 km from the PCC (b).
Electronics 07 00451 g014
Figure 15. Id component at the PCC (a,b) and Iq component at the PCC (c).
Electronics 07 00451 g015
Figure 16. Grid active power at the PCC (a) and at 19 km from the PCC (b).
Electronics 07 00451 g016
Figure 17. Grid voltage and current response at PCC (a,b) and at 19 km (c,d).
Electronics 07 00451 g017
Figure 18. Frequency response during phase-to-phase (P–P) fault at the PCC (a) and at 19 km (b).
Electronics 07 00451 g018
Figure 19. PV side parameters’ response at the PCC power (a), current (b), and voltage (c).
Electronics 07 00451 g019
Table 1. Performance evaluation of designed control strategies for VDC.
Control StrategiesSingle-PhaseTwo-Phase
IAEISEITAEIAEISEITAE
PIa. 0.0111a. 0.0033a. 0.0009a. 0.0754a. 0.0233a. 0.0160
PI + FRTa. 0.0158a. 0.0038a. 0.0025a. 0.0175a. 0.0041a. 0.0028
PRa. 0.0106a. 0.0032a. 0.0008a. 0.0612a. 0.0145a. 0.0130
PR + FRTa. 0.0143a. 0.0036a. 0.0020a. 0.0157a. 0.0039a. 0.0023
PI + STFCLa. 0.0126a. 0.0048a. 0.0007a. 0.0629a. 0.0171a. 0.0132
PR + STFCLa. 0.0122a. 0.0047a. 0.0006a. 0.0188a. 0.0065a. 0.0188
IAE: integral absolute error; ISE: integral square error; ITAE: integral of time-weighted absolute error.
Table 2. Performance evaluation of designed control strategies for Id.
Control StrategiesSingle-PhaseTwo-Phase
IAEISEITAEIAEISEITAE
PIa. 0.0357a. 0.0096a. 0.0051a. 0.1164a. 0.0500a.0.0290
PI + FRTa. 0.1107a. 0.0633a. 0.0269a. 0.1204a. 0.0755a.0.0296
PRa. 0.0273a. 0.0061a. 0.0041a. 0.1424a. 0.0833a.0.0354
PR + FRTa. 0.0935a. 0.0405a. 0.0228a. 0.1030a. 0.0496a.0.0257
PI + STFCLa. 0.0338a. 0.0110a. 0.0042a. 0.1114a. 0.0486a.0.0278
PR + STFCLa. 0.0258a. 0.0071a. 0.0030a. 0.1002a. 0.0412a.0.0257
IAE: integral absolute error; ISE: integral square error; ITAE: integral of time-weighted absolute error.
Table 3. Performance evaluation of designed control strategies for Iq.
Control StrategiesSingle-PhaseTwo-Phase
IAEISEITAEIAEISEITAE
PIa. 0.0426a. 0.0513a. 0.0028a. 0.0834a. 0.0672a. 0.0113
PI + FRTa. 0.0655a. 0.0574a. 0.0096a. 0.0746a. 0.0601a. 0.0113
PRa. 0.0426a. 0.0516a.0.0027a. 0.0997a. 0.0931a. 0.0142
PR + FRTa. 0.0531a. 0.0531a. 0.0053a. 0.0626a. 0.0557a. 0.0070
PI + STFCLa. 0.0371a. 0.0368a. 0.0021a. 0.0747a. 0.0490a. 0.0099
PR + STFCLa. 0.0391a. 0.0392a. 0.0019a. 0.0734a. 0.0495a. 0.0089
IAE: integral absolute error; ISE: integral square error; ITAE: integral of time-weighted absolute error.

