Step-Down Partial Power DC-DC Converters for Two-Stage Photovoltaic String Inverters


1
Laboratoire Plasma et Conversion d’Énergie, ENSEEIHT, 31071 Toulouse CEDEX 7, France
2
Electronics Engineering Department, Universidad Tecnica Federico Santa Maria, Valparaiso 2390123, Chile
*
Author to whom correspondence should be addressed.
†
These authors contributed equally to this work.
Electronics 2019, 8(1), 87; https://doi.org/10.3390/electronics8010087
Submission received: 11 December 2018
/
Revised: 8 January 2019
/
Accepted: 9 January 2019
/
Published: 12 January 2019
(This article belongs to the Special Issue Advanced Power Conversion Technologies)
Abstract
:Photovoltaic (PV) systems composed by two energy conversion stages are attractive from an operation point of view. This is because the maximum power point tracking (MPPT) range is extended, due to the voltage decoupling between the PV system and the dc-link. Nevertheless, the additional dc-dc conversion stage increases the volume, cost and power converter losses. Therefore, central inverters based on a single-stage converter, have been a mainstream solution to interface large-scale PV arrays composed of several strings connected in parallel made by the series connections of PV modules. The concept of partial power converters (PPC), previously reported as a voltage step-up stage, has not addressed in depth for all types of PV applications. In this work, a PPC performing voltage step-down operation is proposed and analyzed. This concept is interesting from the industry point of view, since with the new isolation standards of PV modules are reaching 1500 V, increasing both the size of the string and dc-link voltage for single-stage inverters. Since grid connection remains typically at 690 V, larger strings impose more demanding operation for single-stage central inverters (required to operate at lower modulation indexes and demand higher blocking voltage devices), making the proposed step-down PPC an attractive solution. Theoretical analysis and an experimental test-bench was built in order to validate the PPC concept, the control performance and the improvement of the conversion efficiency. The experimental results corroborate the benefits of using a PPC, in terms of increasing the system efficiency by reducing the processed power of the converter, while not affecting the system performance.
1. Introduction
Traditional single-stage converters (string and central inverters) have been the mainstream solution for grid-connected PV systems. The most important reasons are the lower capital cost and lower conversion losses compared with a two-stage approach. Nevertheless, due to penetration of larger PV plants, more demanding grid-codes have been introduced, therefore affecting particularly PV systems with central inverters. One of these regulations requires inverters to perform frequency regulation through power curtailment, which forces the PV systems to forfeit power and not operate in its maximum power point [1]. This reduces the dc voltage operating range limited on one side by the minimum voltage needed to perform current control and on the other side to regulate the power curtailment.
An additional dc–dc stage increases the MPPT range, due to the voltage decoupling between the PV system and the dc-link. In addition, the effect of partial shading is mitigated if several dc-stages are used, and the energy yield is increased due to the multiple independent MPPT for smaller strings or arrays [2]. This approach is changing the market share of the PV industry, where companies such as Huawei are currently leading the PV industry, by delivering high-efficiency two-stage conversion systems with up to 6 independent strings [3]. Nowadays, two-stage PV inverters are gaining more interest over central inverters reducing partial shading effects [2]. Furthermore, the power density seemed not to be an issue in the past for large-scale PV systems where central inverters are used, but once the two-stage approach was adopted, the reduction of the converter size and weight has become important, due to the benefits in shipping and installation costs.
In large-scale solar PV systems, it is usual to find larger PV strings to reach higher dc voltages, and several strings connected in parallel to increase the power, forming an array. Due to PV voltage isolation limits, traditional string voltages are designed to values under 1000 V. However, larger PV strings around 1500 V are becoming popular [4,5], due to reduction of the combiner boxes [6], and also for the losses reduction in the dc-side [7]. Since grid connection remains below 690 V, larger strings impose more demanding operation for single-stage central inverters. It requires to operate the inverter at lower modulation indexes reducing their efficiency, and it requires higher blocking voltage devices. An alternative, is to change the grid connection step-up transformer, to enable a higher AC voltage operation at the inverter side, but this is not a standard equipment.
On the other hand, adding an additional conversion stage performing buck operation leads to increase the component count, converter’s size and conversion losses. This is the motivation to take advantage of the PPC concept, which was initially implemented for PV systems in [2], in order to reduce the power losses in the two-stage configurations. The concept of partial power converters (PPC), previously implemented as a step-up stage, has not been fully covered all PV applications [8]. Therefore, in this work a PPC performing step-down operation is analyzed and evaluated with a laboratory experimental test-bench.
2. Step-Down Partial Power Converters for PV Systems
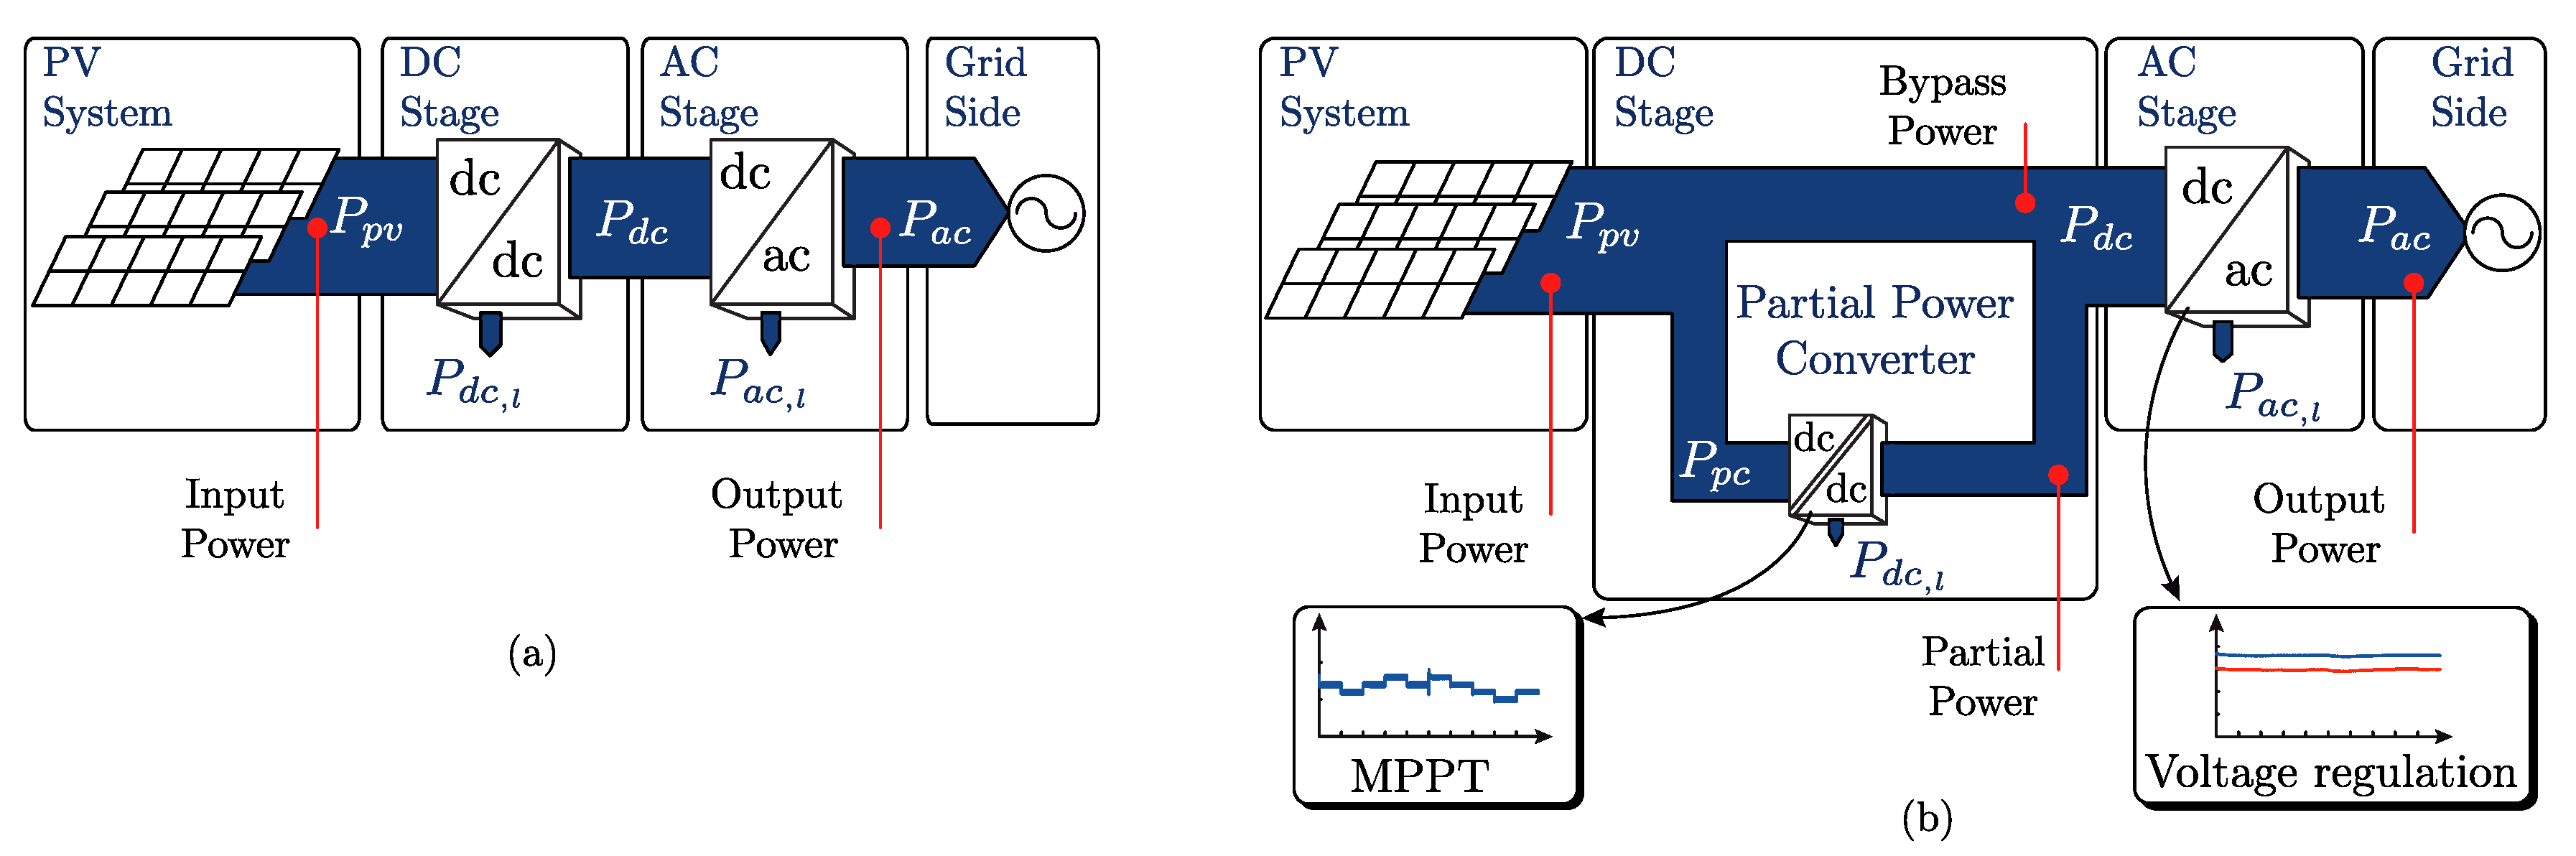
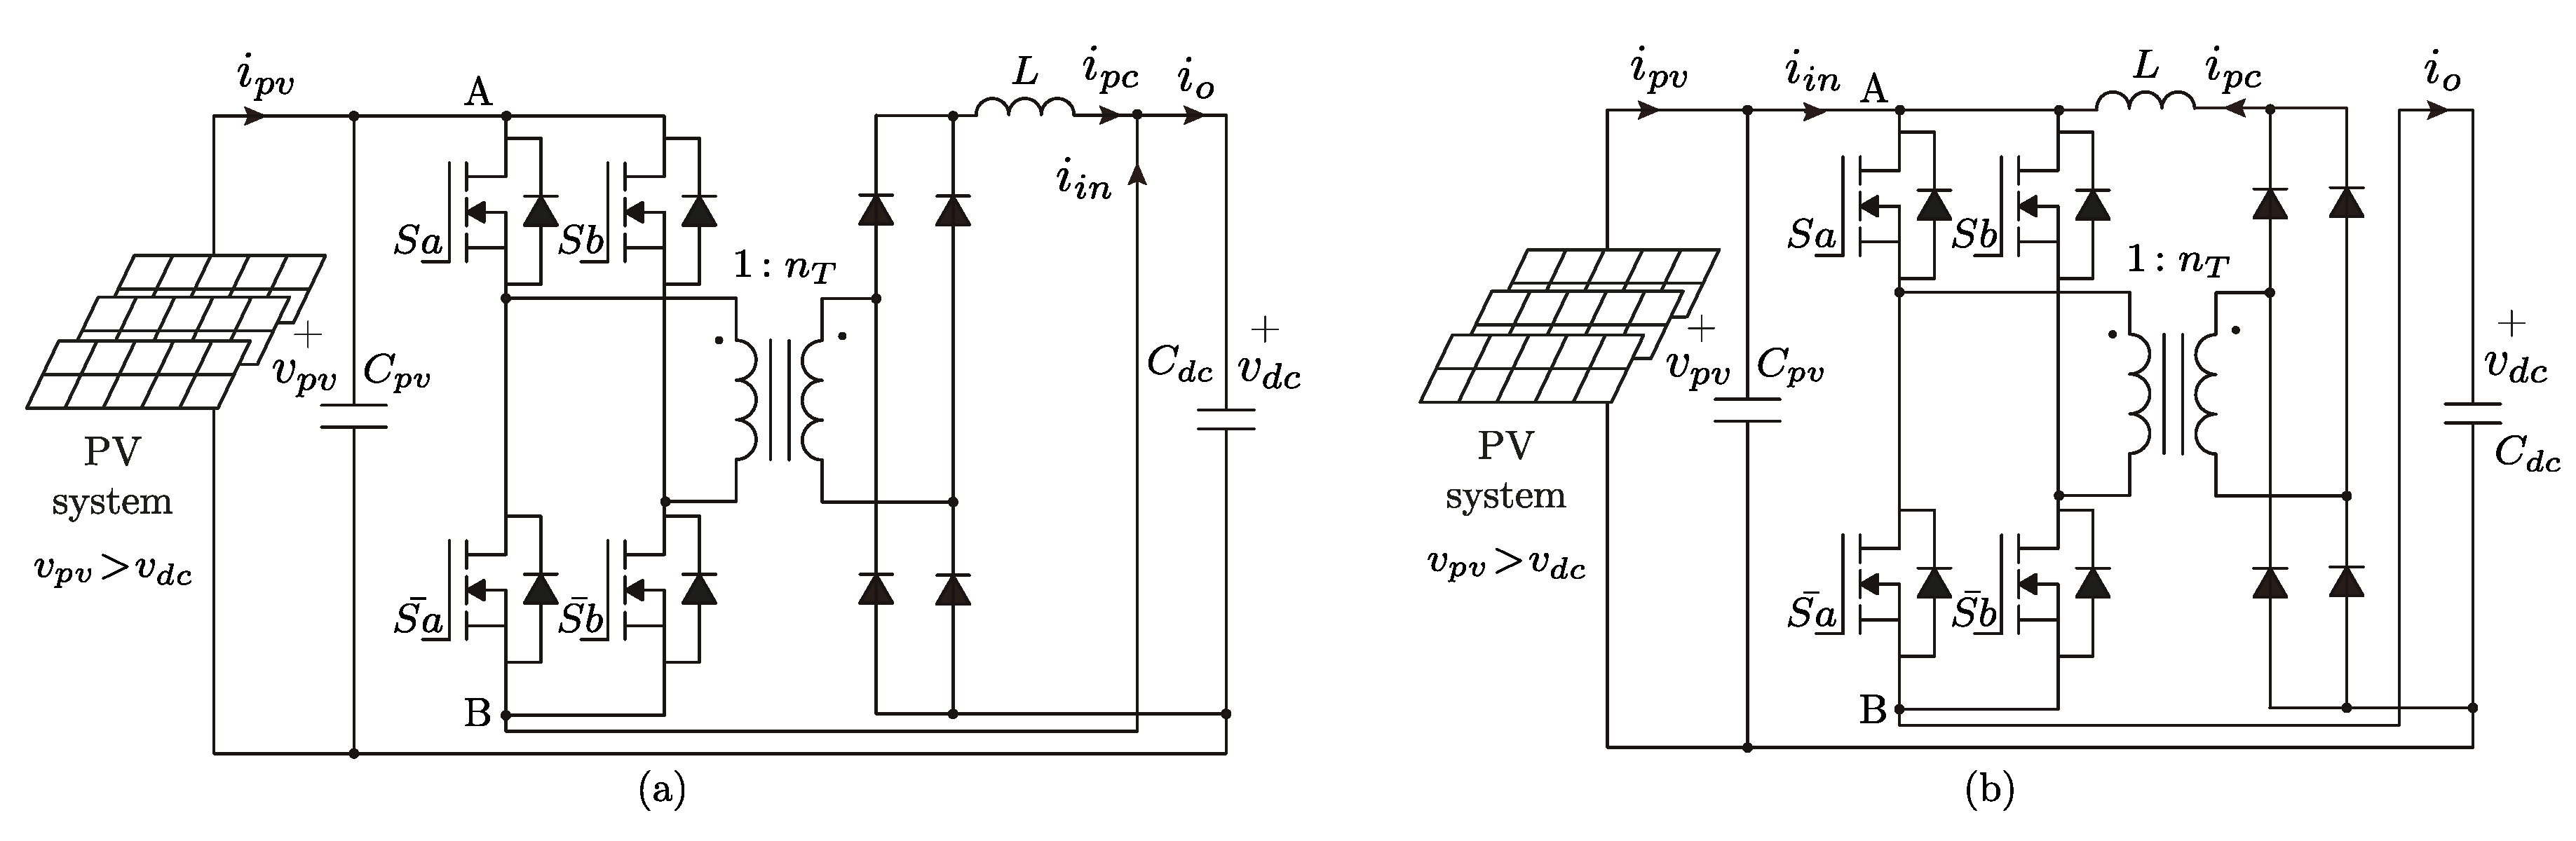
The additional conversion stage in two-stage systems increases the component count, cost and size. Which is translated in higher converter losses to the system. In traditional grid-connected inverters, both converter stages, the dc–dc and the inverter, process all the power flowing from the PV source to the grid, as depicted in Figure 1a. They are known as Full Power Converters (FPC), so that the power losses of each stage, and , depend on the converter efficiency, and the amount of power handled by each converter.
However, if the dc-stage is made by directing the power into two power paths, as depicted in Figure 1b, the dc-stage conversion efficiency increases. As long as, one of the paths has a higher efficiency than the dc–dc converter efficiency . In that case, the power processed by the converter is reduced, leading to a reduction of the conversion losses in the dc-stage. This dc-stage configuration can be named as Partial Power Converter (PPC), as long as the power processed by the converter is lower than the total power of the PV system . It can be understood with the analysis of the dc-stage conversion efficiency .
Simplifying the expression, the dc-stage efficiency is expressed as:
As can be seen from (2), the dc-stage efficiency does not depend only of the dc–dc converter efficiency , but also it is affected by the ratio of the power processed by the dc–dc converter . This power ratio is the main feature of a PPC, and considering this parameter it is possible to make a further analysis of these converters. In essence, the operating principle is the series connection of a voltage source between the PV source and the dc-link at the inverter side. This voltage source is designed to be smaller that the other two sources, then it will process less power. In addition, the PPC is able to indirectly control the PV system output voltage ensuring MPPT. Moreover, the dc–dc converter takes the power from the PV system and because of the connection, the series path also takes the power from the same PV system. For that reason, it is mandatory the use of isolated dc–dc topologies in the PPC configurations to avoid a short-circuit connecting an independently controlled dc-voltage between the PV system and the dc-link [9]. Considering that the power rating of the converter is much lower than the total power, and high-frequency transformers are used, the isolated topologies requirement does not present a drawback. Furthermore, with the selection of the inverter stage and modulation, as traditional transformer-less PV inverters, a proper grounding of the PV system can be achieved [10].
The PPC configuration based on a step-up operation has been already addressed in several works for different applications [11,12,13,14,15]. Focusing on PPC for microinverters PV applications, the most relevant works are found in [16,17,18,19]. They present an improvement in the conversion efficiency, which is commonly a problem in microinverters due to the high voltage elevation required for the grid-connection. In addition, based on the connection evaluated in [20,21], it is also possible to perform step-up operation. Nevertheless, this configuration has a limitation on the voltage elevation, which must be less than the double of the input voltage as is explained in [9].
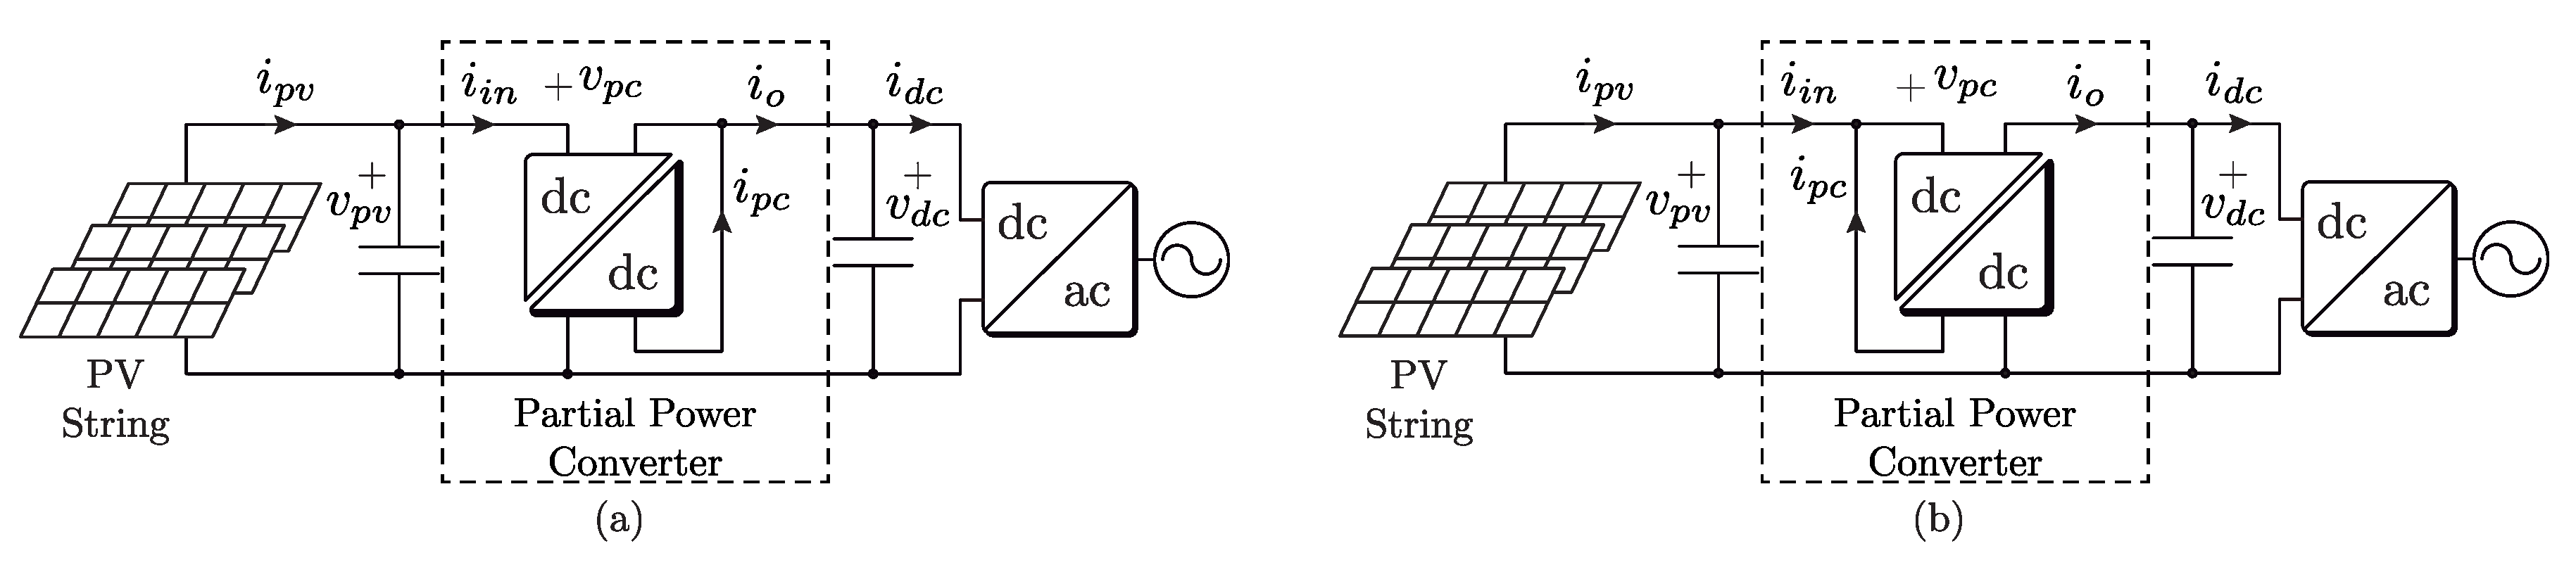
As can be noted, there are different step-up PPC configurations used depending on the two-stage PV application. However, step-down PV applications have not been fully analyzed in terms of MPP voltage operation range, volume improvement due to partial power conversion, and the effects produced under solar irradiation changes. For that reason, in this paper is analyzed and validated with experimental results, a PPC with buck operation for larger strings as depicted in Figure 2.
The main conceptual difference between a step-up and a step-down PPC is the voltage gain . A step-up PPC is used for PV applications, where the input voltage must be elevated until reaching the level required for the grid-connection. On the other hand, nowadays new PV strings reach 1500 V insulation, making larger strings a reality, and increasing the need of buck dc–dc stages to properly connect to grid-voltage levels. Step-down PPCs are oriented to these PV applications, so that traditional large-scale PV applications do not work with two-stage systems due to the high conversion losses. In addition, the MPPT is made with the inverter stage, which is also the responsible for the grid-connection [10]. It reduces the global efficiency of the system, specially under partial shading conditions, so that the convert does not have a wide operation voltage range. Therefore, the use of a step-down PPC for the dc-stage can be an attractive solution in order to increase the dc-stage conversion system, also increasing the MPPT flexibility, due to the decoupled voltage between the PV and the dc-side. Moreover, some other important benefits come from the reduction of weight and size of the converter, due to the reduced power processed by the dc-stage.
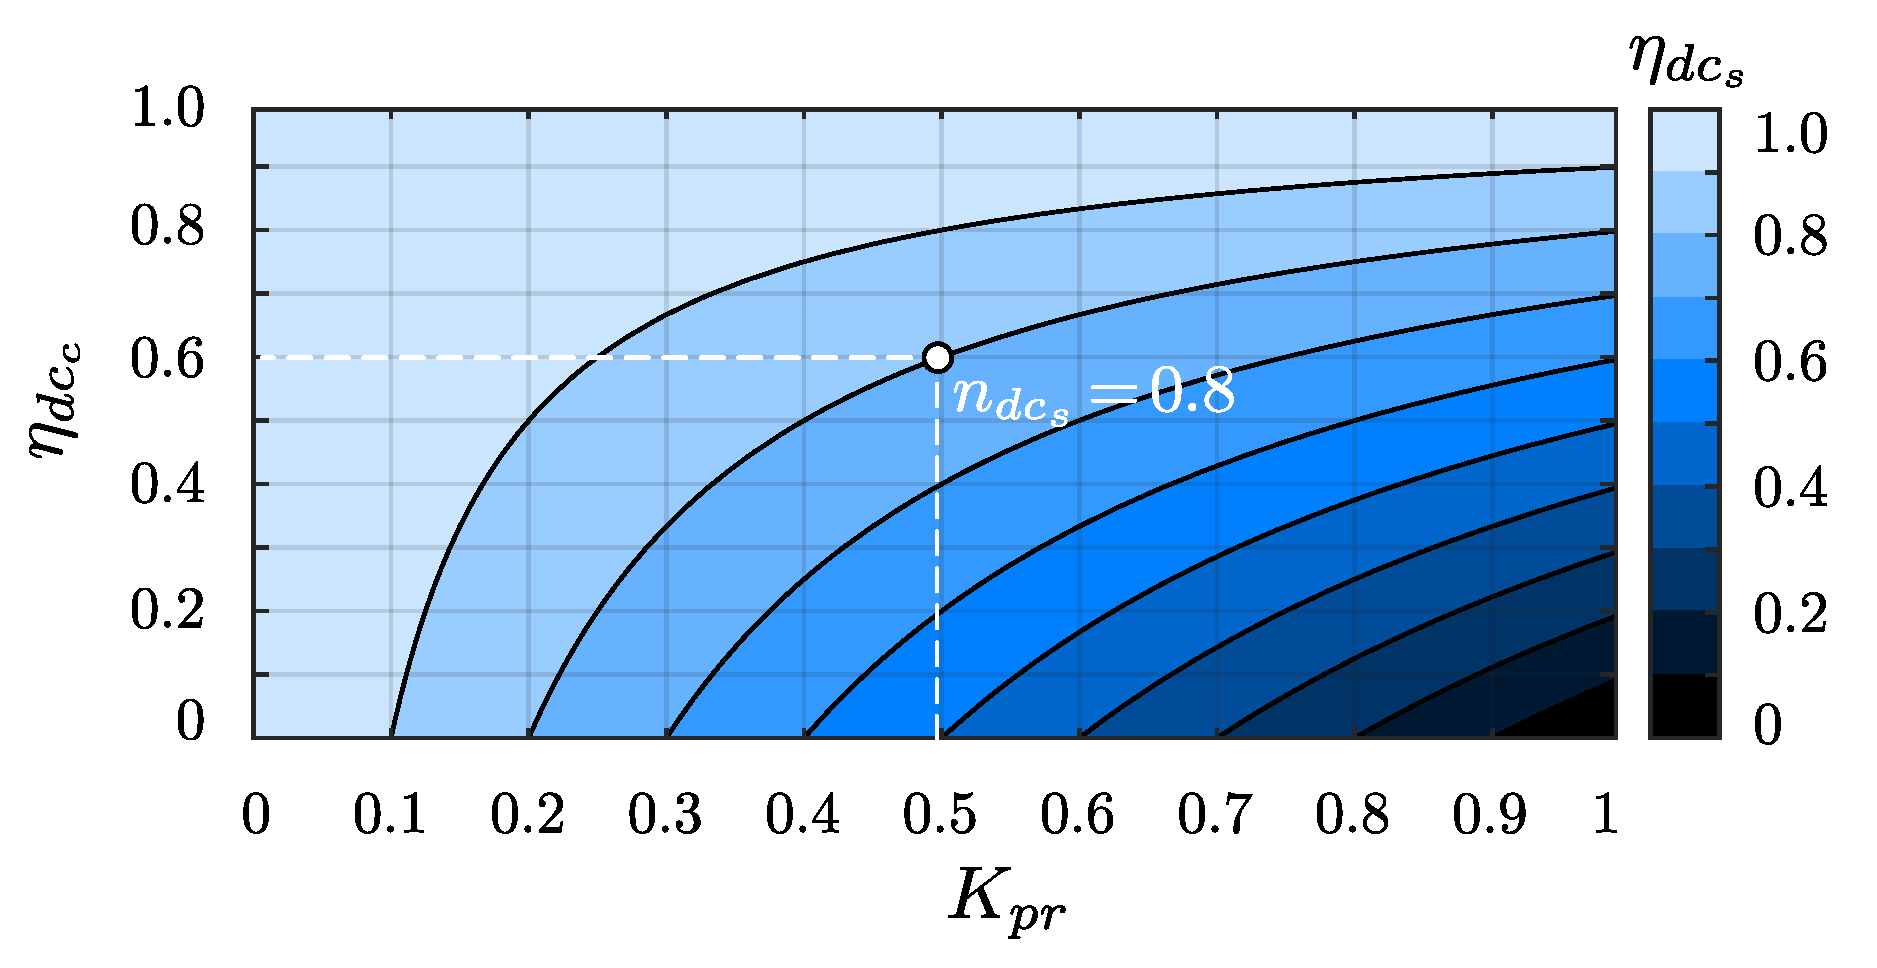
2.1. Efficiency Analysis
Due to the connection used to create the PPC configurations, the power processed by the converter is reduced. It decreases the conversion losses in the dc-stage, increasing the dc-stage conversion efficiency .
As can be seen from (2), the dc-stage efficiency does not depend only of the dc–dc converter efficiency , but also it is affected by the ratio of the power processed by the dc–dc converter . This ratio is a parameter defined as partial power ratio , and it has to be lower than the unity in order to operate in PPC mode. Then the dc-stage conversion efficiency can be expressed as:
Working with a PPC the efficiency of the dc-stage , varies depending on the partial power ratio . If the converter is designed to work with the half of the rated power and it has en efficiency , the efficiency of the dc-stage as depicted in Figure 3. It means that the dc-stage efficiency increases at this condition.
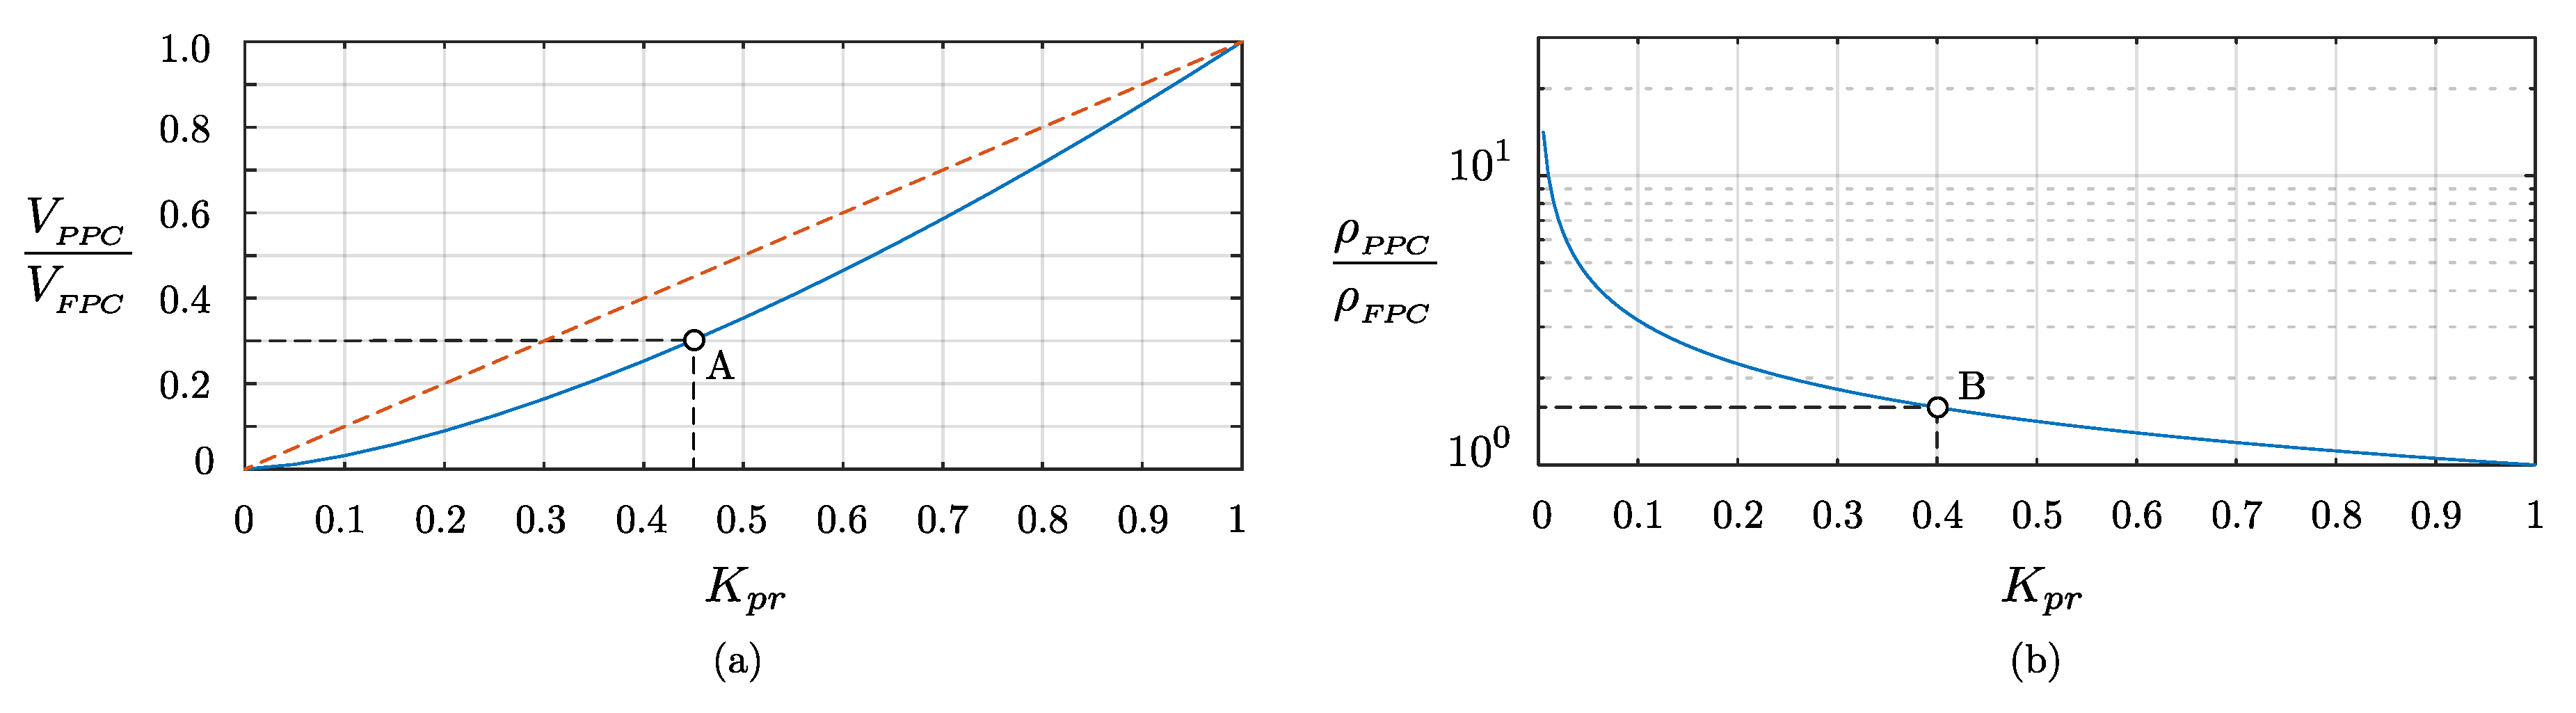
2.2. Volume and Power Density Analysis
The power conversion efficiency of the dc-stage, the volume and the power density are related to the power reduction in the dc–dc converter. The simplest theoretical approach to consider a power electronic system is modeling as a cube [22], where the power losses are dissipated by the surface area which scales with the volume V of the cube as . The power losses can only be dissipated as heat over the surface area of the converter , then the power losses dissipation in the FPC are:
On the other hand, the power losses dissipation in the PPC are:
In order to keep the identical design of the converter and heatsink, holding the same dc–dc converter efficiency, the power losses dissipation is considered as equal for both configurations. Then:
Finally, it is possible to relate the volume variation when the power processed by the converter changes. The equation is expressed as follows:
The result of the volume variation is depicted in Figure 4a. It is possible to notice that the volume variation does not follow a linear trend as the dotted line shown. In fact, by considering the point A, if the converter is sized to handle of the rated power, the volume of the partial power converter is . Thus, the volume of the converter can be greatly reduced by reducing the power handled by the converter.
Moreover, the power density of the converter () is directly related to the power processed per unity of volume, and it can be expressed in terms of the partial power ratio as:
As is depicted in the Figure 4b, the power density increases with the reduction of the power processed by the converter. Considering the point B in the solid line, the converter is sized to handle of the rated power, the density of the partial power converter is .
2.3. Operation Range Analysis
The reduced power processed by the PPC comes from the reduction of the voltage at the converter side , due to the series connection of the voltage sources as depicted in Figure 2. However, based on the consideration that the dc-link voltage is fixed, the required voltage for the MPPT algorithm directly depends on the range of the voltage. It means that the lower voltage at converter side, the reduced MPPT voltage range. Therefore, in order to evaluate the voltage variation of a PV cell in terms of solar irradiation it is required to find a model to relate the PV voltage and current. A explicit solution for the PV current and voltage can be derived using the Lambert’s function. It leads to an efficient model of the PV cell, resulting in significantly reduced calculation times and improved robustness of simulation [23]. The Lambert’s function is defined to be multivalued inverse of the function . Based on this function and the parameters of the single-diode model for a PV cell [24], the PV voltage can be expressed as an explicit function of the PV current as:
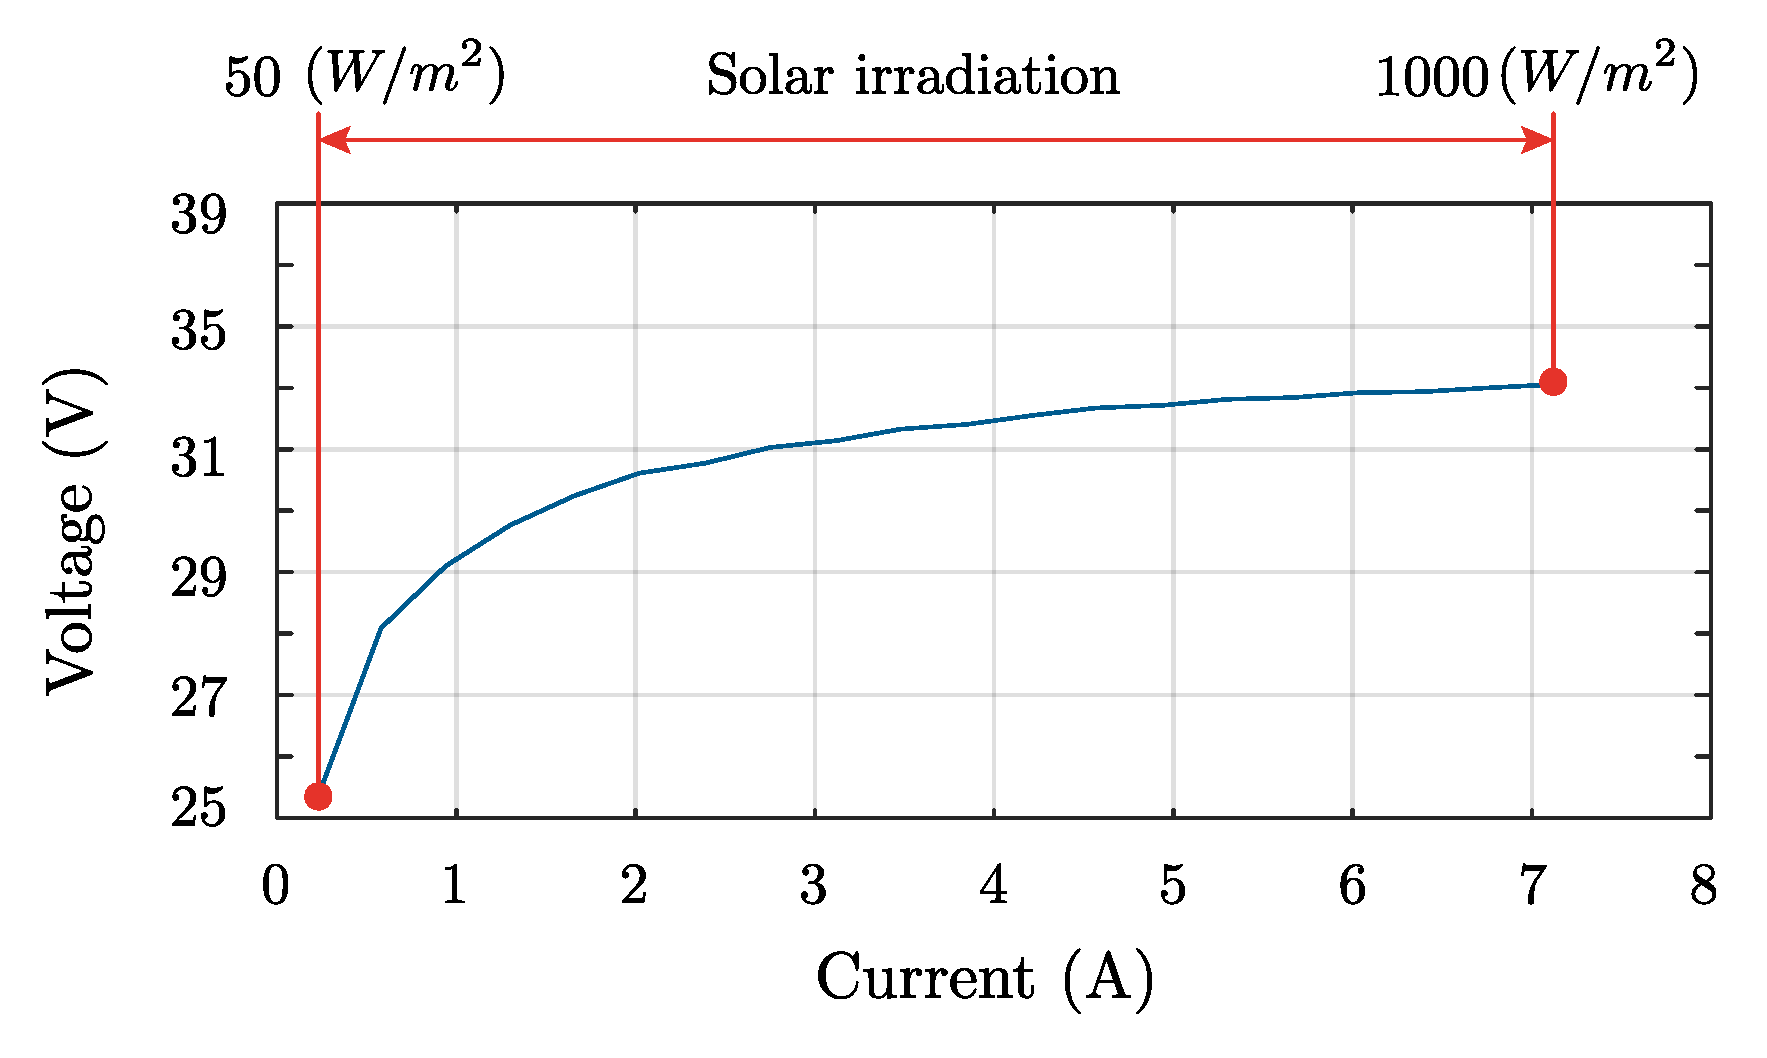
Moreover, in Figure 5 it is possible to see the PV voltage reduction under the reduction of the solar irradiation, in this case a variation between 50–1000 (W/m is made. Under this condition, the obtained results are a PV voltage reduction of the . This result is required as a limitation for the design of the PPC converter, so that it shows the minimum voltage variation needed to operate as a PPC without affecting system performance.
3. Step-Down PPC Circuit Topologies
The buck operation, required to reduce the PV voltage to a level for the grid connection, can be achieved using the PPC configurations depicted in Figure 2. Nowadays, PV string and multistring applications are gaining more relevance in larger power plants, even though they were initially used for small and medium-scale PV systems. Typically isolated dc–dc converter topologies used for these applications, are based on high-frequency isolated Full-bridge converters and resonant converters. For that reason, in this work the full-bridge isolated topology was selected for the PPC configurations, as depicted in Figure 6, but the same analysis can be expanded to other isolated topologies.
3.1. Step-Down PPC Connected at dc-Link Side
Based on the PPC configuration depicted in Figure 2a a step-down operation can be achieved. This connection splits the power at the dc-link side, which allows a voltage reduction at the input side of the dc–dc converter. Then the semiconductor is sized to commute with this reduced voltage.
3.1.1. Partial Power Ratio
In order to define the operation region of the PPC, the partial power ratio , is calculated as:
The partial power ratio varies linearly, depending on the voltage gain as depicted in the dotted line in Figure 7a. Where the shadowed area represents the region of partial power operation.
3.1.2. Analysis of the Topology
Based on the configuration depicted in Figure 6a the voltage gain of the PPC configuration is defined as:
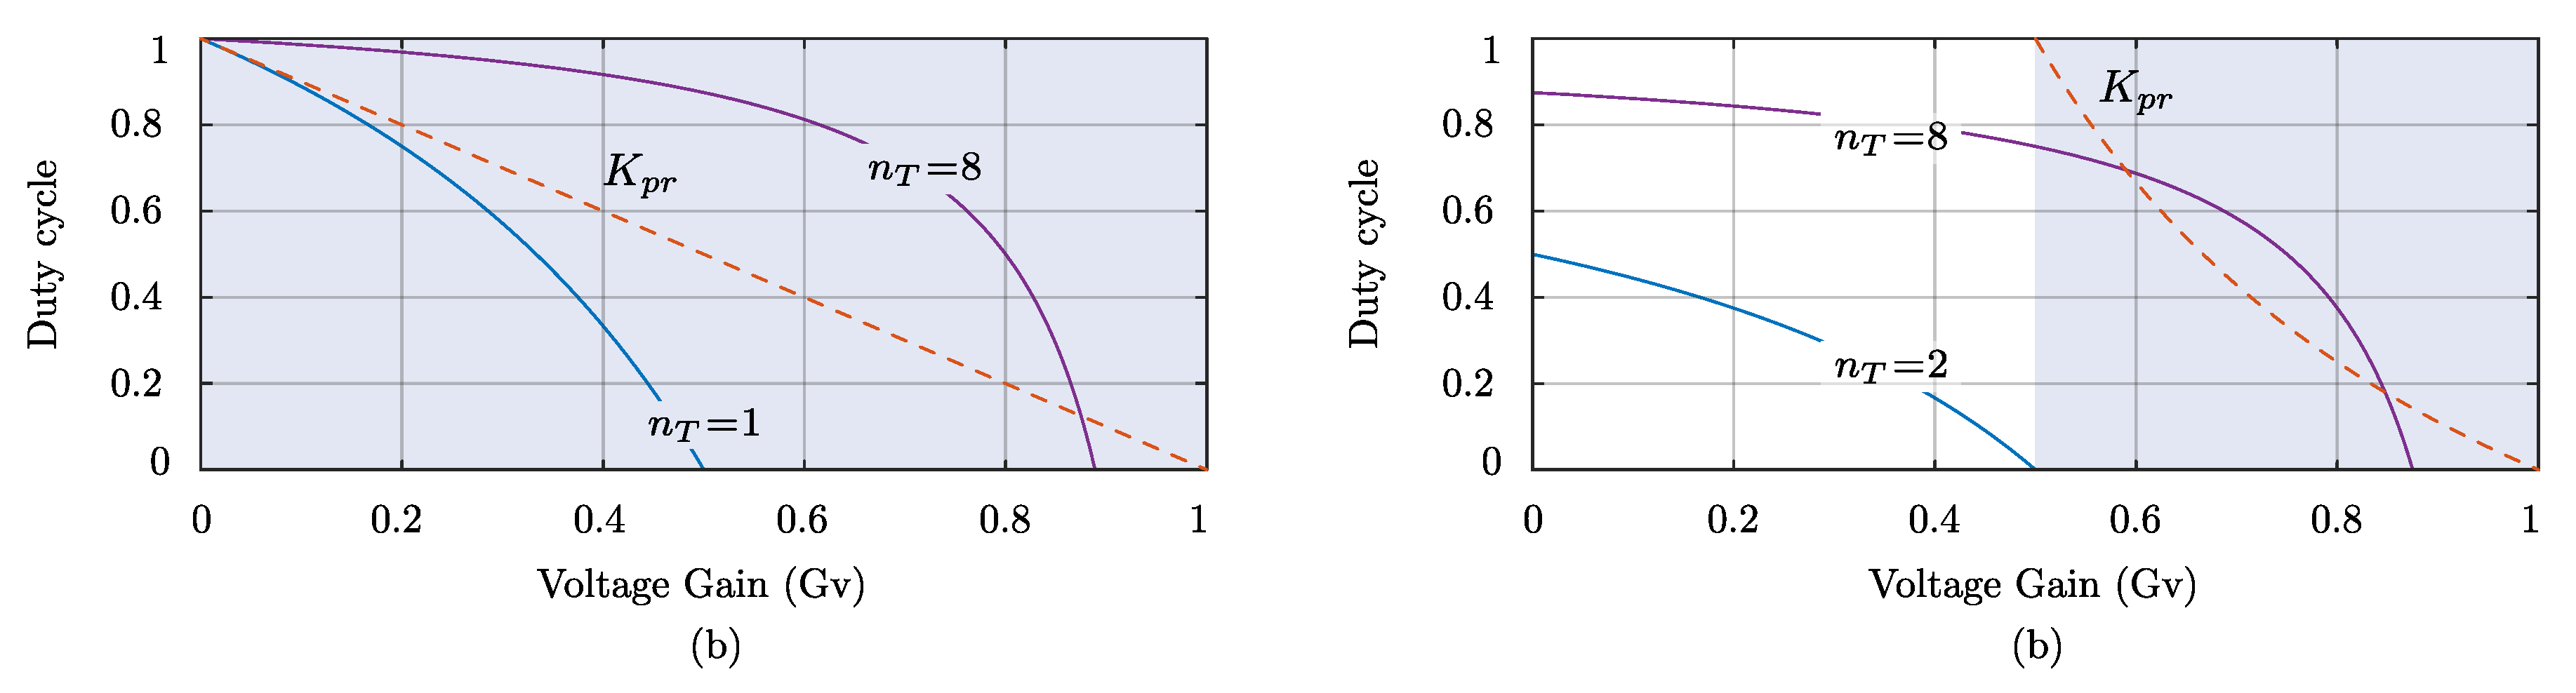
The voltage gain (11) depends on the duty cycle d and the transformer turns ratio . The operation range is depicted in Figure 7a for two different values of the transformer turns ratio, where the shadowed area represents the region of partial power operation.
From this picture it is possible to see that the voltage gain is limited by the turns ratio selection. Considering a voltage gain (e.g., ), the greater turns ratio allows a higher voltage gain. It means that the PV system is designed to operate close to the dc-link voltage, then the partial power ratio is reduced. As an example, in a design where the converter is sized to handle 40% of the nominal power, the voltage is reduced as much the 60% of the input voltage. In that case, using a transformer with turns ratio it is possible to work within a voltage range for the MPPT, between 60 and 90% of the input voltage.
3.2. Step-Down PPC Connected at PV Side
Another connection allowed to achieve a voltage reduction is through the PPC configuration depicted in Figure 2b, where the power splitting is made at the PV-side.
3.2.1. Partial Power Ratio
In that case, the partial power ratio is expressed as:
Considering that the dc-stage is highly efficiency , the partial power ratio varies depending on the voltage gain as depicted in Figure 2b. Where the shadowed area represents the region of partial power operation. Notice that in contrast with the step-down PPC configuration connected at dc-link side, this partiality ratio is limited by the voltage gain, as can be seen in the figure the minimum value is limited to the half of the input voltage.
3.2.2. Analysis of the Topology
Based on the configuration depicted in Figure 6b the voltage gain of the PPC configuration is defined as:
Moreover, the operation range is depicted in Figure 7b, where the shadowed area represents the region of partial power operation. From this picture it is possible to see that the duty cycle and the partiality ratio are limited by the turns ratio selection and the voltage gain. This is the motivation to select the step-down PPC configuration connected at dc-link side to be experimentally evaluated. Since this configuration presents more benefits for PV systems.
4. Experimental Validation
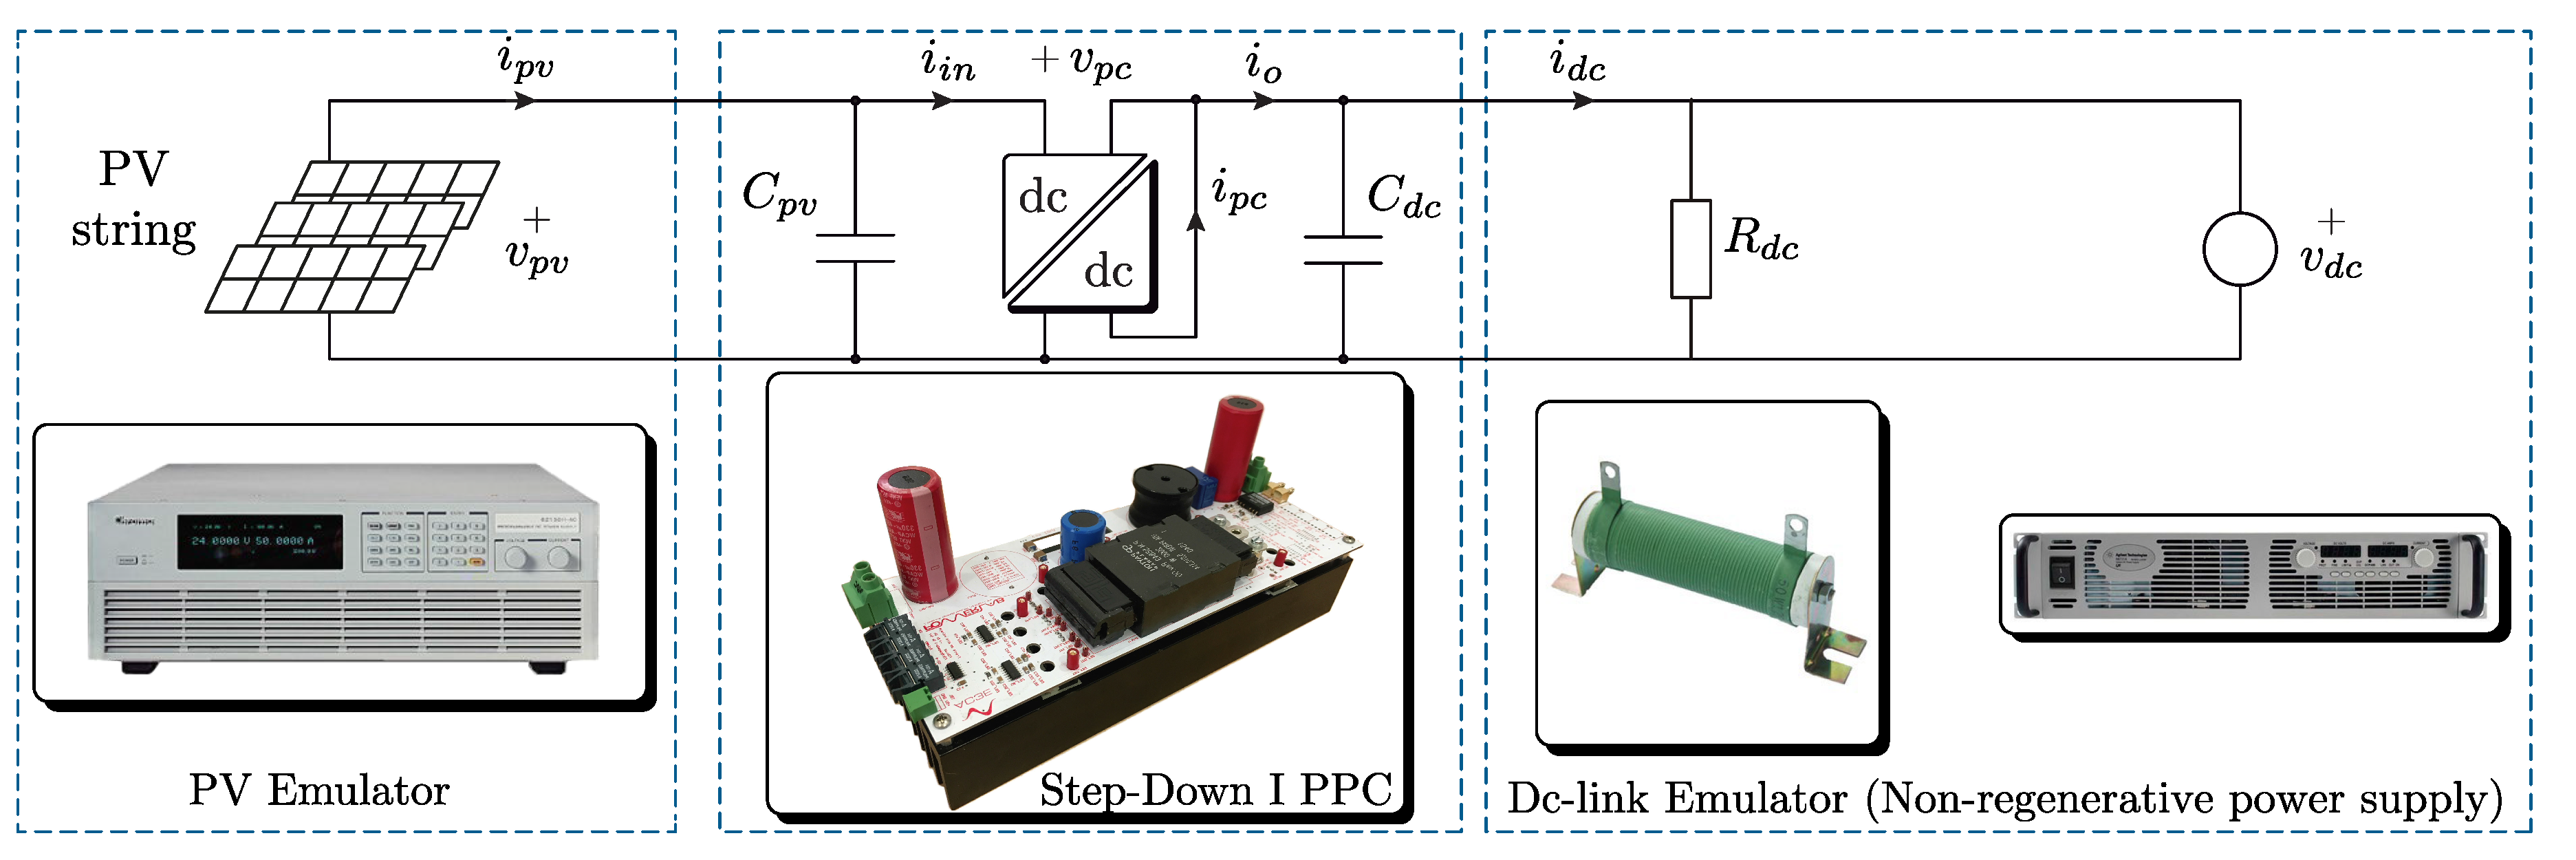
The experimental validation is made for the step-down PPC configuration connected at dc-link side, Figure 6a. It comprises: the correct operation of the power topology used for the construction of the PPC, the functionally of converter evaluating the MPPT algorithm, the analysis of partial operation and the conversion efficiency. The theoretical analysis about the partial power ratio and the conversion efficiency, is validated using an experimental test-bench, as shown in Figure 8. Due to laboratory and components availability, the voltage and power ratings have been scaled from typical applications values. It is because the available commercial HF transformers limit the selection of traditional ratings of power and turn ratios for the corresponding PV applications. However, the theoretical analysis and its validation is still respected, because they are evaluated as power ratios, voltage gains and duty cycles.
For the emulation of the PV system, a programmable dc power supply Chroma 62050H-600S, with Solar Array Simulator is used. A Full-bridge based PPC is built to validate the step-down PPC configuration connected at dc-link side. The control platform is composed by: a dSPACE 1103 being the responsible to control the dc–dc converters, and a FPGA Spartan-3E generating the high-frequency PWM signals. The step-down PPC performs the MPPT algorithm controlling the input voltage, while the output voltage is fixed by a dc power supply Agilent N8762A Technologies, emulating the grid-tied inverter. A resistive load, which is part of this dc-link emulator, is used to dissipate the power delivered by the PV system. The voltage measurements are made using a differential voltage probe Keysight N2790A, 100MHz. A Keysight N2783B, 100 MHz probe is used for the current measurements. The parameters of the experimental test-bench are listed in the Table 1.
4.1. Operation Performance
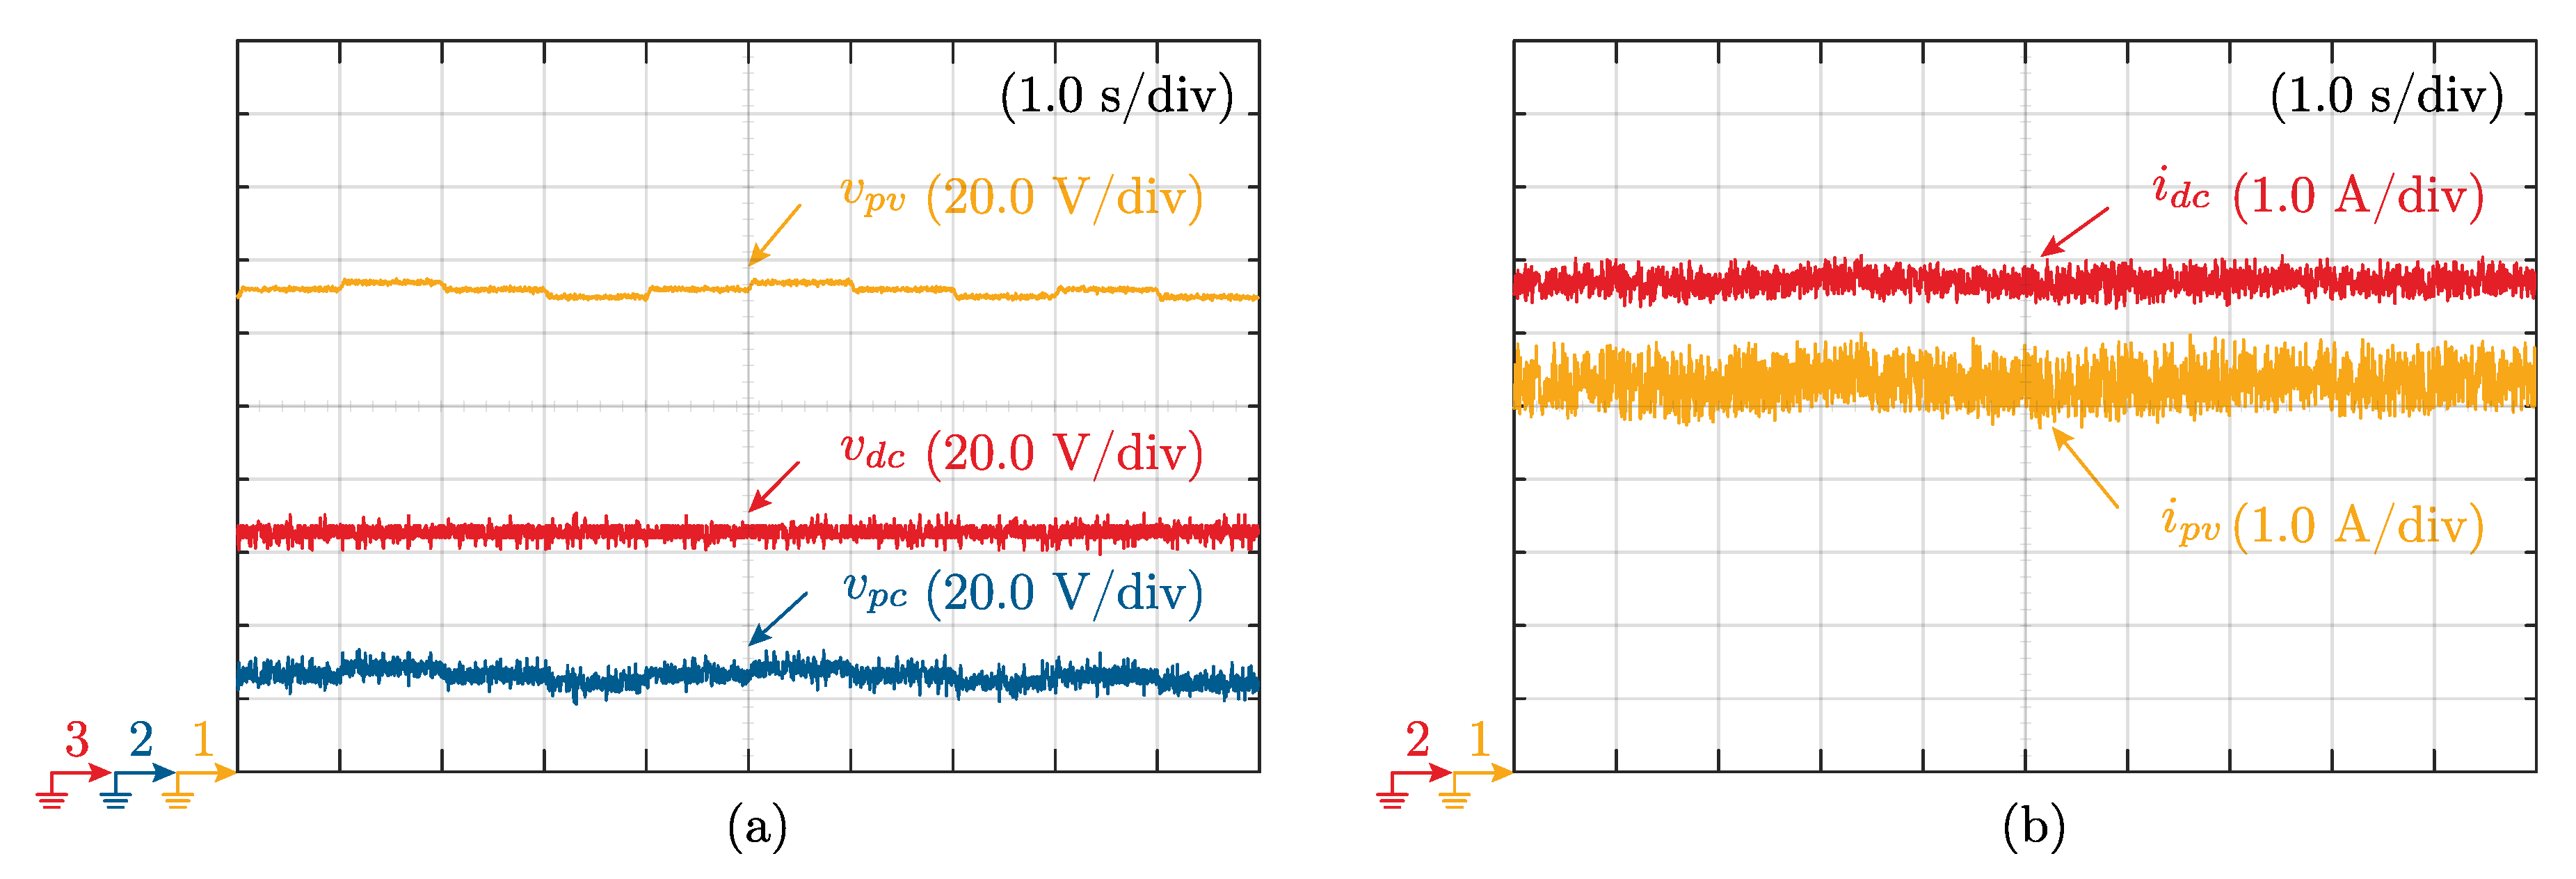
The evaluated parameters under constant solar irradiation are the voltage and current in the system. The voltages are depicted in Figure 9a, where the P&O MPPT algorithm presents the classical three levels. Since the voltage at the dc-link is fixed by the inverter, the converter voltage is the difference between and due to the series connection of the PPC. In that case the step-down operation is depicted in the figure, where the output voltage V is lower than the input voltage V. The voltage of the PPC is V, which is the blocking voltage withstood by the Mosfets, and it is lower than in the case of traditional FPC. It means that the component size is reduced due to the lower voltage rating. The current results are depicted in Figure 9b, where the mean value of the PV currents is A and the output current A. Based on the connection, the current trough the diode bridge is the difference between the PV and output current, then A. This current value is lower compared with a traditional H-bridge based FPC.
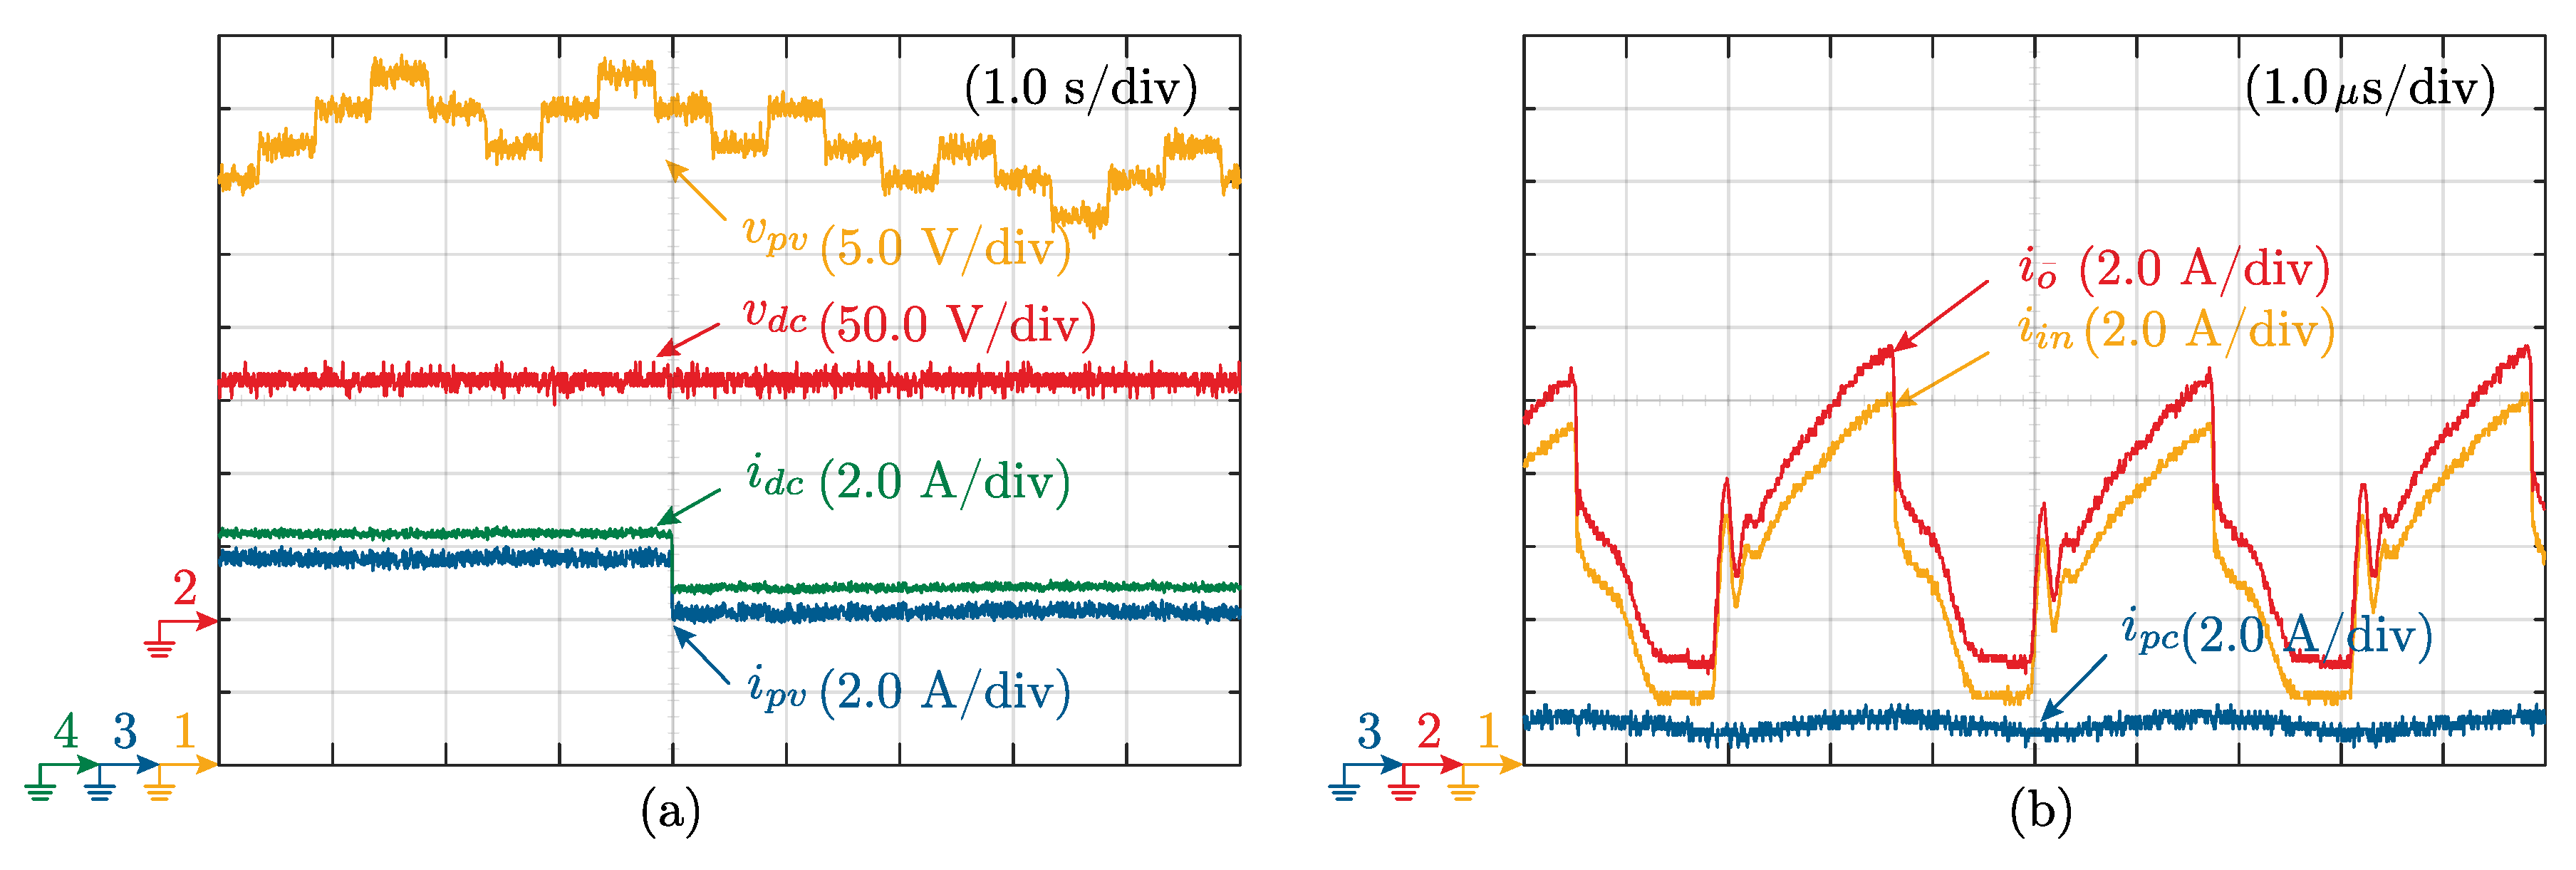
In order to evaluate the performance of the MPPT algorithm, an irradiation reduction to the of the rated value is made. The result is also depicted in Figure 10, where it is possible to see the current reduction when the change is made. Moreover, due to the implemented MPPT algorithm, the PV voltage start decreasing the value in order to find the maximum power point. The stationary value is around V.
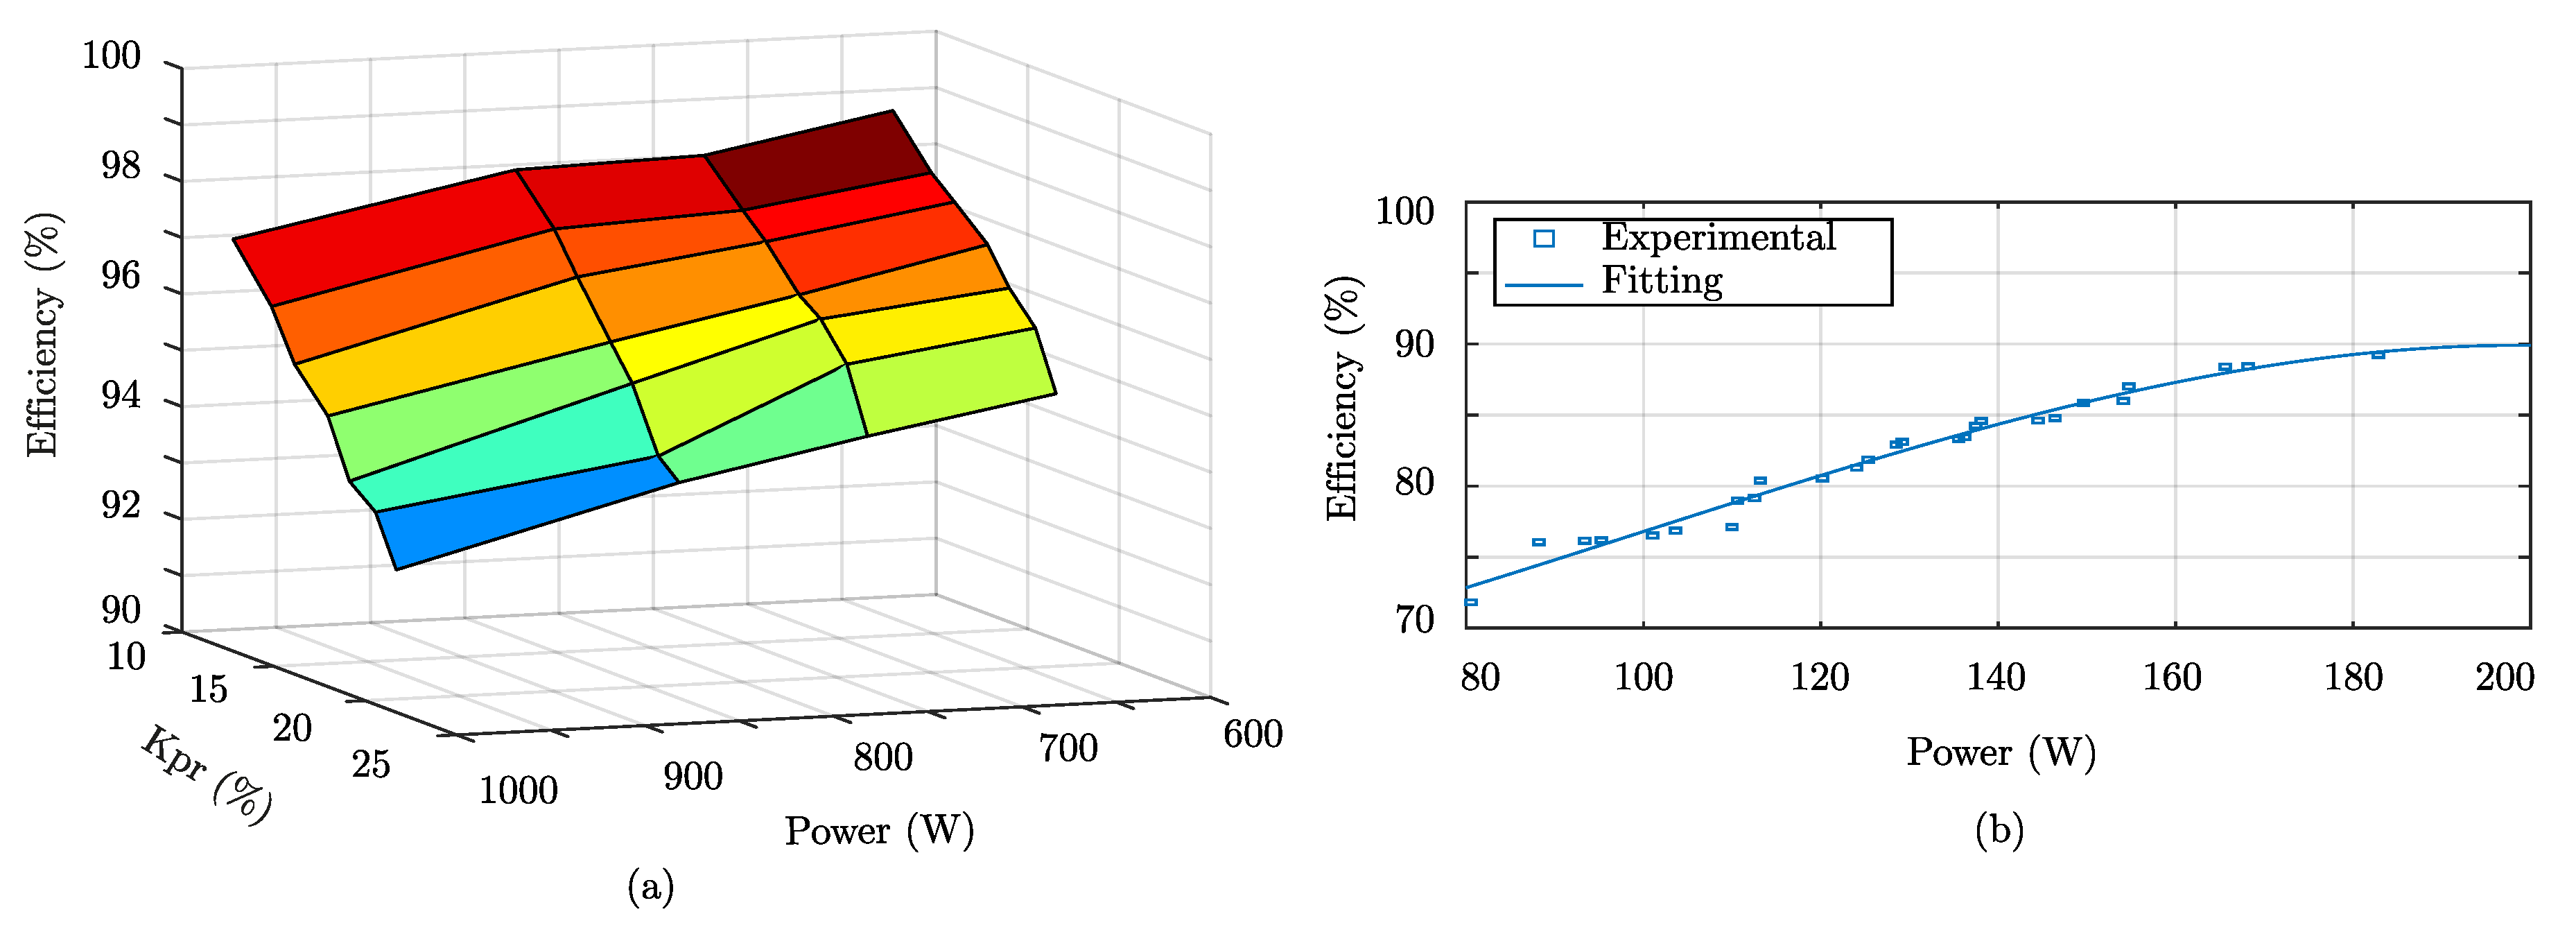
4.2. Efficiency Analysis
The efficiency is calculated using the experimental results of voltage and current, which are taken from the complete dc-stage (PPC), and the isolated Full-bridge dc–dc converter. The experimental efficiency waveforms are depicted in Figure 11. The global system efficiency , is obtained under different power and partial power ratios . These results are based on the measurements at the output side () and the input side (). When the converter is operating below a partiality factor of the total power, the dc-stage efficiency varies between , as depicted in Figure 11a. However, the conversion efficiency of the dc–dc converter varies between , as shown in Figure 11b. The experimental operating points and results, for one of the conducted experiments, are listed in the Table 2.
From the results, the rated PV power is W, but the converter is only handling a of the total power. In this case, the voltage gain of the system is . However, due to the series connection, the PPC voltage is V, which means that the isolated converter has a voltage gain . This deeper voltage reduction impacts on the efficiency reached by the full-bridge converter itself , which is relatively lower than the global system efficiency .
Based on these measurements, it is possible to verify the results using (3). Where the measured efficiency of the dc-stage is , and the theoretical efficiency is . Which gives an error around , validating the hypothesis of the relationship between the increment of the dc-stage efficiency, when the partiality ratio decreases.
It is worth to clarify that in terms of efficiency for the power rating in which they operate, the laboratory prototypes were not optimized in their design. Consequently, it is expected that for industrial developments, which are mainly optimized for a desired power rating, the efficiency results will be improved for the dc–dc converter stages, further improving the global system efficiency.
4.3. Partial Power Ratio
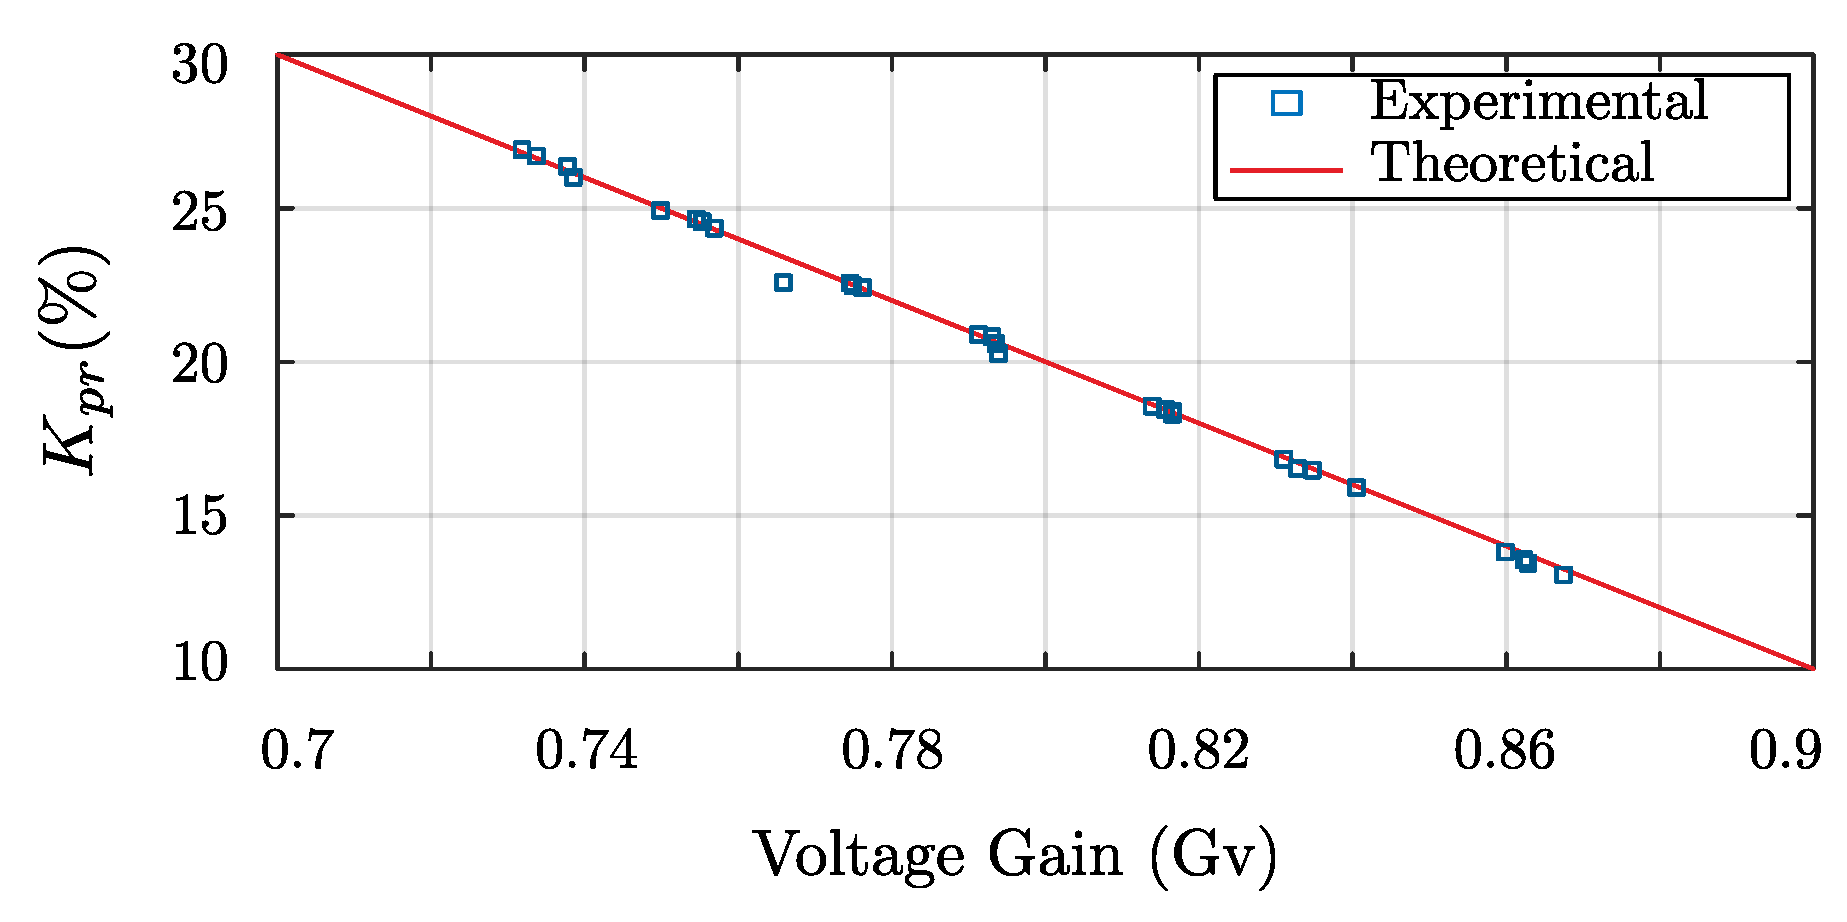
The ratio of power processed by the converter, is evaluated taking the measurements of the voltage and current at the Mosfet bridge. Then the mean values of the measurements are multiplied, in order to obtain the converter power . After that, this value is divided by the input power obtaining the partial power ratio .
The experimental result for the partial power ratio is depicted in Figure 12. The experimental results are shown in the figure with points, and the theoretical value is shown with a continuous line. It can be noticed the linear reduction of when the voltage gain increases. The behavior fits well with the theoretical expression (11). Considering that the PV application is sized to a higher value compared with the dc-link voltage, the input voltage will decrease in case of a reduction of the solar irradiation. It means, that the converter will handle lower power in case of partial shading.
4.4. Voltage Range of Operation
Finally, in order to obtain the PV voltage variation at different irradiation values, the explicit PV voltage expression is implemented using Lambert’s function (9), and working with a PV module Sunmodule SW 250. In this evaluation case, it was emulated a PV string made with 7 PV modules, reaching around a V. From the results obtained by the experiment made in the laboratory, the variation of the PV voltage was V. On the other hand, using (9) it was obtained that the PV voltage variation, when solar irradiation changes from (1000–500 W/m), corresponds to V and the minimum . With this information it is possible to conclude that working with the laboratory prototype, a reduction of the of the STC solar irradiation is allowed to ensure the partial power conversion.
4.5. Comparison between a Step-Down PPC and a Full Bridge Power Converter
In order to make a comparison between a full power converter vs. a partial power converter, a simulation is carried out for an unique operation point. In order to simplify the analysis, the magnetic losses are neglected and the focus is only in terms of the Mosfet and the diode bridge losses. A simulation is carried out for the step-down PPC depicted in the Figure 6a, and a traditional isolated H-bridge converter for the FPC. In order to work around the same operation point, the duty cycle is imposed for both cases , the switching frequency is kHz and the current ripple in the inductor is imposed to . Finally, the PPC is sized to work with a partiality ratio , and the simulation results are listed in the Table 3.
As can be seen in the Table 3, the ratings of the power components are different between both configurations. The Mosfet voltage rate of the FPC is much more higher than the rate of the PPC. It means that the component size will be higher, because it must withstand a higher voltage. Moreover, the power losses on the FPC will increase, as can be seen in the Table 3. It is because the converter is switching at high frequency, with a higher power rating. The losses results are shown in percentage value, so that it represents the power losses with respect to the nominal power .
In the diode bridge it is possible to see a similar behavior, so that in this case the rated current increases for the FPC. Finally, the total conversion efficiency in a PPC is higher than the efficiency in a FPC, which highlights the advantage working with a partial power convert.
5. Conclusions
This work presents a step-down PPC for a PV string system, analyzing the range of the partial power operation when an isolated Full-bridge topology is selected to make the PPC configuration. The results show that the converter is capable of retaining the MPPT performance, despite of the reduced amount of power processed by itself. It was evaluated using an experimental prototype, and it was contrasted with the explicit model of the PV cell.
This work shows that the partiality ratio is related to the voltage difference between the PV voltage and the dc-link voltage. Besides, this partiality ratio combined with the turn ratio of the transformer and the selected topology, all of them impact the system efficiency. Moreover, the relationship between the voltage gain and the partial power ratio has been experimentally obtained. It clarifies the benefit working with large PV strings, so that in case of the reduction of the solar irradiation, the PV voltage will decrease reaching a voltage gain close to the unity, which is translated into a lower partial power ratio and a higher efficiency.
The partial power processing technique allows a reduction of the converter volume, also increasing the power density as was analyzed based on the theoretical model. It does not depend of the converter topology, and compared with a traditional FPC, the cost could decrease because of the smaller rated semiconductors and smaller heat-sinks.
Author Contributions
J.W.Z. conceived, designed and performed the experimental evaluations; S.K. provided insight on the problem definition and conceptual solution, and was responsible of supervision throughout the work; G.C. was part of the development team of the experimental test-bench, and T.A.M. was responsible for guidance and a number of key suggestions.
Funding
This research was funded by CONICYT-PCHA/Doctorado Nacional/2016-21160863, by FONDECYT 1171823, AC3E (CONICYT/Basal/FB0008), SERC Chile (CONICYT/FONDAP/15110019), and CONICYT REDES 170217.
Conflicts of Interest
The authors declare no conflict of interest.
References
- Muñoz Cruzado-Alba, J.; Rojas, C.A.; Kouro, S.; Galván Díez, E. Power Production Losses Study by Frequency Regulation in Weak-Grid-Connected Utility-Scale Photovoltaic Plants. Energies 2016, 9, 317. [Google Scholar] [CrossRef]
- Kasper, M.; Bortis, D.; Kolar, J.W. Classification and Comparative Evaluation of PV Panel-Integrated DC/DC Converter Concepts. IEEE Trans. Power Electron. 2014, 29, 2511–2526. [Google Scholar] [CrossRef]
- Huawei. Smart String Inverter SUN2000-105KTL-H1. 2018. Available online: http://solar.huawei.com/eu.
- Serban, E.; Ordonez, M.; Pondiche, C. DC-Bus Voltage Range Extension in 1500 V Photovoltaic Inverters. IEEE J. Emerg. Sel. Top. Power Electron. 2015, 3, 901–917. [Google Scholar] [CrossRef]
- Serban, E.; Paz, F.; Ordonez, M. Improved PV Inverter Operating Range Using a Miniboost. IEEE Trans. Power Electron. 2017, 32, 8470–8485. [Google Scholar] [CrossRef]
- Gkoutioudi, E.; Bakas, P.; Marinopoulos, A. Comparison of PV systems with maximum DC voltage 1000V and 1500V. In Proceedings of the 2013 IEEE 39th Photovoltaic Specialists Conference (PVSC), Tampa, FL, USA, 16–21 June 2013; pp. 2873–2878. [Google Scholar] [CrossRef]
- Inzunza, R.; Okuyama, R.; Tanaka, T.; Kinoshita, M. Development of a 1500Vdc photovoltaic inverter for utility-scale PV power plants. In Proceedings of the 2015 IEEE 2nd International Future Energy Electronics Conference (IFEEC), Taipei, Taiwan, 1–4 November 2015; pp. 1–4. [Google Scholar] [CrossRef]
- Zapata, J.W.; Kouro, S.; Carrasco, G.; Renaudineau, H. Step-Up Partial Power DC-DC Converters for Two-Stage PV Systems with Interleaved Current Performance. Energies 2018, 11, 357. [Google Scholar] [CrossRef]
- Morrison, A.; Zapata, J.W.; Kouro, S.; Perez, M.A.; Meynard, T.A.; Renaudineau, H. Partial power DC-DC converter for photovoltaic two-stage string inverters. In Proceedings of the 2016 IEEE Energy Conversion Congress and Exposition (ECCE), Milwaukee, WI, USA, 18–22 September 2016; pp. 1–6. [Google Scholar] [CrossRef]
- Kouro, S.; Leon, J.; Vinnikov, D.; Franquelo, L. Grid-Connected Photovoltaic Systems: An Overview of Recent Research and Emerging PV Converter Technology. IEEE Ind. Electron. Mag. 2015, 9, 47–61. [Google Scholar] [CrossRef]
- Button, R.M. An advanced photovoltaic array regulator module. In Proceedings of the 31st Intersociety Energy Conversion Engineering Conference, IECEC 96, Washington, DC, USA, 11–16 August 1996; Volume 1, pp. 519–524. [Google Scholar] [CrossRef]
- Min, B.D.; Lee, J.P.; Kim, J.H.; Kim, T.J.; Yoo, D.W.; Song, E.H. A New Topology With High Efficiency Throughout All Load Range for Photovoltaic PCS. IEEE Trans. Ind. Electron. 2009, 56, 4427–4435. [Google Scholar] [CrossRef]
- Lee, J.P.; Min, B.D.; Kim, T.J.; Yoo, D.W.; Yoo, J.Y. A Novel Topology for Photovoltaic DC/DC Full-Bridge Converter With Flat Efficiency Under Wide PV Module Voltage and Load Range. IEEE Trans. Ind. Electron. 2008, 55, 2655–2663. [Google Scholar] [CrossRef]
- Zapata, J.W.; Kouro, S.; Carrasco, G.; Renaudineau, H.; Meynard, T.A. Analysis of Partial Power DC-DC Converters for Two-Stage Photovoltaic Systems. IEEE J. Emerg. Sel. Top. Power Electron. 2018, 1. [Google Scholar] [CrossRef]
- Zientarski, J.R.R.; da Silva Martins, M.L.; Pinheiro, J.R.; Hey, H.L. Series-Connected Partial-Power Converters Applied to PV Systems: A Design Approach Based on Step-Up/Down Voltage Regulation Range. IEEE Trans. Power Electron. 2018, 33, 7622–7633. [Google Scholar] [CrossRef]
- Zhao, J.; Yeates, K.; Han, Y. Analysis of high efficiency DC/DC converter processing partial input/output power. In Proceedings of the IEEE 14th Workshop on Control and Modeling for Power Electronics (COMPEL), Salt Lake City, UT, USA, 23–26 June 2013; pp. 1–8. [Google Scholar] [CrossRef]
- Zapata, J.W.; Renaudineau, H.; Kouro, S.; Perez, M.A.; Meynard, T.A. Partial power DC-DC converter for photovoltaic microinverters. In Proceedings of the 42nd Annual Conference of the IEEE Industrial Electronics Society, IECON 2016, Florence, Italy, 23–26 October 2016; pp. 6740–6745. [Google Scholar] [CrossRef]
- Kim, H.; Kim, J.; Kim, H.; Lee, K.; Kim, J.; Yoo, D.; Shin, D. A high efficiency photovoltaic module integrated converter with the asymmetrical half-bridge flyback converter. Sol. Energy 2010, 84, 1376–1381. [Google Scholar] [CrossRef]
- Harfman-Todorovic, M.; Tao, F.; Agamy, M.; Dong, D.; Liu, X.; Garces, L.; Zhou, R.; Delgado, E.; Marabell, D.; Stephens, C.; et al. A high efficiency PV micro-inverter with grid support functions. In Proceedings of the 2014 IEEE Energy Conversion Congress and Exposition (ECCE), Pittsburgh, PA, USA, 14–18 September 2014; pp. 4244–4250. [Google Scholar] [CrossRef]
- Marzouk, A.D.; Fournier-Bidoz, S.; Yablecki, J.; McLean, K.; Trescases, O. Analysis of partial power processing distributed MPPT for a PV powered electric aircraft. In Proceedings of the 2014 International Power Electronics Conference (IPEC-Hiroshima 2014—ECCE ASIA), Hiroshima, Japan, 18–21 May 2014; pp. 3496–3502. [Google Scholar] [CrossRef]
- Zhou, H.; Zhao, J.; Han, Y. PV Balancers: Concept, Architectures, and Realization. IEEE Trans. Power Electron. 2015, 30, 3479–3487. [Google Scholar] [CrossRef]
- Kasper, M.; Bortis, D.; Kolar, J.W. Scaling and balancing of multi-cell converters. In Proceedings of the 2014 International Power Electronics Conference (IPEC-Hiroshima 2014—ECCE ASIA), Hiroshima, Japan, 18–21 May 2014; pp. 2079–2086. [Google Scholar] [CrossRef]
- Jain, A.; Sharma, S.; Kapoor, A. Solar cell array parameters using Lambert W-function. Sol. Energy Mater. Sol. Cells 2006, 90, 25–31. [Google Scholar] [CrossRef]
- Shongwe, S.; Hanif, M. Comparative Analysis of Different Single-Diode PV Modeling Methods. IEEE J. Photovolt. 2015, 5, 938–946. [Google Scholar] [CrossRef]
Figure 1.
Diagram of the power flow in a PV system: (a) With a full power converter (FPC). (b) With a partial power converter (PPC).
Figure 1.
Diagram of the power flow in a PV system: (a) With a full power converter (FPC). (b) With a partial power converter (PPC).

Figure 2.
Step-down converter. (a) Partial power connection at dc-link side; (b) Partial power connection at PV side.
Figure 2.
Step-down converter. (a) Partial power connection at dc-link side; (b) Partial power connection at PV side.

Figure 3.
Dc-stage efficiency in a PPC in terms of the partial power ratio .

Figure 4.
Volume of the dc–dc converter. (a) Working with a full power converter; (b) Working with a partial power converter.
Figure 4.
Volume of the dc–dc converter. (a) Working with a full power converter; (b) Working with a partial power converter.

Figure 5.
PV voltage variation in terms of the PV current variation under different solar irradiation.
Figure 5.
PV voltage variation in terms of the PV current variation under different solar irradiation.

Figure 6.
Full-bridge isolated dc–dc topology for the proposed: (a) Step-down PPC connected at dc-link side; (b) Step-down PPC connected at PV-side.
Figure 6.
Full-bridge isolated dc–dc topology for the proposed: (a) Step-down PPC connected at dc-link side; (b) Step-down PPC connected at PV-side.

Figure 7.
Operation of the step-down PPC in terms of the transformer turns ratio and the voltage gain . (a) Step-down PPC dc-link side connected; (b) Step-down PPC PV-side connected.
Figure 7.
Operation of the step-down PPC in terms of the transformer turns ratio and the voltage gain . (a) Step-down PPC dc-link side connected; (b) Step-down PPC PV-side connected.

Figure 8.
Experimental test-bench of the step-down PPC connected at dc-link side, using a full-bridge topology for string inverter applications.
Figure 8.
Experimental test-bench of the step-down PPC connected at dc-link side, using a full-bridge topology for string inverter applications.

Figure 9.
Experimental results under constant solar irradiation. (a) Voltage waveforms at the PV side, dc-link side and converter voltage; (b) Input and output current waveforms.
Figure 9.
Experimental results under constant solar irradiation. (a) Voltage waveforms at the PV side, dc-link side and converter voltage; (b) Input and output current waveforms.

Figure 10.
Experimental results under a solar irradiation reduction. (a) Voltage and current waveforms; (b) Current waveforms in the step-down Full-bridge based PPC.
Figure 10.
Experimental results under a solar irradiation reduction. (a) Voltage and current waveforms; (b) Current waveforms in the step-down Full-bridge based PPC.

Figure 11.
Experimental efficiency curves for: (a) Step-down Full-bridge based PPC, for string inverter; (b) Isolated dc–dc full-bridge converter.
Figure 11.
Experimental efficiency curves for: (a) Step-down Full-bridge based PPC, for string inverter; (b) Isolated dc–dc full-bridge converter.

Figure 12.
Experimental result of the partial power ratio for the step-down Full-bridge based PPC under the variation of the voltage gain.
Figure 12.
Experimental result of the partial power ratio for the step-down Full-bridge based PPC under the variation of the voltage gain.


Table 1.
Parameters of the step-down PPC with a full-bridge topology.
| Parameter | Symbol | Value |
|---|---|---|
| PV power | kW | |
| PV voltage | 230 V | |
| PV side capacitance | 330 F | |
| Clamping capacitance | 47 F | |
| Dc side capacitance | 330 F | |
| Transformer turns ratio | 8 | |
| Switching frequency | 80 kHz | |
| Resistive load | 28 |
Table 2.
Experimental results obtained for a particular evaluation point.
| Parameters | Step-Down | Parameters | Step-Down |
|---|---|---|---|
| System Power (W) | 822 | Converter voltage (V) | 29 |
| Dc-dc Power (W) | 110.1 | Global Voltage gain | 0.84 |
| 13.4 | Dc-dc Voltage gain | 0.19 | |
| PV voltage (V) | 182 | Global efficiency (%) | 97.5 |
| Dc-link voltage (V) | 153 | Dc-dc efficiency | 78.9 |
Table 3.
Simulation results for a step-down PPC and an isolated H-bridge FPC.
| Parameters | Step-Down PPC | Step-Down FPC | Parameters | Step-Down PPC | Step-Down FPC |
|---|---|---|---|---|---|
| 800 W | 800 W | 25 V | 177 V | ||
| 177 V | 177 V | A | A | ||
| 25 V | - | 200 V | 177 V | ||
| 152 V | 152 V | A | A | ||
| A | A | ||||
| A | - | ||||
| A | A |
© 2019 by the authors. Licensee MDPI, Basel, Switzerland. This article is an open access article distributed under the terms and conditions of the Creative Commons Attribution (CC BY) license (http://creativecommons.org/licenses/by/4.0/).
Share and Cite
MDPI and ACS Style
Zapata, J.W.; Kouro, S.; Carrasco, G.; Meynard, T.A. Step-Down Partial Power DC-DC Converters for Two-Stage Photovoltaic String Inverters. Electronics 2019, 8, 87. https://doi.org/10.3390/electronics8010087
AMA Style
Zapata JW, Kouro S, Carrasco G, Meynard TA. Step-Down Partial Power DC-DC Converters for Two-Stage Photovoltaic String Inverters. Electronics. 2019; 8(1):87. https://doi.org/10.3390/electronics8010087
Chicago/Turabian StyleZapata, Jaime Wladimir, Samir Kouro, Gonzalo Carrasco, and Thierry A. Meynard. 2019. "Step-Down Partial Power DC-DC Converters for Two-Stage Photovoltaic String Inverters" Electronics 8, no. 1: 87. https://doi.org/10.3390/electronics8010087
Note that from the first issue of 2016, this journal uses article numbers instead of page numbers. See further details here.