Has ‘Too Big To Fail’ Been Solved? A Longitudinal Analysis of Major U.S. Banks

School of Business, University of Redlands, Redlands, CA 92373, USA
*
Author to whom correspondence should be addressed.
J. Risk Financial Manag. 2019, 12(1), 24; https://doi.org/10.3390/jrfm12010024
Submission received: 29 November 2018
/
Revised: 16 January 2019
/
Accepted: 25 January 2019
/
Published: 1 February 2019
(This article belongs to the Special Issue Financial Crises, Macroeconomic Management, and Financial Regulation)
Abstract
:In the wake of the global financial crisis that erupted in 2008, there has been extensive commentary and regulatory focus on the ‘Too Big to Fail’ issue. In this paper, we survey the proposed solutions and regulatory initiatives that have been undertaken. We conduct a longitudinal analysis of major U.S. banks in four discrete time periods: pre-crisis (2005–2007), crisis (2008–2010), post-crisis (2011–2013) and normalcy (2014–2016). We find that risk metrics such as leverage and volatility which spiked during the crisis have reverted to pre-crisis levels and there has been improvement in the proportion of equity capital available to cushion against asset value deterioration. However, banks have grown in size and it does not appear as if their business models have been redirected toward more traditional lending activities. We believe that it is premature to conclude that ‘Too Big to Fail” has been solved, but macro-prudential regulation is now much more effective and, consequently, banks are on a considerably sounder footing since the depths of the crisis.
JEL Classification:
G01; G21; G28; G32; E58; E61; L51; M481. Introduction
In testimony before the Financial Crisis Inquiry Commission in 2010, then Federal Reserve chair Ben Bernanke stated: “A too-big-to-fail firm is one whose size, complexity, interconnectedness, and critical functions are such that, should the firm go unexpectedly into liquidation, the rest of the financial system and the economy would face severe adverse consequences. Governments provide support to too-big-to-fail firms in a crisis not out of favoritism or particular concern for the management, owners, or creditors of the firm, but because they recognize that the consequences for the broader economy of allowing a disorderly failure greatly outweigh the costs of avoiding the failure in some way.”1
In his letter to shareholders, contained in JPMorgan Chase’s 2016 annual report, Chairman and CEO Jaime Dimon asserted: “Essentially Too Big to Fail has been solved—taxpayers will not pay if a bank fails.”2 In contrast, Sarin and Summers (2016, p. 1) express concerns that despite various regulatory initiatives to rein in excessive risk taking “financial market information provides little support for the view that major institutions are significantly safer than they were before the crisis and some support for the notion that risks have actually increased. This does not make a case against the regulatory approaches that have been pursued, but does caution against complacency.”3
Given this clear divergence of views, we survey the proposed solutions to Too Big to Fail (TBTF) that have been suggested by economic commentators, academics, politicians, and policymakers as well as the various legislative/regulatory initiatives that have emerged since the crisis.4 Our objective is to gain an understanding of the dimensions along which the TBTF issue has been addressed and to that end we carry out a longitudinal analysis of major U.S. banks in four discrete time periods: pre-crisis (2005–2007), crisis (2008–2010), post-crisis (2011–2013) and normalcy (2014–2016). We focus on twelve U.S. banks classified into three tiers: top (JPMorgan Chase, Bank of America, Citigroup, Wells Fargo)5, middle (Bank of New York Mellon, State Street, US Bancorp, PNC Financial Services Group)6 and low (Capital One Financial, BB&T, SunTrust Banks, Regions Financial). The reason for this bifurcation is because they face a descending level of regulatory scrutiny based on their total assets. It is worth noting that the largest (JPMorgan Chase) and smallest (Regions Financial) banks had average total assets during the normalcy period of $2.5 trillion and $124 billion respectively.
The proposed solutions to TBTF have broadly encompassed four areas: (a) the breakup of big banks (b) require banks to fund their assets with a higher proportion of equity capital; or more broadly defined: Tier-1 capital (c) nudge/regulate banks away from riskier practices and (d) various other ideas such as streamlining resolution of failing banks (living wills), more rigorous monitoring (stress tests) and the like.
Our analysis uncovers a number of insights. For instance, we find that risk metrics such as leverage and volatility which had spiked during the crisis have reverted close to pre-crisis levels and there has been improvement in the proportion of equity capital available to cushion against asset value deterioration. However, banks have grown in size and it does not appear as if their business models have been markedly redirected toward more traditional lending activities. There has been notable progress in developing real time monitoring measures of systemic risk7 as well as major legislation8 in the direction of re-regulating the finance sector and TBTF firms.
In the next section, we sketch out the proposals made to address the TBTF issue and related findings from our analysis of major U.S. banks. The final section contains concluding remarks.
2. Proposed Solutions, Regulatory Initiatives, and Analysis of Major U.S. Banks
2.1. Breakup of Big Banks
A number of prominent academics have urged the breakup solution. These include Simon Johnson, Professor at MIT’s Sloan School of Management and former chief economist at the IMF. A coauthored book (Johnson and Kwak 2011) that was written after the crisis “charts the rise to power of the financial sector and forcefully argues that we must break up the big banks if we want to avoid future financial catastrophes.” He has also argued his case in opinion pieces written for outlets such as the New York Times and Project Syndicate.9 Joseph Stiglitz, Professor at Columbia University and recipient of the Nobel prize in economics, has stated in testimony before the U.S. Congress: “… we have little to lose, and much to gain, by breaking up these behemoths, which are not just too big to fail, but also too big to save and too big to manage.”10
Some U.S. politicians have paid attention. Sen. Bernie Sanders introduced legislation to break up the nation’s biggest banks and risky financial institutions in order to safeguard the economy and prevent another costly taxpayer bailout. Rep. Brad Sherman will introduce a companion bill in the House. The press release, dated 3 October 2018, states: “Today the six largest banks in America control assets equivalent to more than half the country’s GDP and the four largest banks are on average about 80 percent larger today than they were before the bailout. The legislation introduced Wednesday would cap the size of the largest financial institutions so that a company’s total exposure is no more than 3 percent of GDP, about $584 billion today.”11
There are pros and cons associated with the breakup solution. The main pro is obviously that if banks are not too large in size, an individual failure need not be catastrophic for the economy and taxpayer funded bailouts will be unnecessary (or at least less costly). The counter argument is that banks are highly interconnected and there will be contagion even in the event of a moderately sized bank failure. For instance, both Bear Stearns and Lehman Brothers were second-tier investment banks and while the former was merged with JPMorgan Chase with backstops provided by the Federal Reserve, the latter was allowed to fail and arguably that event became the trigger for the crisis. Other cons are that economies of scale12 will be drastically reduced which might increase the cost of borrowing in the economy and perhaps, more importantly, inhibit crucial services such as cash management, swaps and derivatives, foreign exchange, etc., to large corporate customers. Also, international coordination will be essential. Breaking up just U.S. banks will amount to unilateral disarmament if the big international players such as Deutsche Bank (Germany), Barclays (U.K.), BNP Paribas (France), Mitsubishi (Japan), and Bank of China, to name a few, are permitted to operate without comparable downsizing.
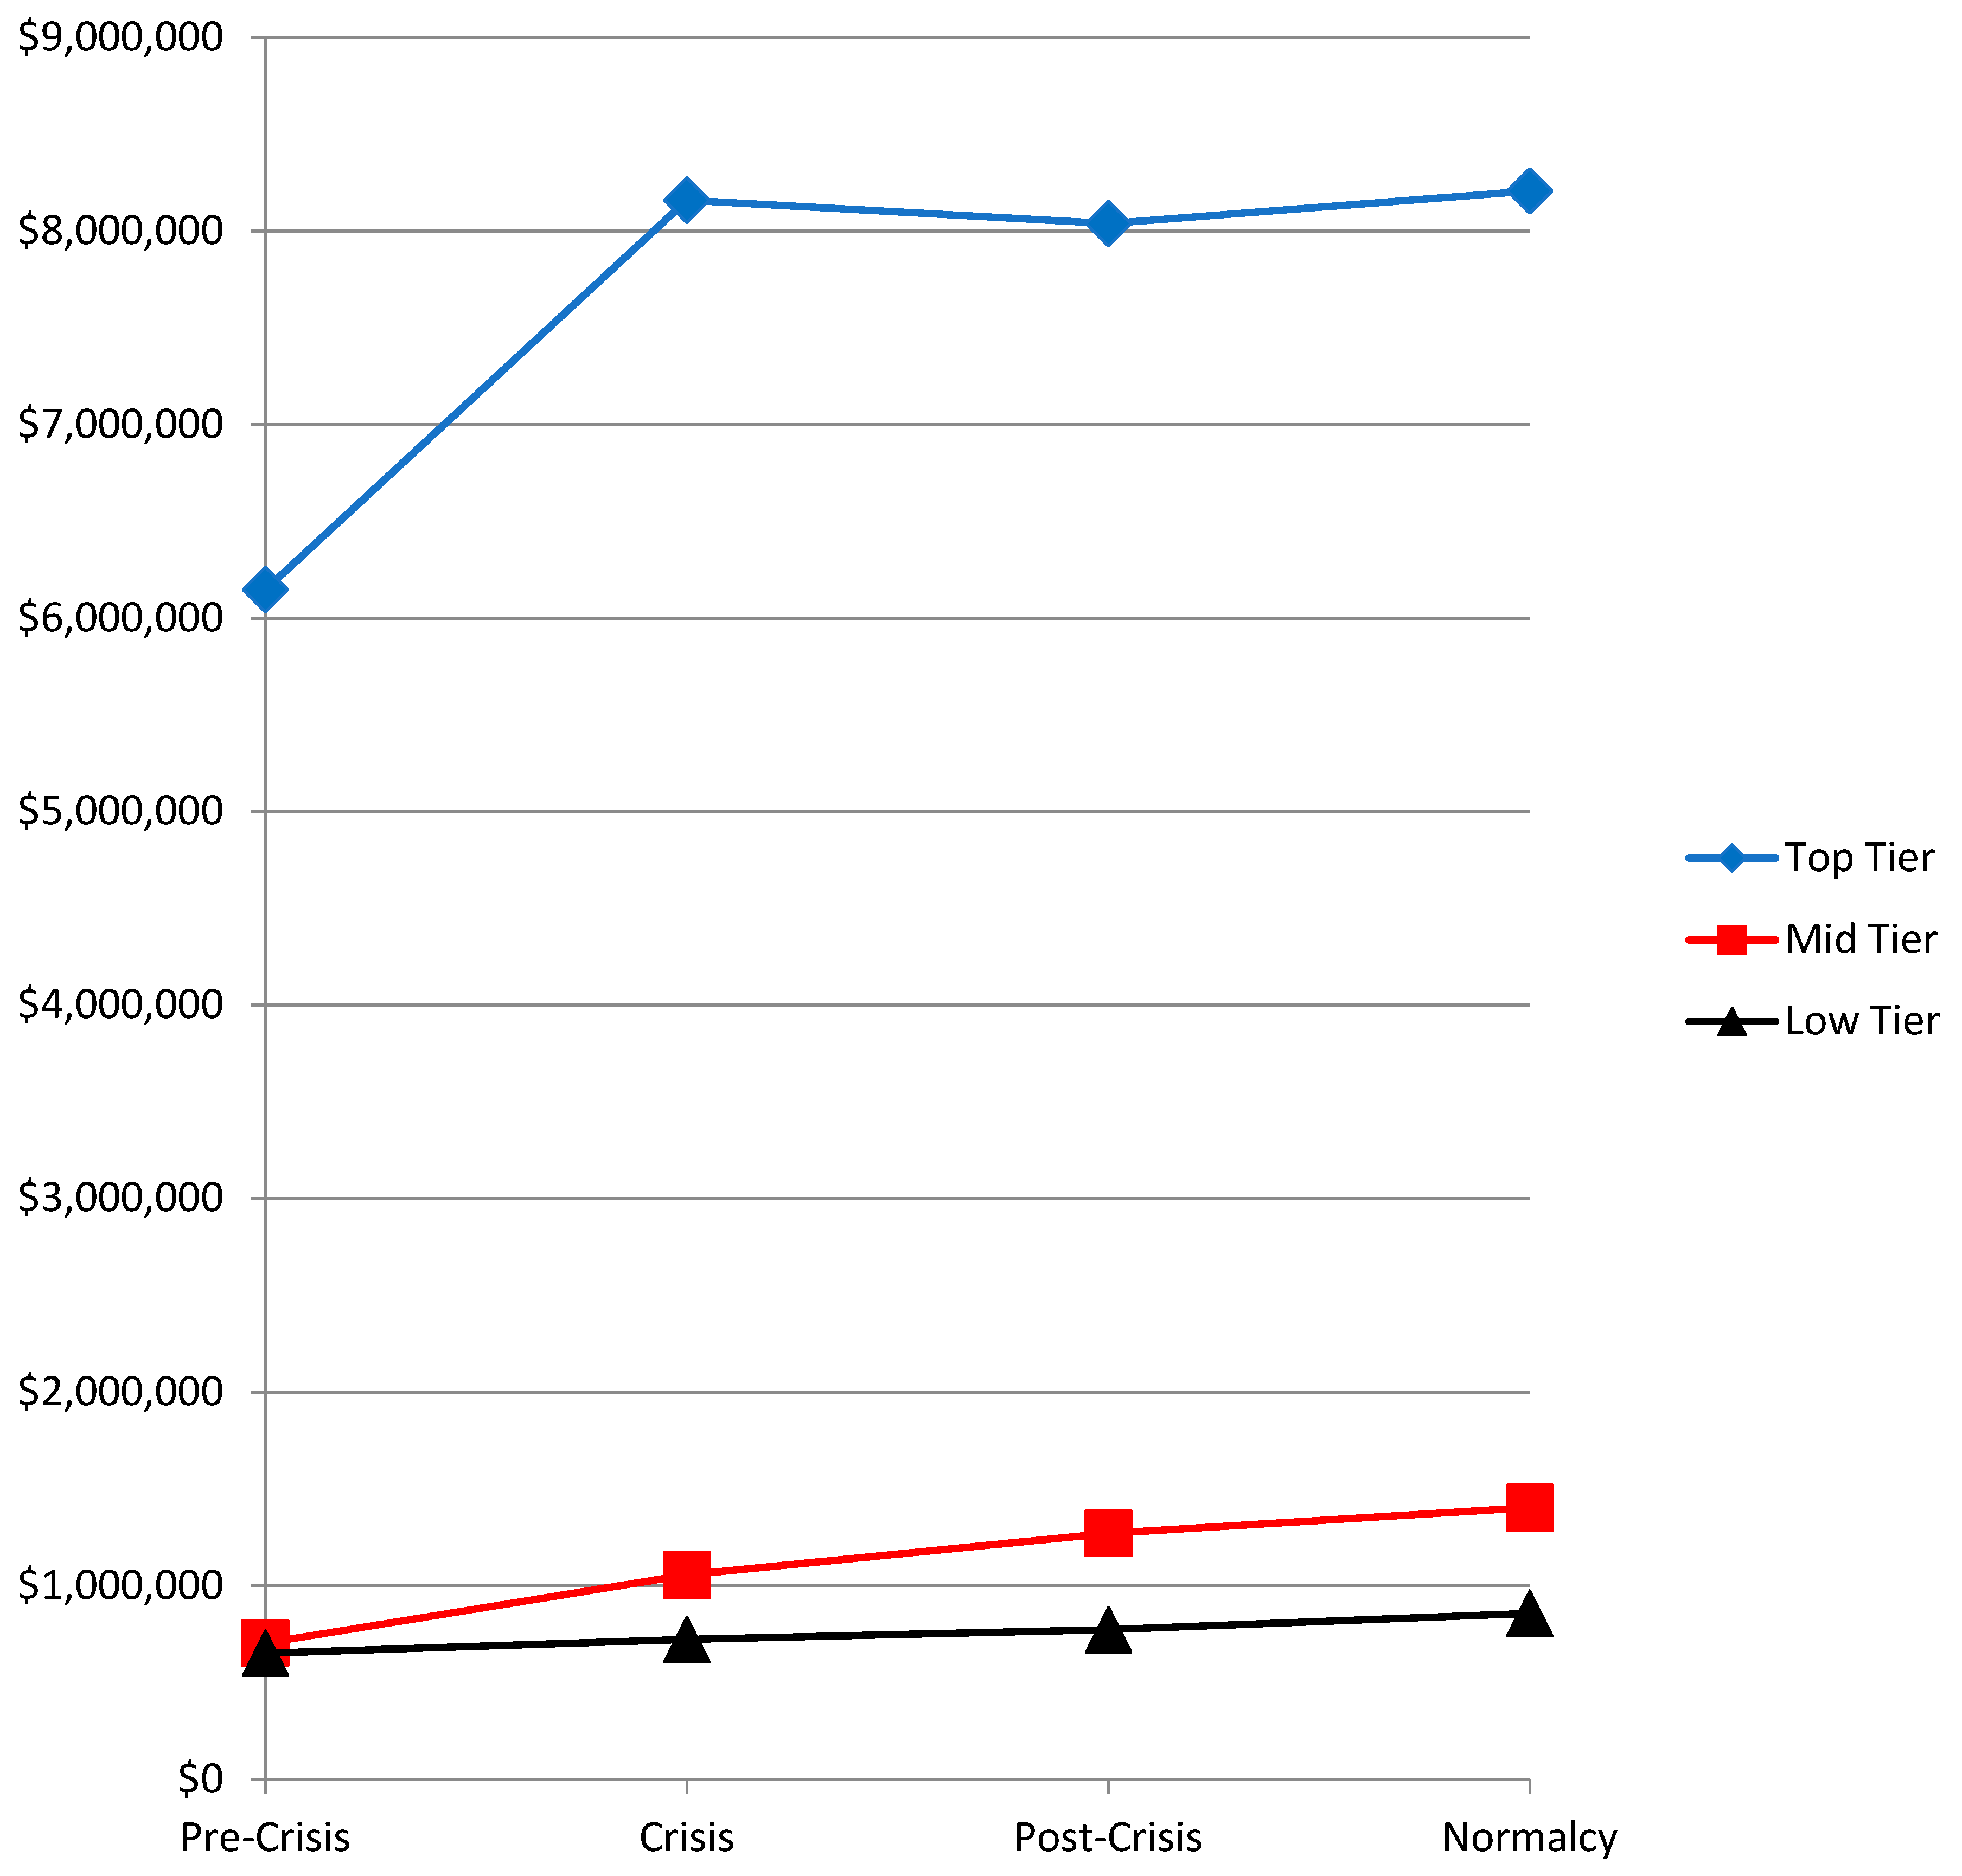
Thus, in terms of legislation passed and regulations implemented since the crisis, the breakup prescription has not been adopted in the U.S. or in any other country to our knowledge. In fact, U.S. banks have grown significantly compared to pre-crisis levels (see Figure 1). For instance, the average total assets for the four top-tier banks combined grew from $6.146 trillion (pre-crisis; 2005–2007) to $8.207 trillion (normalcy; 2014–2016) in real terms13—an increase of 33.5 percent. Similarly, the four mid-tier (low-tier) banks increased collectively in size from $705 billion ($651 billion) to $1.404 trillion ($857 billion)—increases of 99.1 (31.6) percent, respectively.
Viewed in isolation from a purely bank breakup advocacy perspective, the trend indicates that the TBTF problem is far from resolved and in fact is moving in the wrong direction. However, size has been taken into account in terms of the intensity of regulatory scrutiny and compliance requirements imposed on financial institutions. For instance, the financial stability provisions (Title I, Section 115) in the Dodd-Frank Act (2010) imposed the asset threshold for enhanced prudential standards at $50 billion, and for company run stress tests and mandatory risk committees at $10 billion. These thresholds would cover all twelve banks that we include in our analysis. However, the Economic Growth, Regulatory Relief and Consumer Protection Act (2018), in partially rolling back Dodd-Frank, has increased the asset threshold for enhanced prudential standards to $250 billion while allowing discretion to the Federal Reserve in determining whether a financial institution with assets equal to or above $100 billion should be subject to such standards. It also increased stress test and mandatory risk committee asset thresholds to $250 billion and $50 billion, respectively. This implies that going forward three of our low-tier banks (BB&T, SunTrust Banks, and Regions Financial) would not be subject to stress tests.
2.2. Higher Equity (or Tier 1) Capital Requirements
International coordination in establishing comprehensive measures to strengthen regulation, supervision, and risk management for large globally active banks has been exemplified in the Basel accords. In 1988, Basel I established the minimum standard of 8 percent for the ratio of required bank capital to risk-weighted assets (RWA). The perceived inadequacy and gaming of the risk weights led to Basel II, which altered the standard weights and also introduced an alternative protocol whereby banks could use internal models to compute their RWA. Basel II was in the implementation phase in many jurisdictions when the financial crisis hit and widespread capital shortfalls became evident which precipitated Basel III in 2010 (finalized in 2017).14
Basel III tightened the definition of capital, increased the scope of exposures included in the computation, established a maximum leverage ratio, raised risk-weighted capital requirements substantially for the largest, most complex banks, and also introduced liquidity requirements. For instance, Basel III imposes a higher capital requirement on G-SIBs (see footnote 4) based on a score calculated from a set of indicators that include size, interconnectedness, substitutability, complexity, and cross-jurisdictional activity. The surcharge ranges from 1.0 percent to 3.5 percent of RWA, and is in addition to the 7 percent total common equity ratio requirement.15,16 The Dodd-Frank Act (Title VI, Section 606) also directed regulators to strengthen bank capital requirements.
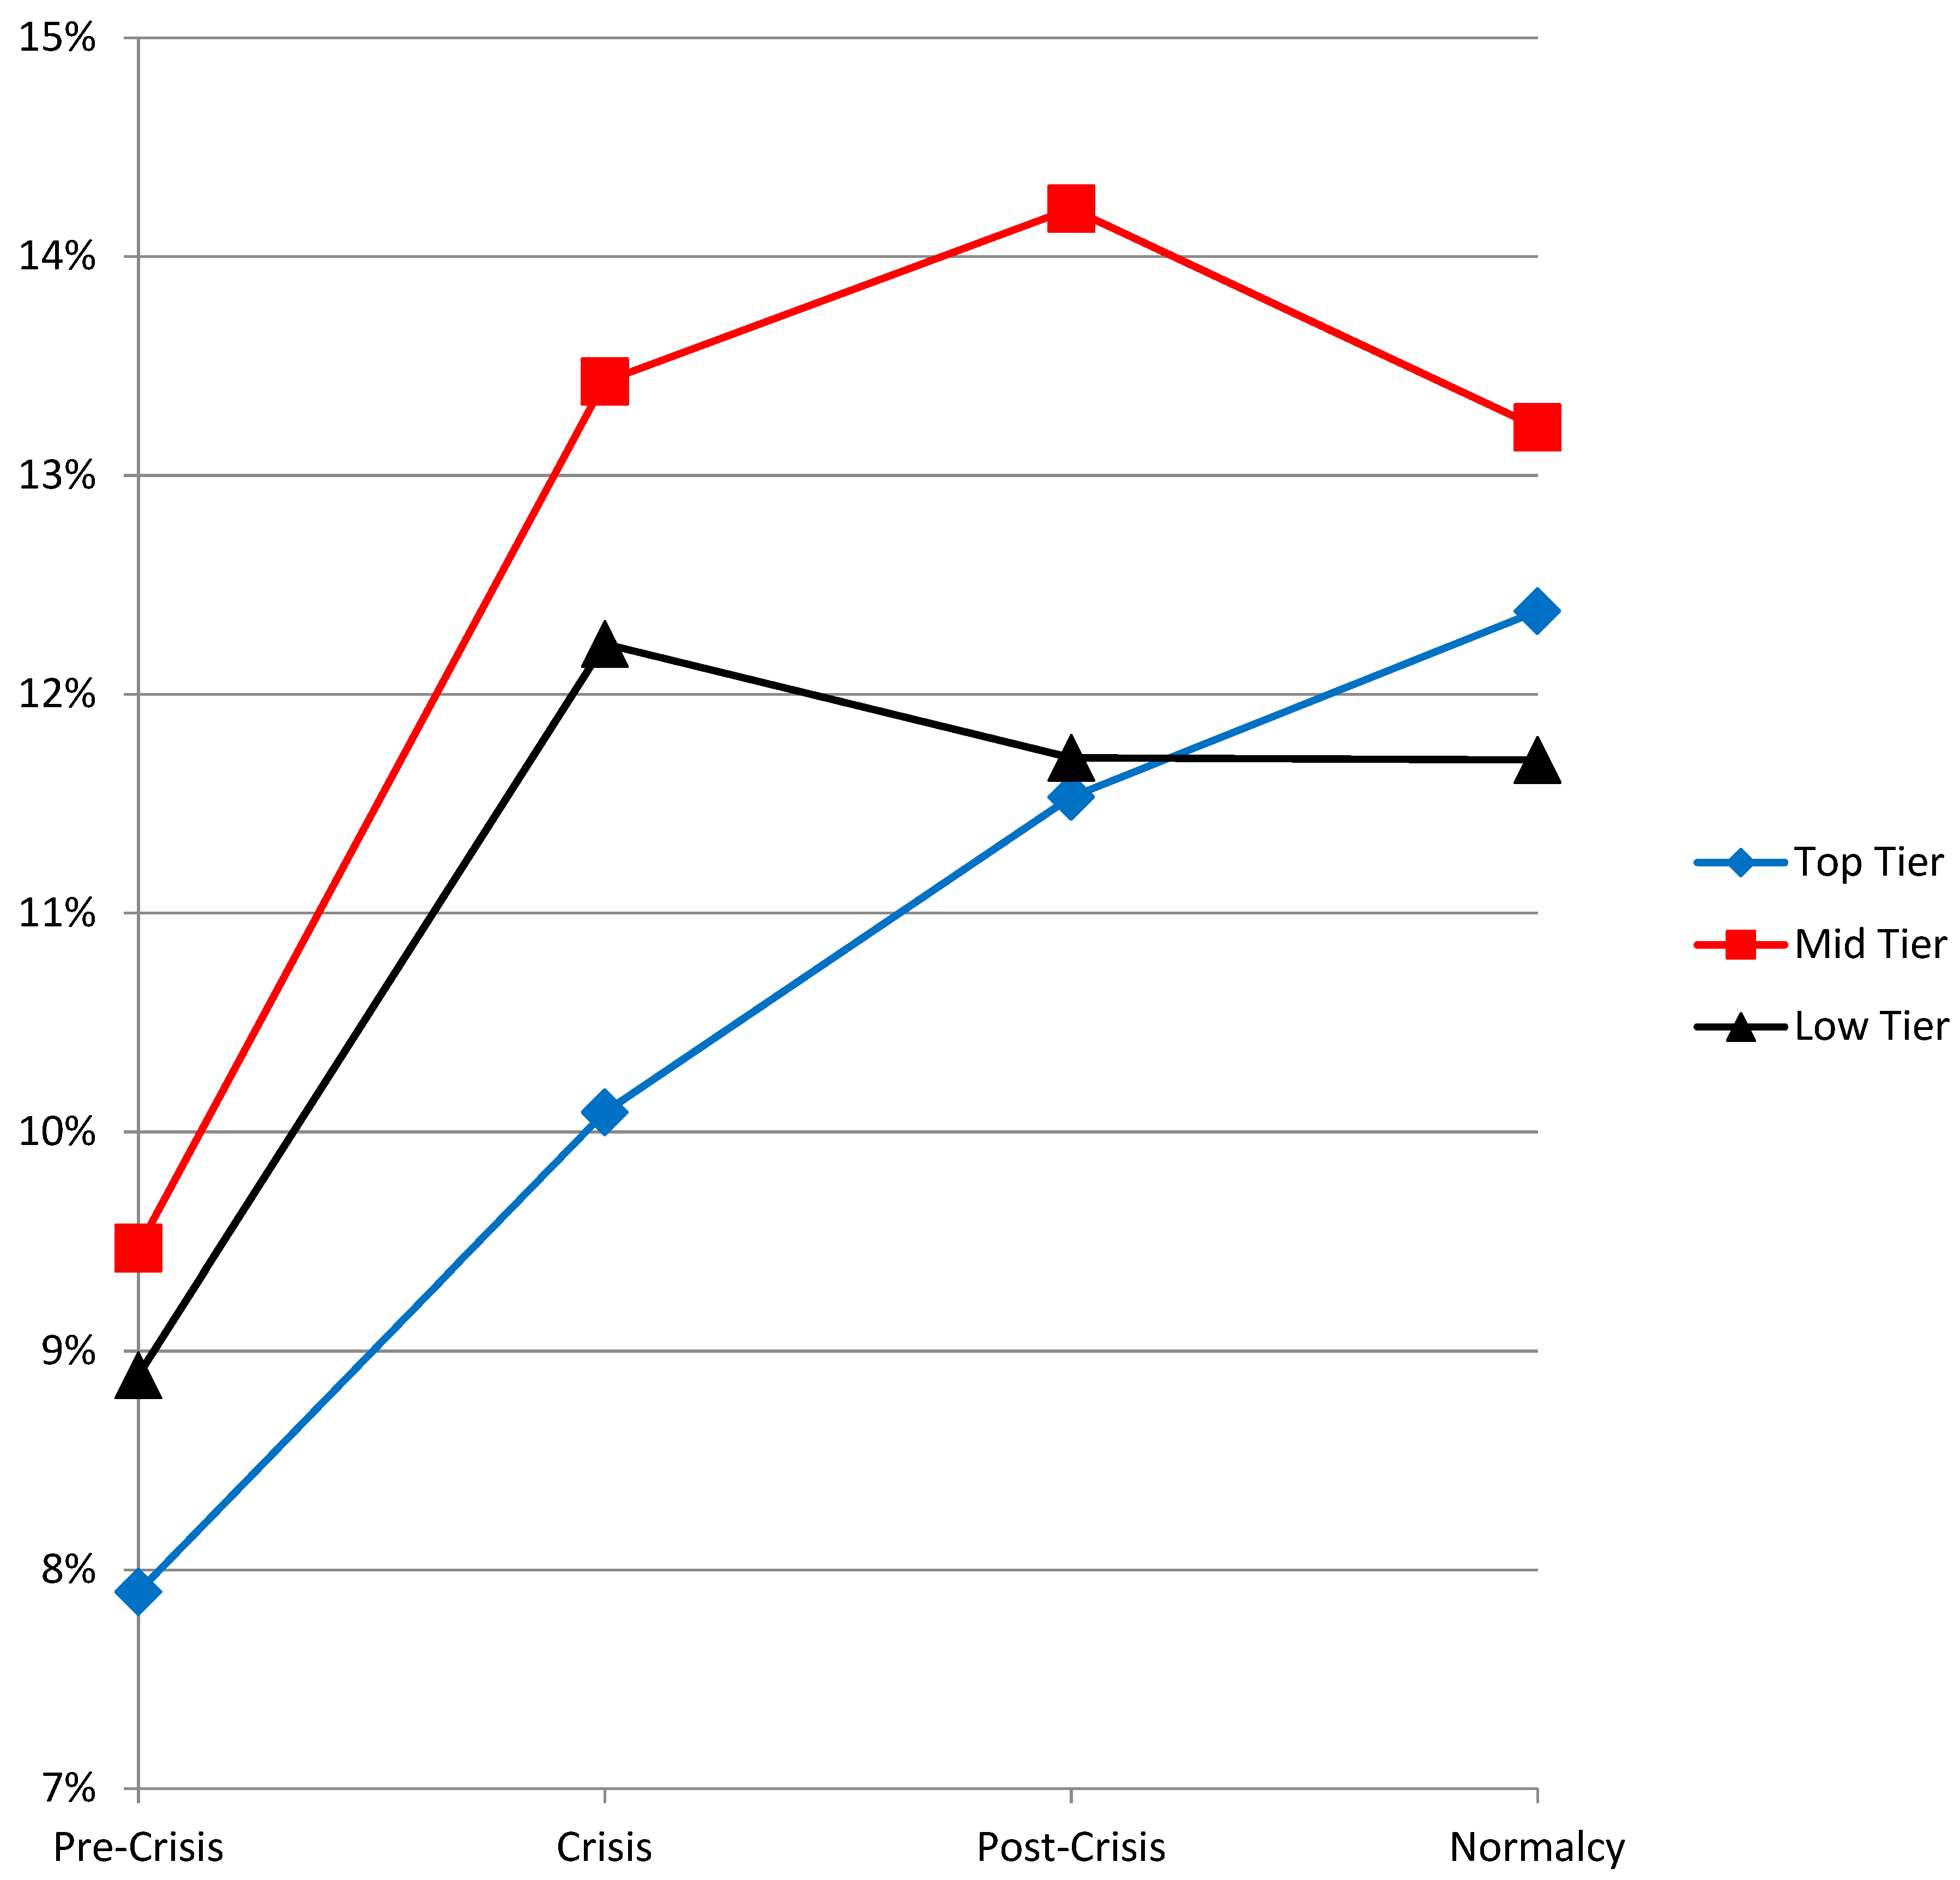
Figure 2 indicates the Tier 1 capital ratios17 for the U.S. banks (top, middle, low) in our longitudinal analysis. Clearly, there has been significant improvement. The average Tier 1 ratio for the top tier banks improved from a pre-crisis average of 7.9 percent to 12.4 percent in the most recent normalcy period. The mid and low tier banks show similar trends. It is worth noting that all the banks exceed the Basel III standards. Is it therefore appropriate to conclude that financial stability has been restored and to agree with the opinion expressed by Jaime Dimon: “Essentially Too Big to Fail has been solved—taxpayers will not pay if a bank fails”?
Anat Admati, Professor of finance and economics at Stanford University and Martin Hellwig of the Max Planck Institute, would strongly disagree. They published a book aimed at a general audience (Admati and Hellwig 2013) about fundamental problems related to financial stability (or lack thereof) with the central message being that banks should be required to carry much more equity capital. They suggest that banks’ capital structure should not necessarily differ too much from average corporations and that requiring them to fund 20 (or even 30) percent of their assets with equity capital is not unreasonable.18
The banking industry’s position is that equity capital is more expensive than debt capital and a capital structure shift of this magnitude would greatly elevate their cost of capital which they would be obliged to pass on to their loan customers by charging higher interest rates. Admati-Hellwig’s rejoinder is that this is not necessarily the case. They invoke the famous Modigliani and Miller (1958) proposition that the firm’s value is invariant to the financing source. In other words, the firm’s weighted average cost of capital should not change as capital source weights are altered. The empirical reality is more complicated and there is some likelihood that banks’ cost of capital will rise to some extent and could result in tightened credit supply and lower economic growth.19 It appears that policymakers and regulators have to strike the right balance between the objective of financial stability (minimize the probability of taxpayer funded bailouts) and a well-functioning financial system that enables optimal economic growth.
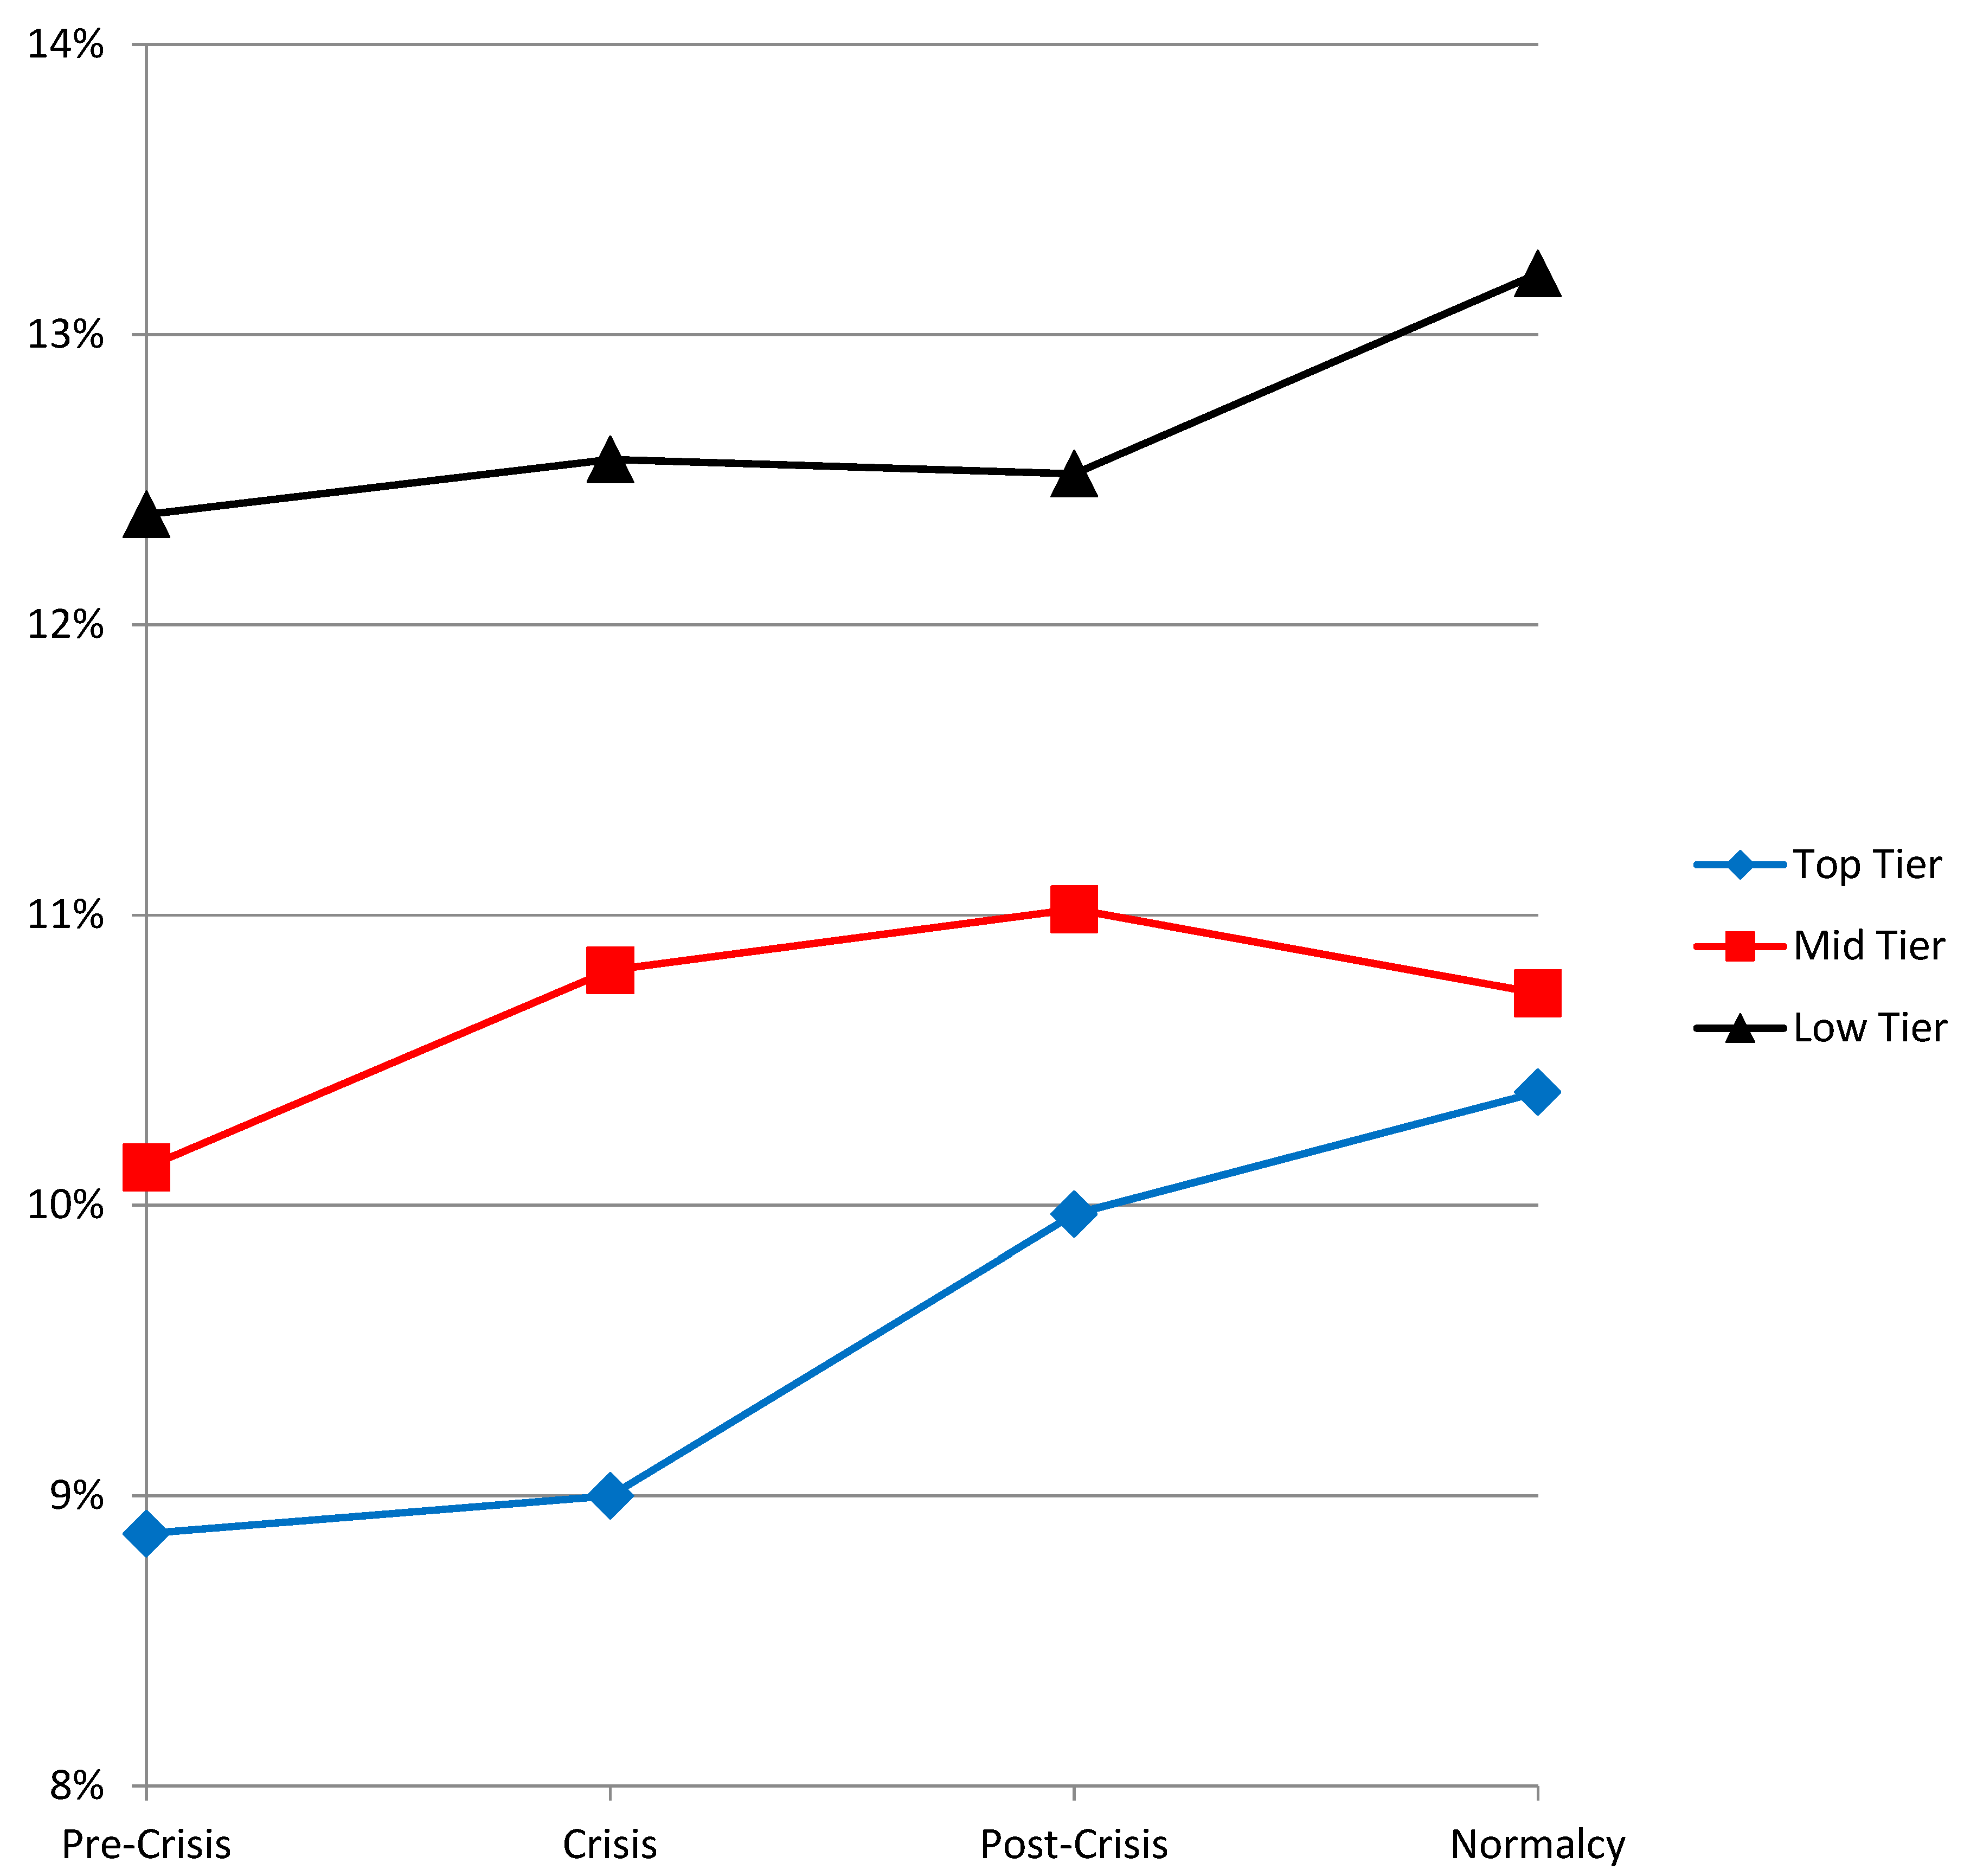
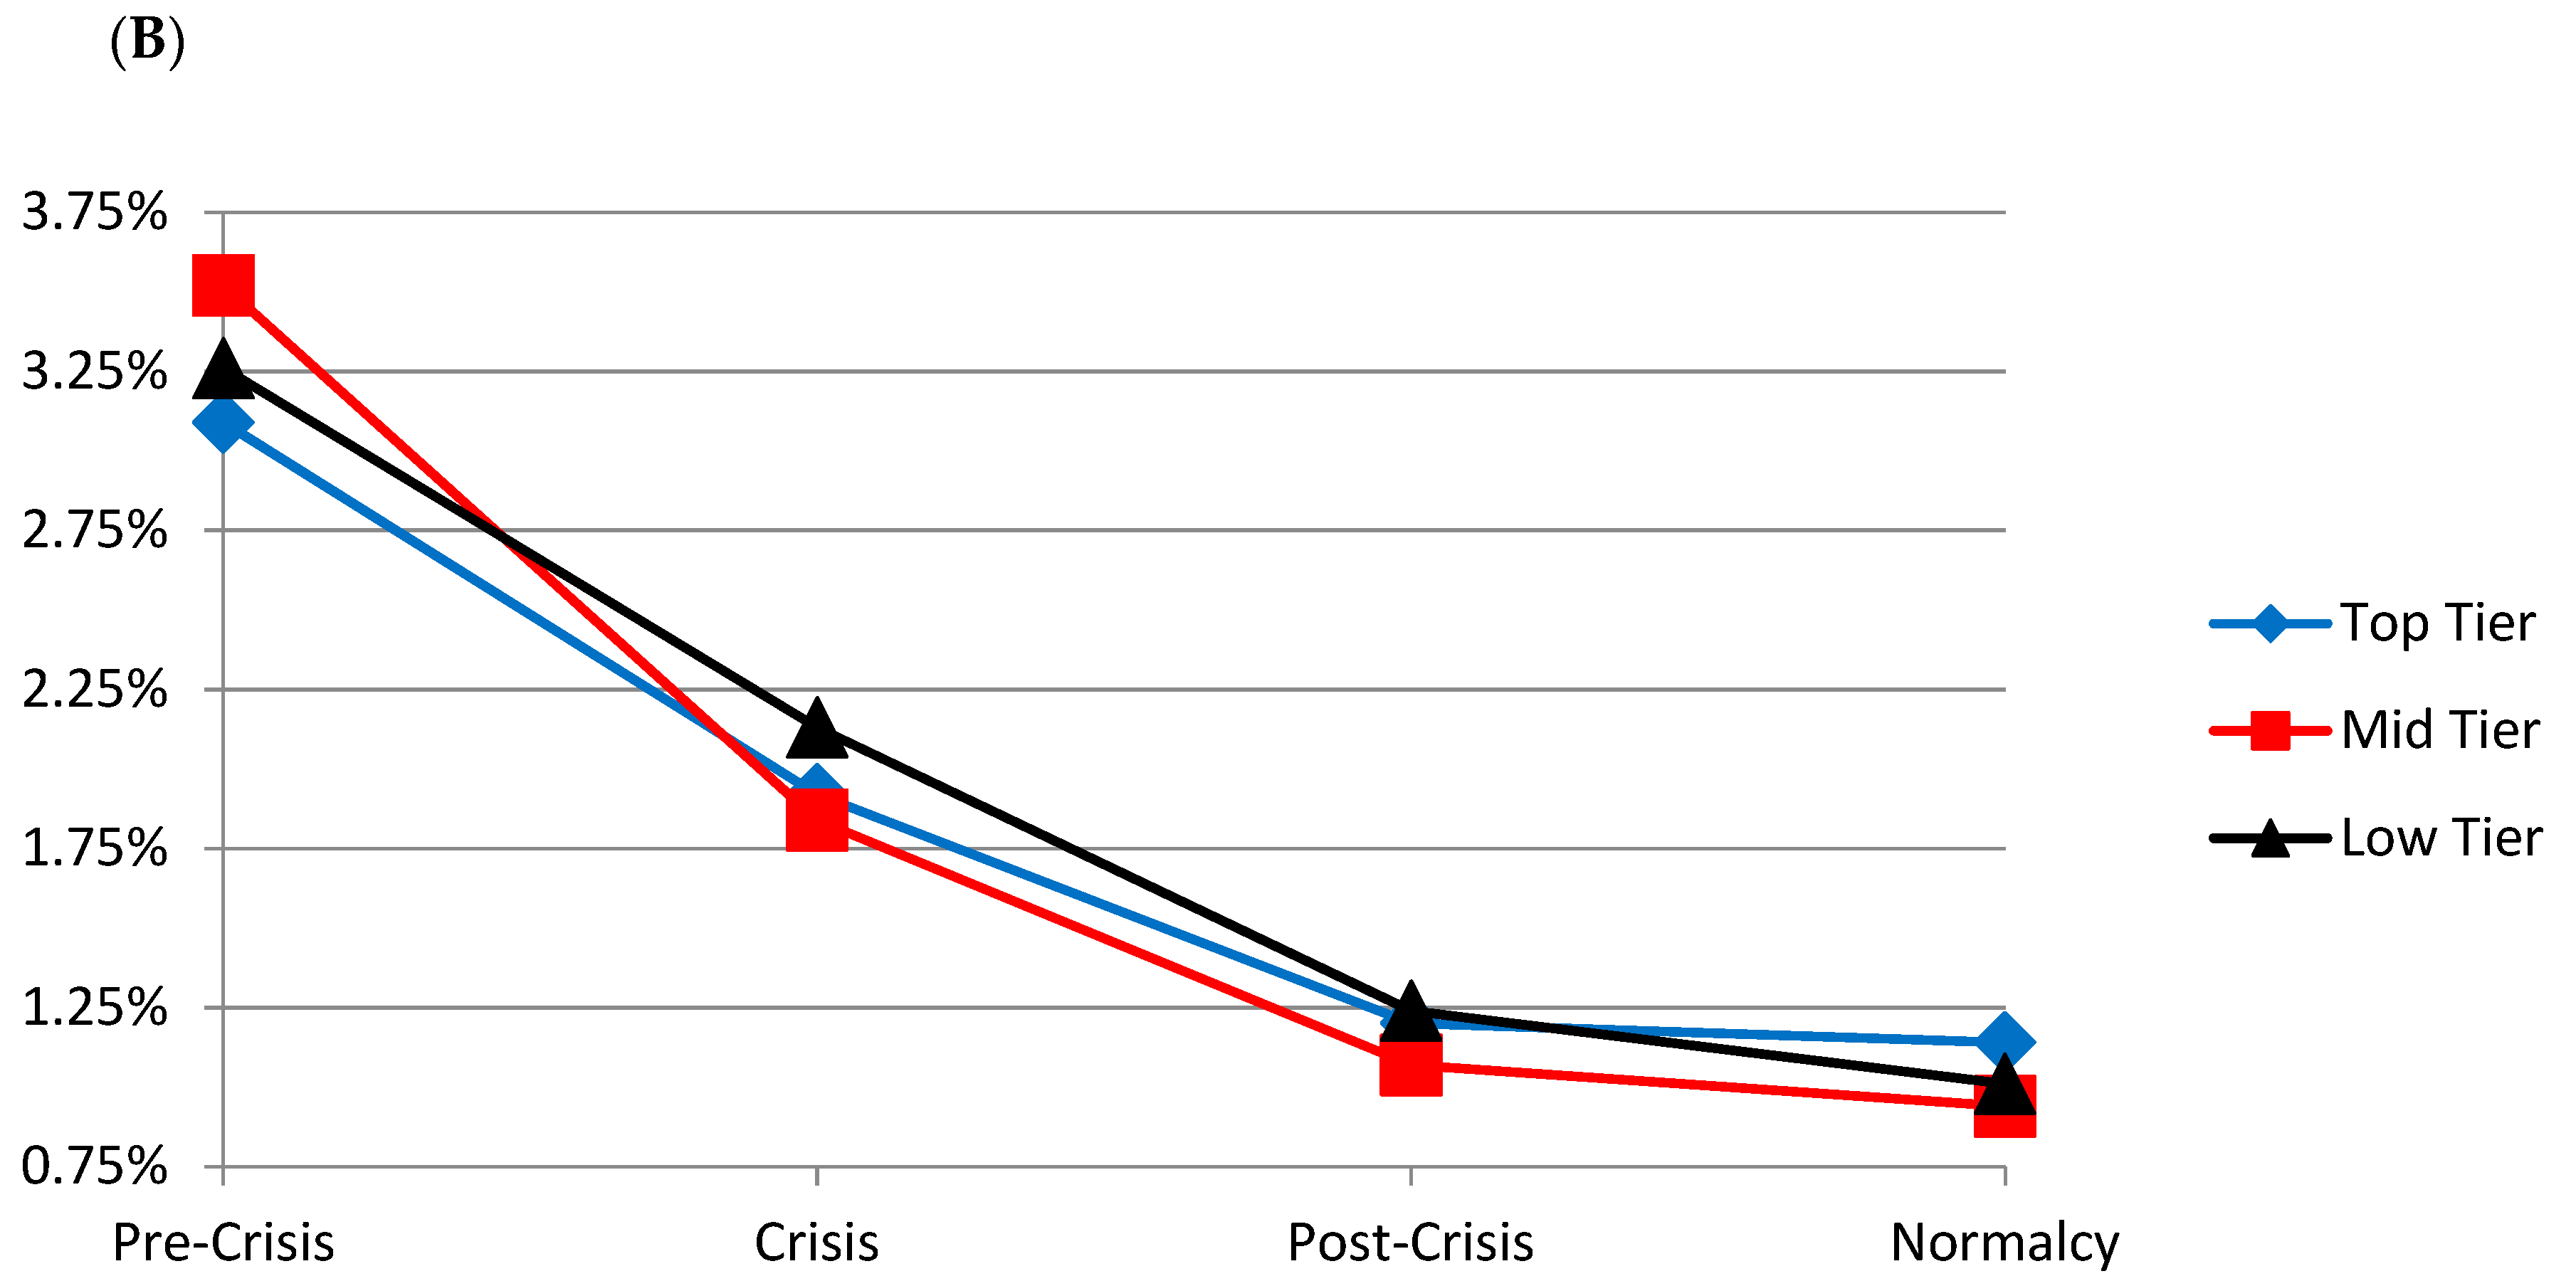
Figure 3 displays the shareholder equity/total assets ratio in book value terms. We see small but potentially encouraging differences between the pre-crisis and normalcy periods. For the top-tier banks, the ratio improved from 8.87 to 10.39 percent. From Admati-Hellwig’s perspective, we still have a long way to go to reach their target—a ratio of 20 percent or higher. The smaller banks in our sample have been relatively better capitalized over our observation period.20 However, it is worth noting that more than 500 U.S. banks failed in the 2008–2015 period compared to 25 in the seven years preceding the recession.21
A related issue is whether some banks enjoy a financing subsidy by virtue of their perceived TBTF status.22 The logic is that providers of capital to TBTF banks are willing to offer more favorable terms because they anticipate being bailed out in the event of default. Apart from the unfairness aspect of big being favored over small, this could also induce the TBTF banks to take on greater risks since the rewards are reaped by shareholders/managers while catastrophic losses are offloaded on to taxpayers—a classic moral hazard scenario.
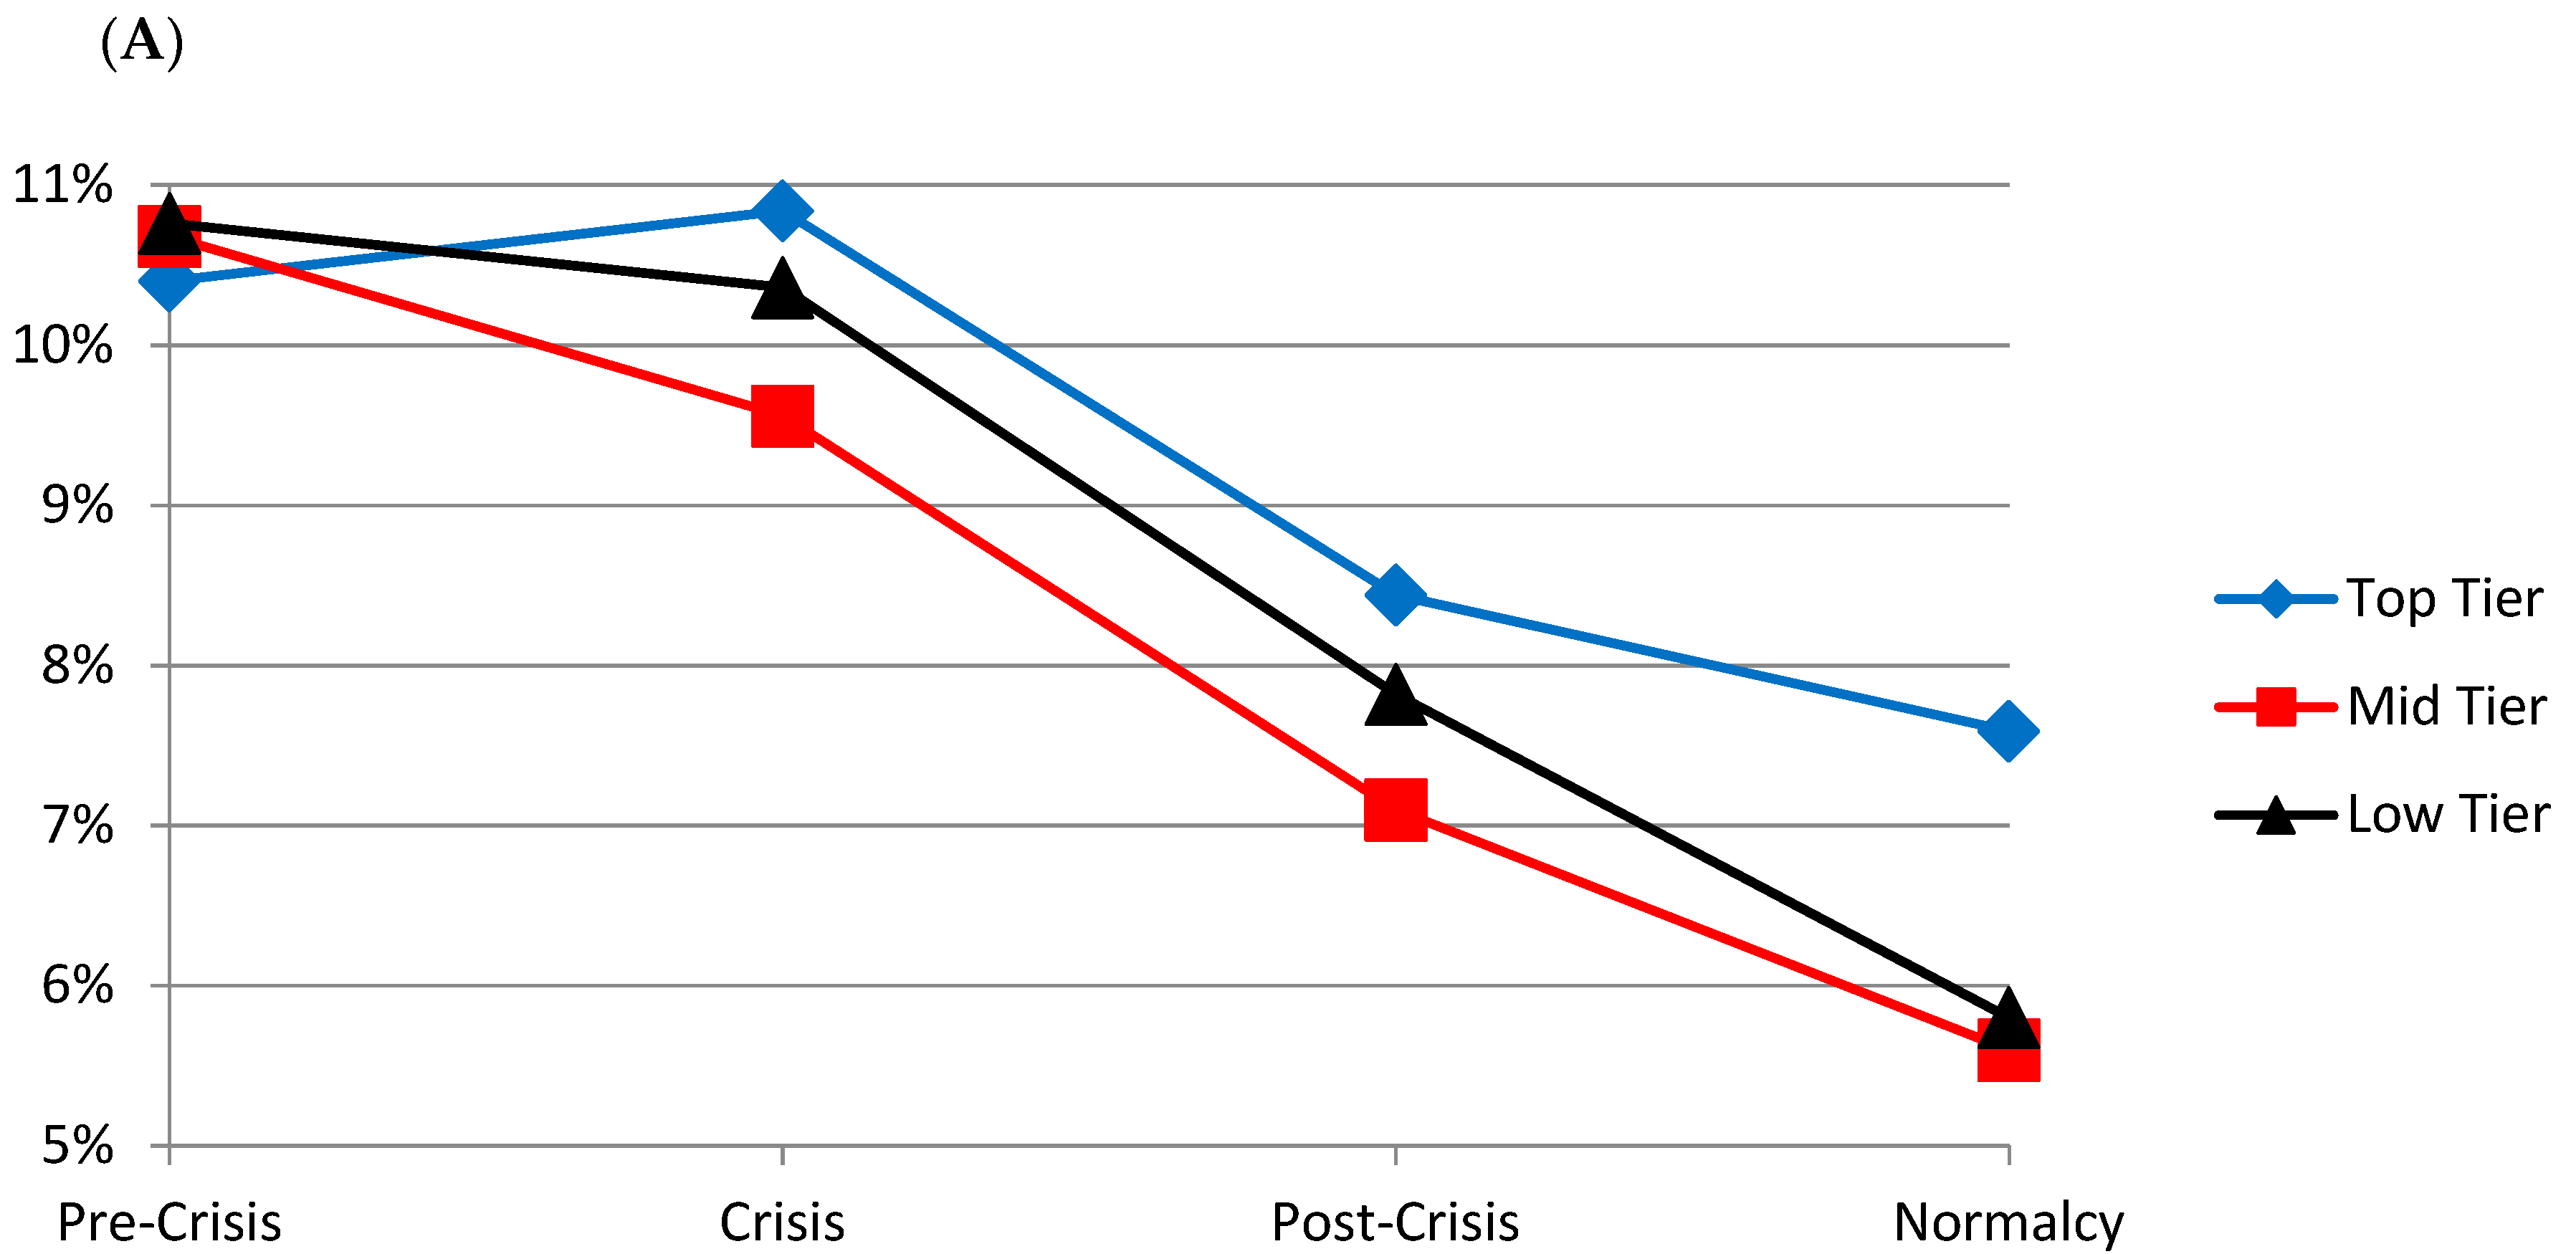
In Figure 4, we report our estimates of the cost of equity (Panel A) and the weighted average cost of capital (Panel B) for the banks in our sample; the results are quite interesting. Both cost of equity and the WACC show secular declines from the pre-crisis through the normalcy periods, which is undoubtedly a function of the significant monetary policy easing undertaken by central banks to address the recession caused by the financial crisis. However, in the pre-crisis period, the cost of equity (WACC) for the top-tier banks was 10.40 (3.09) percent compared to 10.76 (3.26) for the low tier group. Viewed in isolation the 36 (17) basis point differential could be attributed to economies of scale or some other efficiency criterion but it could also reflect the funding subsidy. However, note that in the normalcy period, the situation has reversed—the cost of equity (WACC) for the top group is 7.59 (1.14) percent compared to 5.80 (1.01) for the low-tier banks.23 The differential now favors the smaller banks and may at least partially represent the withdrawal of the funding subsidy previously enjoyed by the larger banks. This suggests that the regulatory remedies (Basel III, Dodd-Frank) may be having the desired effect.
2.3. Inducing Banks to Forgo Riskier Practices
Innovations in the financial services sector (such as sub-prime mortgage loans, securitization, structured finance, synthetic derivatives, shadow banking) contributed to and exacerbated the financial crisis.24 An important thrust of financial regulation post-crisis has been to induce banks to curtail riskier practices. One of these initiatives has been the so-called ‘Volcker rule’ codified in the Dodd-Frank Act (Title VI, Section 619). The rule forbids banks from acquiring certain assets (such as corporate bonds) for their own account, or to engage in proprietary trading beyond a minimal level. To distinguish market making from proprietary trading in these restricted assets, it also establishes a complex set of exemptions and requires compliance on a trade-by-trade basis.
Some academics and policymakers have proposed more sweeping restrictions on the scope of banking activities. For example, Molyneux (2017) and White (2016) suggest that banks should be treated as public utilities and regulated along similar lines. Thomas Hoenig, then President of the Federal Reserve Bank of Kansas City, has been quoted as saying at a conference in 2011: “The 2008 bank bailouts at the height of the financial crisis and other implicit guarantees effectively make the largest U.S. banks government-guaranteed enterprises … You’re a public utility …” He stated that these lenders should be restricted to commercial banking activities, advocating a policy that existed for decades barring banks from engaging in investment banking activities.25 This in effect amounts to a criticism of the financial deregulation embodied in the Gramm–Leach–Bliley Act (also known as the Financial Services Modernization Act of 1999), which partially repealed the Glass–Steagall Act of 1933. Essentially, the market barriers between commercial banking, investment banking, and insurance services were eliminated. Neel Kashkari, President of the Federal Reserve Bank of Minneapolis, has also floated the idea of making banks utilities to end TBTF once and for all.26 Others would go further still and promote the concept of full reserve or ‘narrow banking’.27
Another area of concern is the structure of executive compensation contracts in the finance sector. The Financial Crisis Inquiry Commission report (page xxvi) states that: “Compensation systems—designed in an environment of cheap money, intense competition, and light regulation—too often rewarded the quick deal, the short-term gain—without proper consideration of long-term consequences. Often, those systems encouraged the big bet—where the payoff on the upside could be huge and the downside limited. This was the case up and down the line—from the corporate boardroom to the mortgage broker on the street.” The Troubled Asset Relief Program (TARP), the bailout package put together after the crisis, included strictures on executive compensation but it remains unclear if any meaningful long-term changes to incentive features in compensation contracts are in place after the TARP monies were repaid. Jaggia and Thosar (2017) suggest that: “compensation practices in the finance sector remain a potential concern for systemic stability”.28
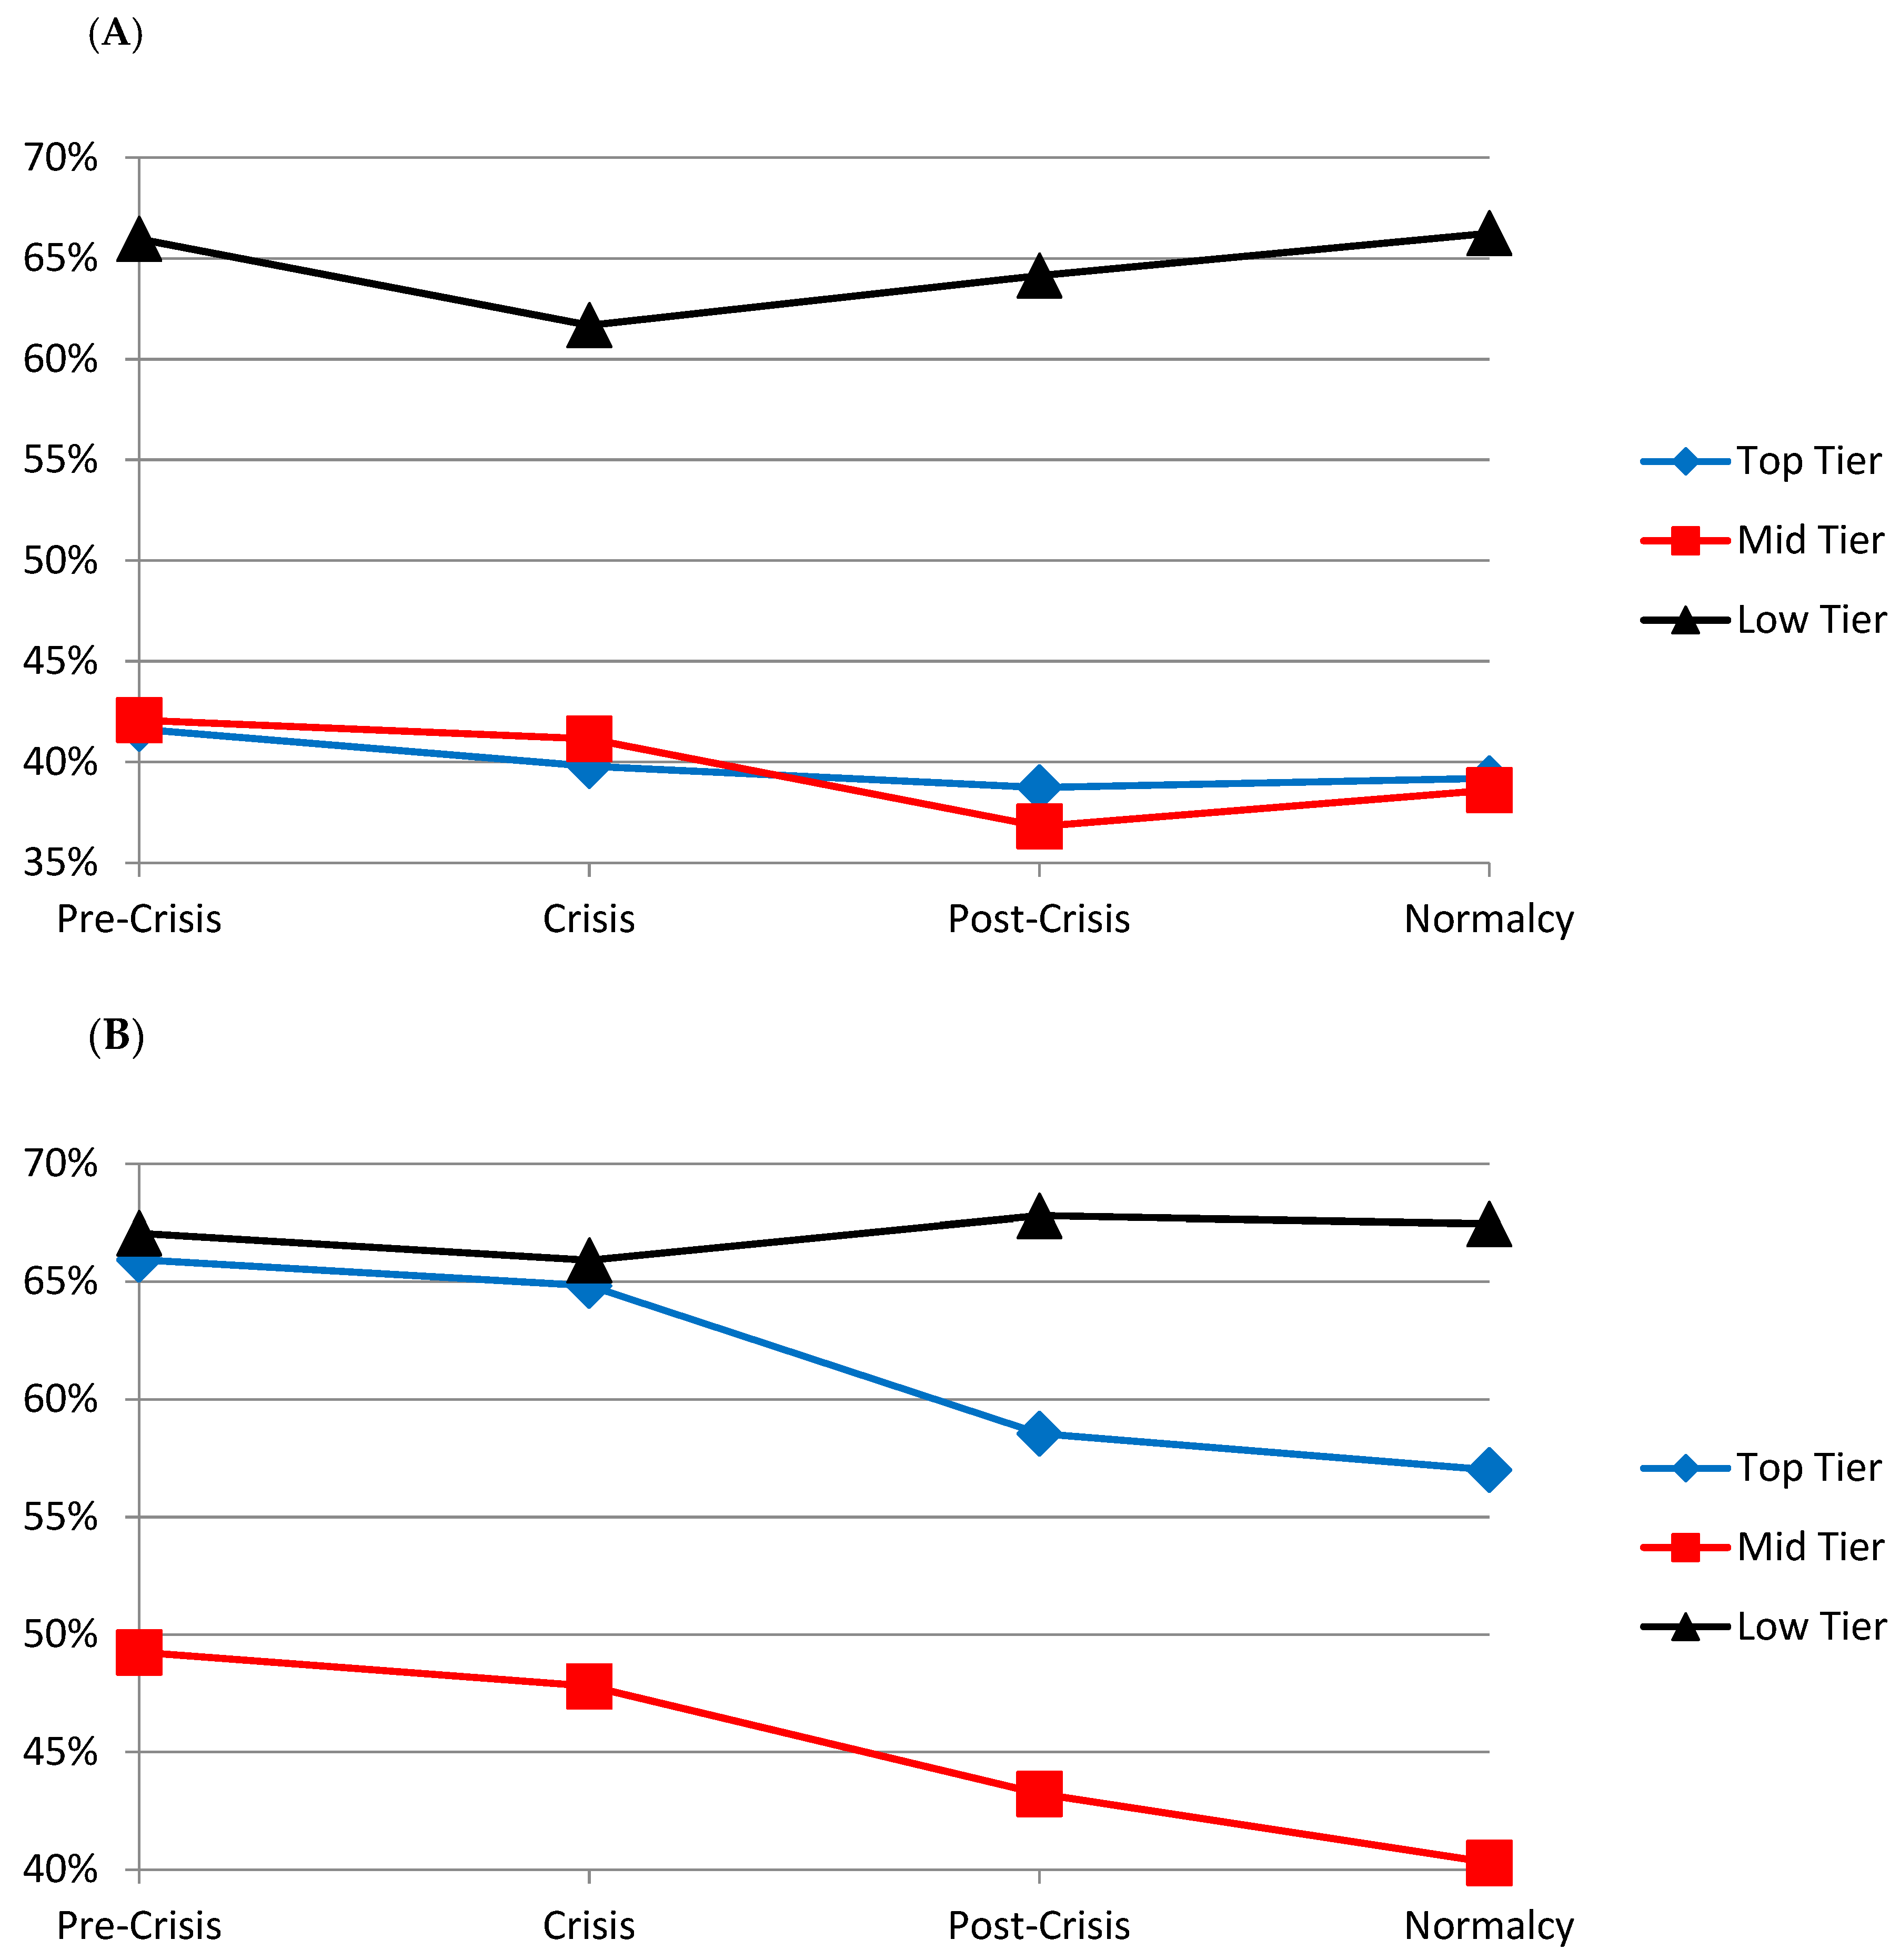
In Figure 5, we explore whether U.S. banks have modified their business models in terms of engaging in less risky practices. Panel A charts the Loans/Total Assets ratio, which should increase over time if banks are reorienting toward more traditional business lending activity. However, observe that for the top and middle-tier banks the ratio is marginally declining from around 42 percent (pre-crisis) to 39 percent (normalcy). The smaller banks, which rely on more traditional commercial banking, exhibit a similarly flattish pattern with the ratio ranging between 62 and 66 percent. Panel B charts the Interest Income/Total Income ratio which is attempting to answer the same question from the revenue side. Once again, we observe that the ratio is declining for the top and middle tier banks while remaining flat for the smaller banks. This is by no means a definitive analysis. It is possible that the larger banks have changed their asset portfolios in such a way that the non-loan asset components are becoming progressively safer and the non-interest income streams are likewise more stable than they were on the cusp of the crisis, but this is difficult to discern from accounting data. However, it does seem evident that the larger banks are not edging toward a utility type business model envisaged by the commentators cited above.
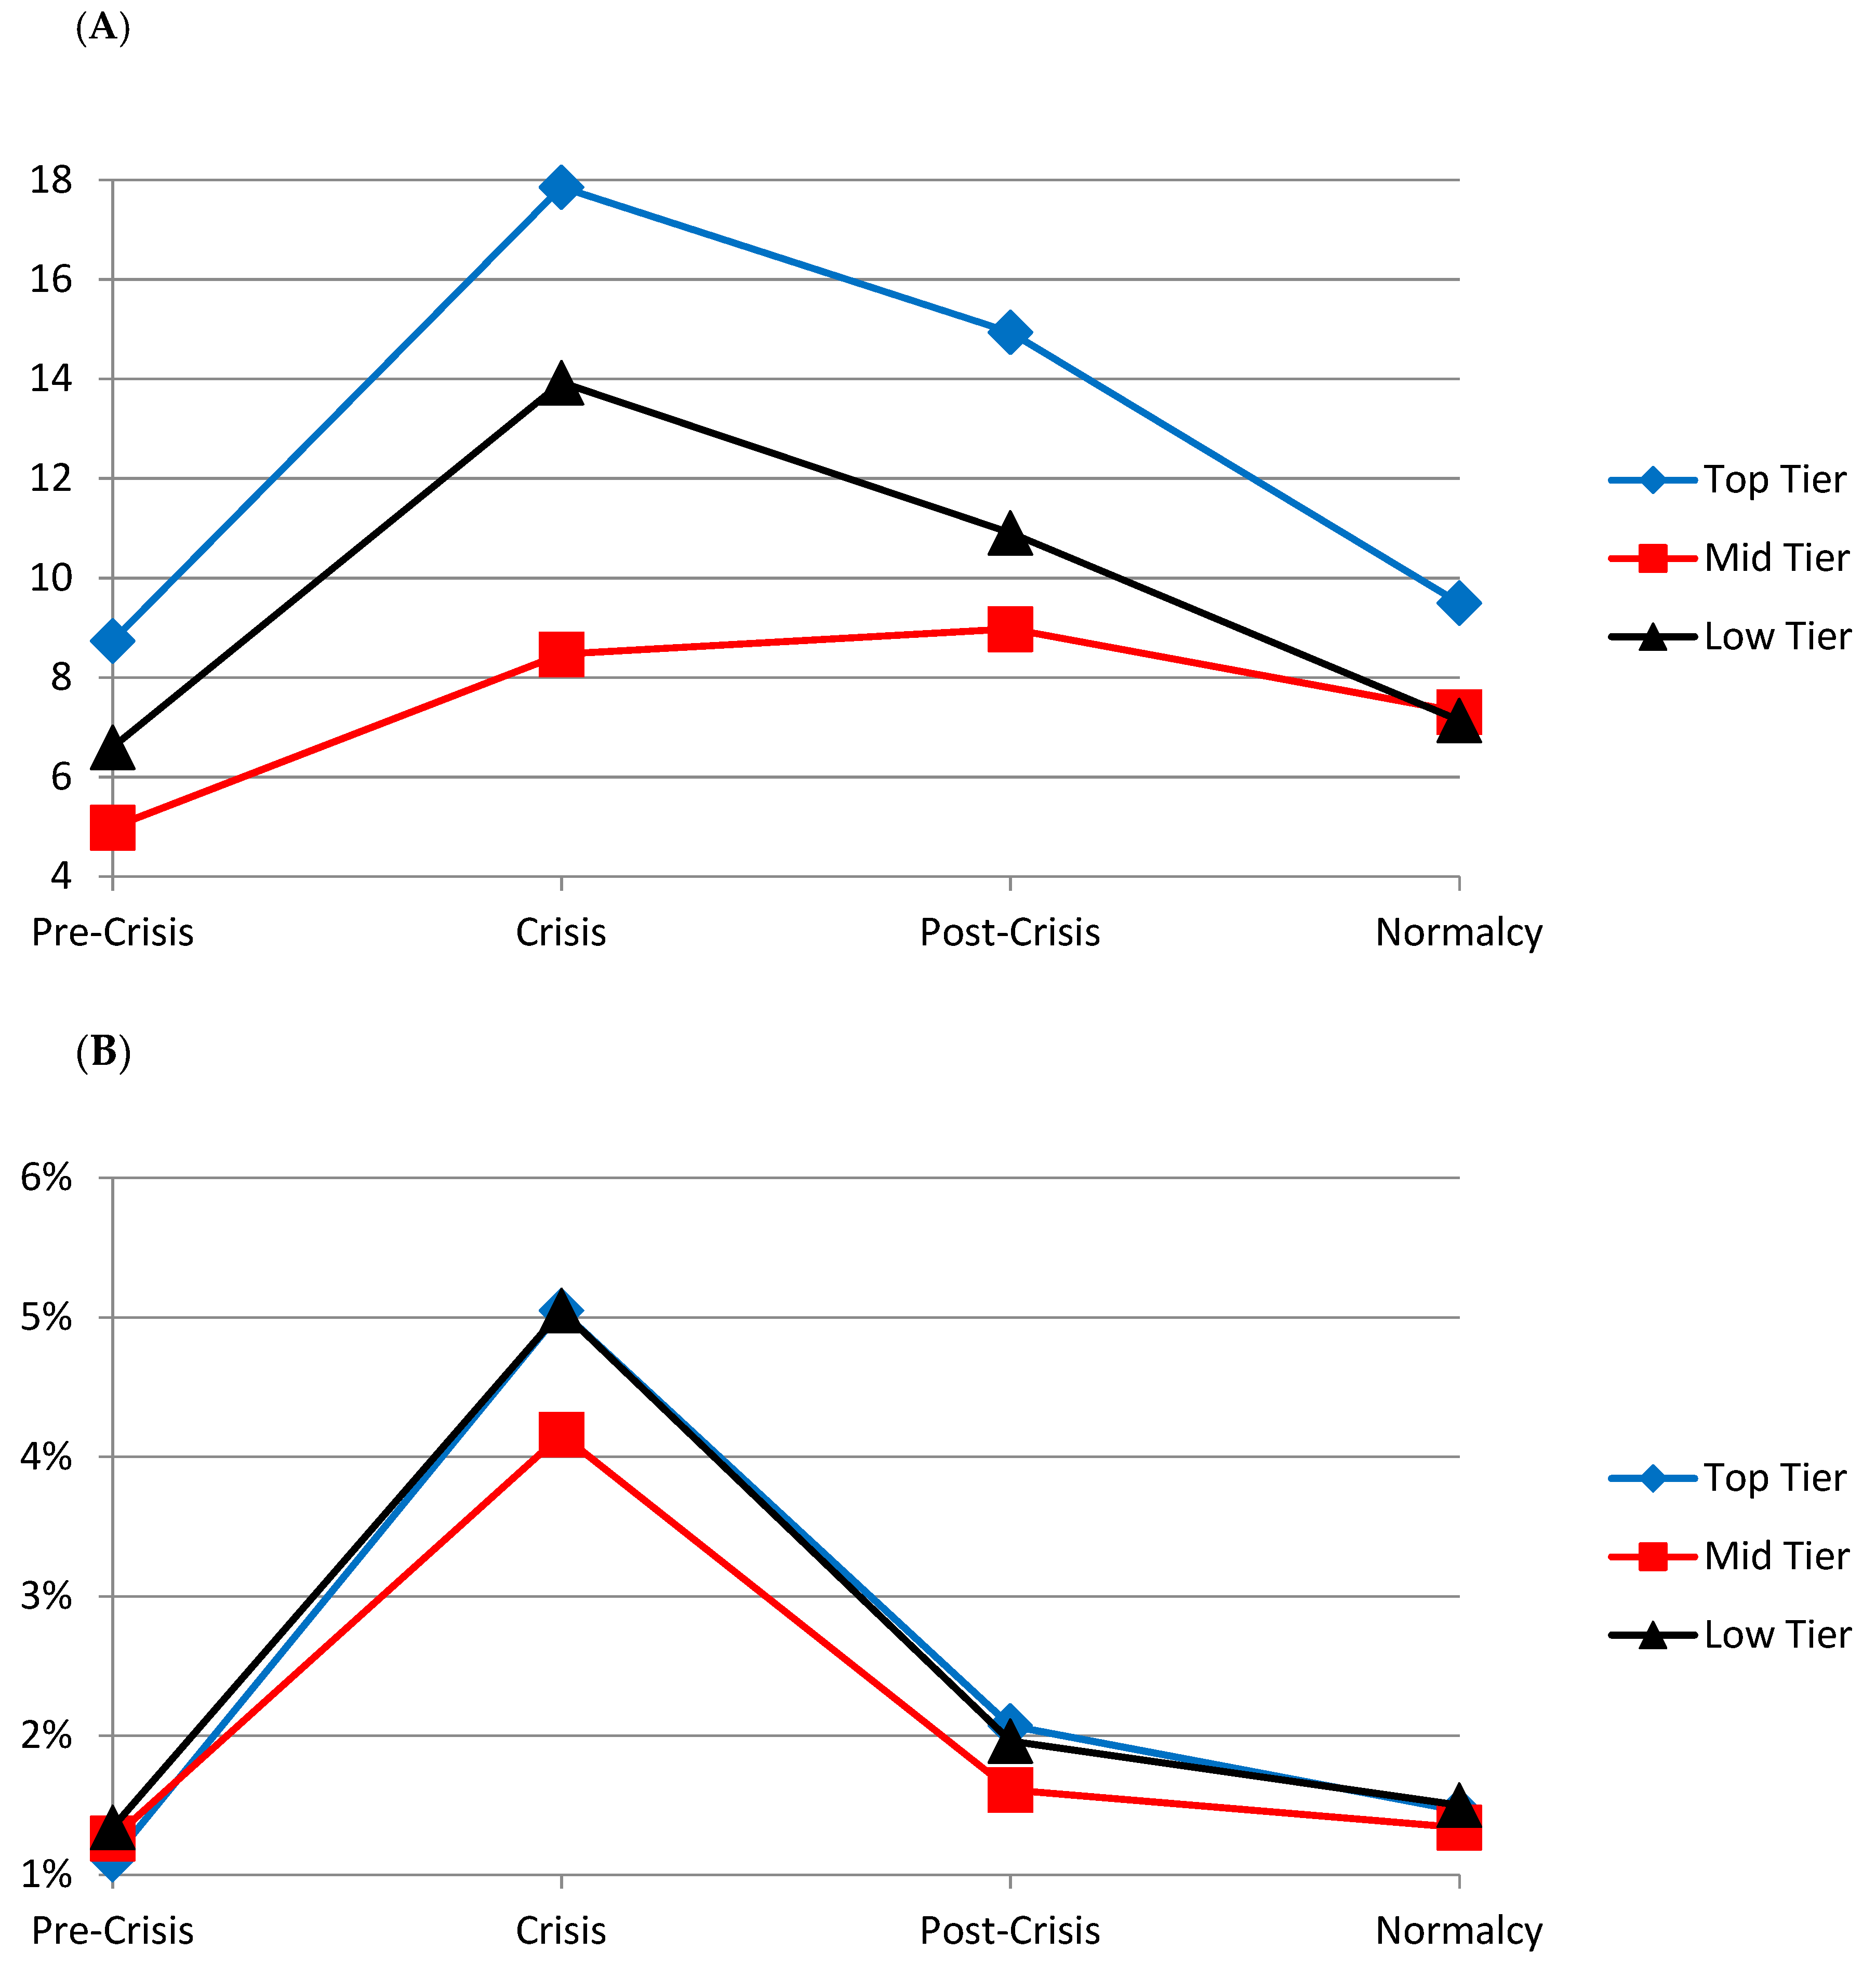
In Figure 6, we consider Leverage (Panel A) and Volatility (Panel B), which are market based measures of risk.29
Leverage = quasi-market value of assets/market value of equity = (book assets − book equity + market equity)/market value of equity
Volatility is the standard deviation of daily stock returns. It is clear that both leverage and volatility spiked upward during the crisis and are since declining steadily but remain marginally above pre-crisis levels.
2.4. Other Measures
This paper is not intended to be an exhaustive account of the various proposals and regulatory initiatives contemplated/implemented since the crisis to address financial stability concerns in general or the TBTF issue in particular.30 The Dodd–Frank Act is a vast piece of legislation with 16 Titles and 849 pages—it is not feasible to do justice to its contents in a relatively compact survey article. However, some key innovations in financial regulation contained in the Act are worth mentioning.
One of these is in the area of streamlining resolution in the event of bank failure. Title I, Section 165(d) of the Dodd–Frank Act requires systemically important financial institutions (SIFIs) to submit resolution plans (or so-called ‘living wills’) to the Federal Deposit Insurance Corporation (FDIC) and the Federal Reserve Board. The purpose of these plans is to provide a detailed guide to the FDIC to assist it in resolving a failed SIFI while limiting financial and economic spillovers.31
Title I, Section 165(i) of the Act also codified the requirement of stress tests, which has become a key element in the toolkit for macro-prudential regulation. These tests typically measure an institution’s capital adequacy under a range of adverse financial and economic conditions. They can also be deployed to assess an institution’s exposure to a variety of risks such as liquidity risk, cyber risk and so on.
The decade leading up to the crisis was characterized by financial deregulation under the assumptions that markets are mostly efficient and self-correcting, and that corporate leaders are prudent stewards focused on maximizing firm value without taking excessive risks that might jeopardize the survival of their institutions. Accordingly, the regulatory stance was light-handed.32 That changed as the crisis unfolded and lessons were learned. Apart from new financial regulation, there has also been a great deal of theoretical and methodological progress in the development and measurement of systemic risk measures, which undoubtedly is very useful to regulators in monitoring SIFIs on an ongoing basis.33
3. Conclusions
There has been extensive commentary and analysis of the causes and consequences of the financial crisis along with major legislation aimed at financial re-regulation.34 One of the important questions is: Has ‘Too Big to Fail’ been solved? The banking industry tends to answer in the affirmative and is pushing (with some success) for regulatory relief from compliance burdens. The academic community is more circumspect. In this paper, we surveyed the proposed solutions (the breakup of big banks, higher equity requirements, inducing banks to alter their business models toward less risky practices, living wills, stress tests), and the regulatory initiatives undertaken (Basel III, Dodd–Frank Act). We also carried out a longitudinal analysis of major U.S. banks. Our main findings are that since the crisis: (a) banks have grown in size, (b) they are funding a higher proportion of their assets with equity capital but not to the extent considered appropriate by some academics, (c) it remains an open question whether banks are following less risky practices and (d) it is too early to conclude whether financial stability can be taken for granted, though it is undeniable that significant progress has been made in measuring and monitoring systemic risks.
Author Contributions
Conceptualization, S.T.; Data curation, B.S.; Investigation, B.S.; Supervision, S.T.; Writing—original draft, S.T.; Writing—review and editing, S.T.
Funding
This research received no external funding.
Conflicts of Interest
The authors declare no conflict of interest.
References
- Acharya, Viral V., Lasse H. Pedersen, Thomas Philippon, and Matthew Richardson. 2017. Measuring systemic risk. Review of Financial Studies 30: 1–47. [Google Scholar] [CrossRef]
- Admati, Anat, and Martin Hellwig. 2013. The Bankers’ New Clothes: What’s Wrong with Banking and What to Do about It. Princeton: Princeton University Press. [Google Scholar]
- Barth, James R., and Clas Wihlborg. 2017. Too big to fail: Measures, remedies, and consequences for efficiency and stability. Financial Markets, Institutions & Instruments 26: 175–245. [Google Scholar]
- Barth, James R., Apanard P. Prabha, and Phillip Swagel. 2012. Just how big is the too-big-too-fail problem? Journal of Banking Regulation 13: 265–99. [Google Scholar] [CrossRef]
- Bhagat, Sanjai. 2017. Precrisis Executive Compensation and Misaligned Incentives. In Financial Crisis, Corporate Governance, and Bank Capital. Cambridge: Cambridge University Press, chp. 3. pp. 24–29. [Google Scholar]
- Brooke, Martin, Oliver Bush, Robert Edwards, Jas Ellis, Bill Francis, Rashmi Harimohan, Katherine Neiss, and Caspar Siegert. 2015. Measuring the Macroeconomic Costs and Benefits of Higher UK Bank Capital Requirements. Financial Stability Paper No. 25. London: Bank of England. [Google Scholar]
- Brownlees, Christian T., and Robert F. Engle. 2016. SRISK: A Conditional Capital Shortfall Measure of Systemic Risk. Available online: https://ssrn.com/abstract=1611229 (accessed on 25 November 2018).
- Carmassi, Jacopo, and Richard Herring. 2013. Living wills and cross-border resolution of systemically important banks. Journal of Financial Economic Policy 5: 361–87. [Google Scholar] [CrossRef]
- Cetorelli, Nicola, and James Traina. 2018. Resolving ‘Too Big to Fail’. Federal Reserve Bank of New York, Liberty Street Economics (blog). Available online: https://libertystreeteconomics.newyorkfed.org/2018/10/resolving-too-big-to-fail.html (accessed on 24 November 2018).
- Chousakos, Kyriakos T., and Gary B. Gorton. 2017. Bank Health Post-Crisis. NBER Working Paper 23167. Cambridge: National Bureau of Economic Research. [Google Scholar]
- Cochrane, John H. 2014. Toward a run-free financial system. In Across the Great Divide: New Perspectives on the Financial Crisis. Edited by Martin Neil Baily and John B. Taylor. Stanford: Hoover Institution, Stanford University, chp. 10. [Google Scholar]
- Engle, Robert F., and Tianyue Ruan. 2018. How Much SRISK is Too Much? Available online: https://ssrn.com/abstract=3108269 (accessed on 29 October 2018).
- Flannery, Mark. 2014. Maintaining adequate bank capital. Journal of Money, Credit and Banking 46: 157–80. [Google Scholar] [CrossRef]
- Hughes, Joseph P., and Loretta J. Mester. 2013. Who said large banks don’t experience scale economies? Evidence from a risk-return-driven cost function. Journal of Financial Intermediation 22: 559–85. [Google Scholar] [CrossRef]
- Jaggia, Sanjiv, and Satish Thosar. 2017. Pay-for-performance incentives in the finance sector and the financial crisis. Managerial Finance 43: 646–62. [Google Scholar] [CrossRef]
- Johnson, Simon, and James Kwak. 2011. 13 Bankers: The Wall Street Takeover and the Next Financial Meltdown. New York: Vintage Books. [Google Scholar]
- Kisin, Roni, and Asaf Manela. 2016. The shadow cost of bank capital requirements. Review of Financial Studies 29: 1780–20. [Google Scholar] [CrossRef]
- Kovner, Anna, and Peter Van Tassel. 2018. Regulatory Changes and the Cost of Capital for Banks. Staff Report No. 854. New York: Federal Reserve Bank of New York. [Google Scholar]
- Milne, Alistair. 2014. Distance to default and the financial crisis. Journal of Financial Stability 12: 26–36. [Google Scholar] [CrossRef]
- Modigliani, Franco, and Merton H. Miller. 1958. The cost of capital, corporation finance and the theory of investment. American Economic Review 48: 261–97. [Google Scholar]
- Molyneux, Philip. 2017. Are banks public utilities? Evidence from Europe. Journal of Economic Policy Reform 20: 199–213. [Google Scholar] [CrossRef]
- Noss, Joseph, and Rhiannon Sowerbutts. 2012. The Implicit Subsidy of Banks. Financial Stability Paper No. 15. London: Bank of England. [Google Scholar]
- Sarin, Natasha, and Lawrence H. Summers. 2016. Have Big Banks Gotten Safer? BPEA Conference Draft, Washington D.C. Available online: https://www.brookings.edu/bpea-articles/have-big-banks-gotten-safer/ (accessed on 20 October 2018).
- Slovik, Patrick, and Boris Cournede. 2011. Macroeconomic Impact of Basel III. In OECD Economics Departmen. Working Paper 844. Paris: OECD. [Google Scholar]
- Stern, Gary, and Ron Feldman. 2004. Too Big to Fail: The Hazards of Bank Bailouts. Washington, DC: Brookings Institution Press. [Google Scholar]
- White, Alan M. 2016. Banks as utilities. Tulane Law Review 90. Available online: https://ssrn.com/abstract=2847815 (accessed on 25 November 2018).
| 1 | https://www.federalreserve.gov/newsevents/testimony/bernanke20100902a.htm. See also Stern and Feldman (2004) for an early comprehensive discussion of the Too Big to Fail (TBTF) issue. |
| 2 | See page 18 of the annual report which also outlines the factors and analysis leading up to the cited remark about TBTF. |
| 3 | See also Chousakos and Gorton (2017) who state that “Post-crisis regulatory changes have aimed at restoring bank health, but measuring bank health by Tobin’s Q, we find that the ill health of banks in the recent U.S. financial crisis and the Euro crisis has persisted, especially compared to other crises in advanced economies.” |
| 4 | In this regard, our discussion and analysis is primarily based on the U.S. experience. |
| 5 | All four are considered to be global systemically important banks (G-SIBs) per the 16 November 2018 list published by the Financial Stability Board in consultation with the Basel Committee on Banking Supervision. |
| 6 | Of these: Bank of New York Mellon and State Street are G-SIBs, while the other two are large enough in terms of assets to be considered domestic SIFIs or Systemically Important Financial Institutions. |
| 7 | See, for example, the outputs produced by the Volatility Lab at New York University. https://vlab.stern.nyu.edu/. |
| 8 | In the U.S., this primarily refers to the Dodd–Frank Wall Street Reform and Consumer Protection Act (2010) though this has been partially scaled back by the Economic Growth, Regulatory Relief and Consumer Protection Act (2018). |
| 9 | See “Breaking Up Four Big Banks” and “Break Up the Big Banks” in the New York Times dated 10 May 2012 and 29 June 2016, respectively, and “The End of Big Banks” in Project Syndicate dated 29 February 2016. |
| 10 | |
| 11 | https://www.sanders.senate.gov/newsroom/press-releases/sanders-sherman-introduce-legislation-to-break-up-too-big-to-fail-financial-institutions. It is worth noting that both Sanders and Sherman were in the minority in the Senate and House, respectively, and it is extremely unlikely that this legislation will pass (or even be taken up for consideration) in the near future. |
| 12 | Hughes and Mester (2013) suggest that significant economies of scale exist in the banking sector, which are not driven by TBTF considerations. |
| 13 | Expressed in 2015 dollars. |
| 14 | Work on Basel IV is underway. See the McKinsey and Company (2017) report, titled: Basel “IV”: What’s Next for Banks? https://www.mckinsey.com/~/media/mckinsey/business%20functions/risk/our%20insights/basel%20iv%20whats%20next%20for%20european%20banks/basel-iv-whats-next-for-banks.ashx. |
| 15 | See “From Basel to the Volcker Rule” for a Useful Glossary of Financial Regulation Terms. https://www.moneyandbanking.com/commentary/2018/11/18/from-basel-to-the-volcker-rule-a-finreg-glossary. |
| 16 | |
| 17 | The Tier 1, capital ratio is the ratio of a bank’s core equity capital to its total risk-weighted assets. Risk-weighted assets are the total of all assets held by the bank weighted by credit risk according to a formula determined by the regulator (usually the country’s central bank). |
| 18 | This is akin to a borrower taking out a home mortgage loan being required to put up a 20 percent down payment. |
| 19 | See Brooke et al. (2015) and Kovner and Van Tassel (2018) for detailed analyses. Estimates of increases in cost of capital vary from modest (Kisin and Manela 2016) to high (Slovik and Cournede 2011). |
| 20 | These ratios are based on published annual reports using U.S. Generally Accepted Accounting Principles (GAAP). Basel III’s recommended exposure measure includes off balance sheet items (such as derivatives, loan commitments) in the denominator whose inclusion would shrink the ratio. |
| 21 | |
| 22 | See Noss and Sowerbutts (2012). |
| 23 | |
| 24 | See the Financial Crisis Inquiry Report (Part II, pp. 27–82). https://www.gpo.gov/fdsys/pkg/GPO-FCIC/pdf/GPO-FCIC.pdf. |
| 25 | “Should Big Banks Be Regulated as Utilities” dated 14 April 2011 in The Atlantic magazine. |
| 26 | “Who’s Bullish on Banks as Utilities?” in the American Banker dated 18 April 2016. |
| 27 | |
| 28 | |
| 29 | This is based on a standard approximation of leverage. See, for example, Acharya et al. (2017, p. 15). |
| 30 | See Barth et al. (2012) for a more comprehensive treatment. |
| 31 | See Cetorelli and Traina (2018) for an analysis of the impact of living wills. |
| 32 | “Those of us who have looked to the self-interest of lending institutions to protect shareholders’ equity, myself included, are in a state of shocked disbelief” said Alan Greenspan, former Federal Reserve chairman in testifying before the House Committee on Oversight and Government Reform. See New York Times article: “Greenspan Concedes Error on Regulation” dated 23 October 2008. |
| 33 | See for example: Acharya et al. (2017), Brownlees and Engle (2016), Engle and Ruan (2018) and the real-time analyses at the Volatility Lab, New York University. |
| 34 |
Figure 1.
Average Total Assets in millions of 2015 Dollars. Notes: Top-Tier: JPMorgan Chase, Bank of America, Citigroup, and Wells Fargo; Mid-tier: Bank of New York Mellon, State Street, US Bancorp, and PNC Financial Services Group; Low-tier: Capital One Financial, BB&T, SunTrust Banks, and Regions Financial. Pre-crisis: 2005–2007; Crisis: 2008–2010; Post-Crisis: 2011–2013; Normalcy: 2014–2016. Data obtained from published financial reports.

Figure 2.
Tier-1 Capital Ratios. Notes: Top-Tier: JPMorgan Chase, Bank of America, Citigroup, and Wells Fargo; Mid-tier: Bank of New York Mellon, State Street, US Bancorp, and PNC Financial Services Group; Low-tier: Capital One Financial, BB&T, SunTrust Banks, and Regions Financial. Pre-crisis: 2005–2007; Crisis: 2008–2010; Post-Crisis: 2011–2013; Normalcy: 2014–2016. Data obtained from published financial reports.

Figure 3.
Shareholder Equity/Total Assets Ratio. Notes: Top-Tier: JPMorgan Chase, Bank of America, Citigroup, Wells Fargo; Mid-tier: Bank of New York Mellon, State Street, US Bancorp, PNC Financial Services Group; Low-tier: Capital One Financial, BB&T, SunTrust Banks, Regions Financial. Pre-crisis: 2005–2007; Crisis: 2008–2010; Post-Crisis: 2011–2013; Normalcy: 2014–2016. Data obtained from published financial reports.

Figure 4.
(A) Cost of Equity. (B) Weighted Average Cost of Capital (WACC). Notes: Top-Tier: JPMorgan Chase, Bank of America, Citigroup, and Wells Fargo; Mid-tier: Bank of New York Mellon, State Street, US Bancorp, and PNC Financial Services Group; Low-tier: Capital One Financial, BB&T, SunTrust Banks, and Regions Financial. Pre-crisis: 2005–2007; Crisis: 2008–2010; Post-Crisis: 2011–2013; Normalcy: 2014–2016. Cost of equity based on the standard Capital Asset Pricing Model. For WACC calculation, Cost of Debt = Total Interest Expense/Total Liabilities; Cost of Equity from CAPM (Panel A); Weight of Debt = Total Liabilities/(Total Liabilities + Market Value of Equity); Weight of Equity = Market Value of Equity/(Total Liabilities + Market Value of Equity); Tax rate = Tax expense/Operating Income. Other than market data, all other items are book values from published annual reports.


Figure 5.
(A) Loans/Total Assets Ratio. (B) Interest Income/Total Income Ratio. Notes: Top-Tier: JPMorgan Chase, Bank of America, Citigroup, and Wells Fargo; Mid-tier: Bank of New York Mellon, State Street, US Bancorp, and PNC Financial Services Group; Low-tier: Capital One Financial, BB&T, SunTrust Banks, and Regions Financial. Pre-crisis: 2005–2007; Crisis: 2008–2010; Post-Crisis: 2011–2013; Normalcy: 2014–2016. Data obtained from published financial reports.

Figure 6.
(A) Leverage. (B) Volatility. Notes: Top-Tier: JPMorgan Chase, Bank of America, Citigroup, and Wells Fargo; Mid-tier: Bank of New York Mellon, State Street, US Bancorp, and PNC Financial Services Group; Low-tier: Capital One Financial, BB&T, SunTrust Banks, and Regions Financial. Pre-crisis: 2005–2007; Crisis: 2008–2010; Post-Crisis: 2011–2013; Normalcy: 2014–2016. Leverage = (Book Assets − Book Equity + Market equity)/Market Equity. Volatility is the standard deviation of daily stock returns. Other than market data, all other items are book values from published annual reports.

© 2019 by the authors. Licensee MDPI, Basel, Switzerland. This article is an open access article distributed under the terms and conditions of the Creative Commons Attribution (CC BY) license (http://creativecommons.org/licenses/by/4.0/).
Share and Cite
MDPI and ACS Style
Thosar, S.; Schwandt, B. Has ‘Too Big To Fail’ Been Solved? A Longitudinal Analysis of Major U.S. Banks. J. Risk Financial Manag. 2019, 12, 24. https://doi.org/10.3390/jrfm12010024
AMA Style
Thosar S, Schwandt B. Has ‘Too Big To Fail’ Been Solved? A Longitudinal Analysis of Major U.S. Banks. Journal of Risk and Financial Management. 2019; 12(1):24. https://doi.org/10.3390/jrfm12010024
Chicago/Turabian StyleThosar, Satish, and Bradley Schwandt. 2019. "Has ‘Too Big To Fail’ Been Solved? A Longitudinal Analysis of Major U.S. Banks" Journal of Risk and Financial Management 12, no. 1: 24. https://doi.org/10.3390/jrfm12010024