Early Fault Detection Method for Rotating Machinery Based on Harmonic-Assisted Multivariate Empirical Mode Decomposition and Transfer Entropy

Abstract
:1. Introduction
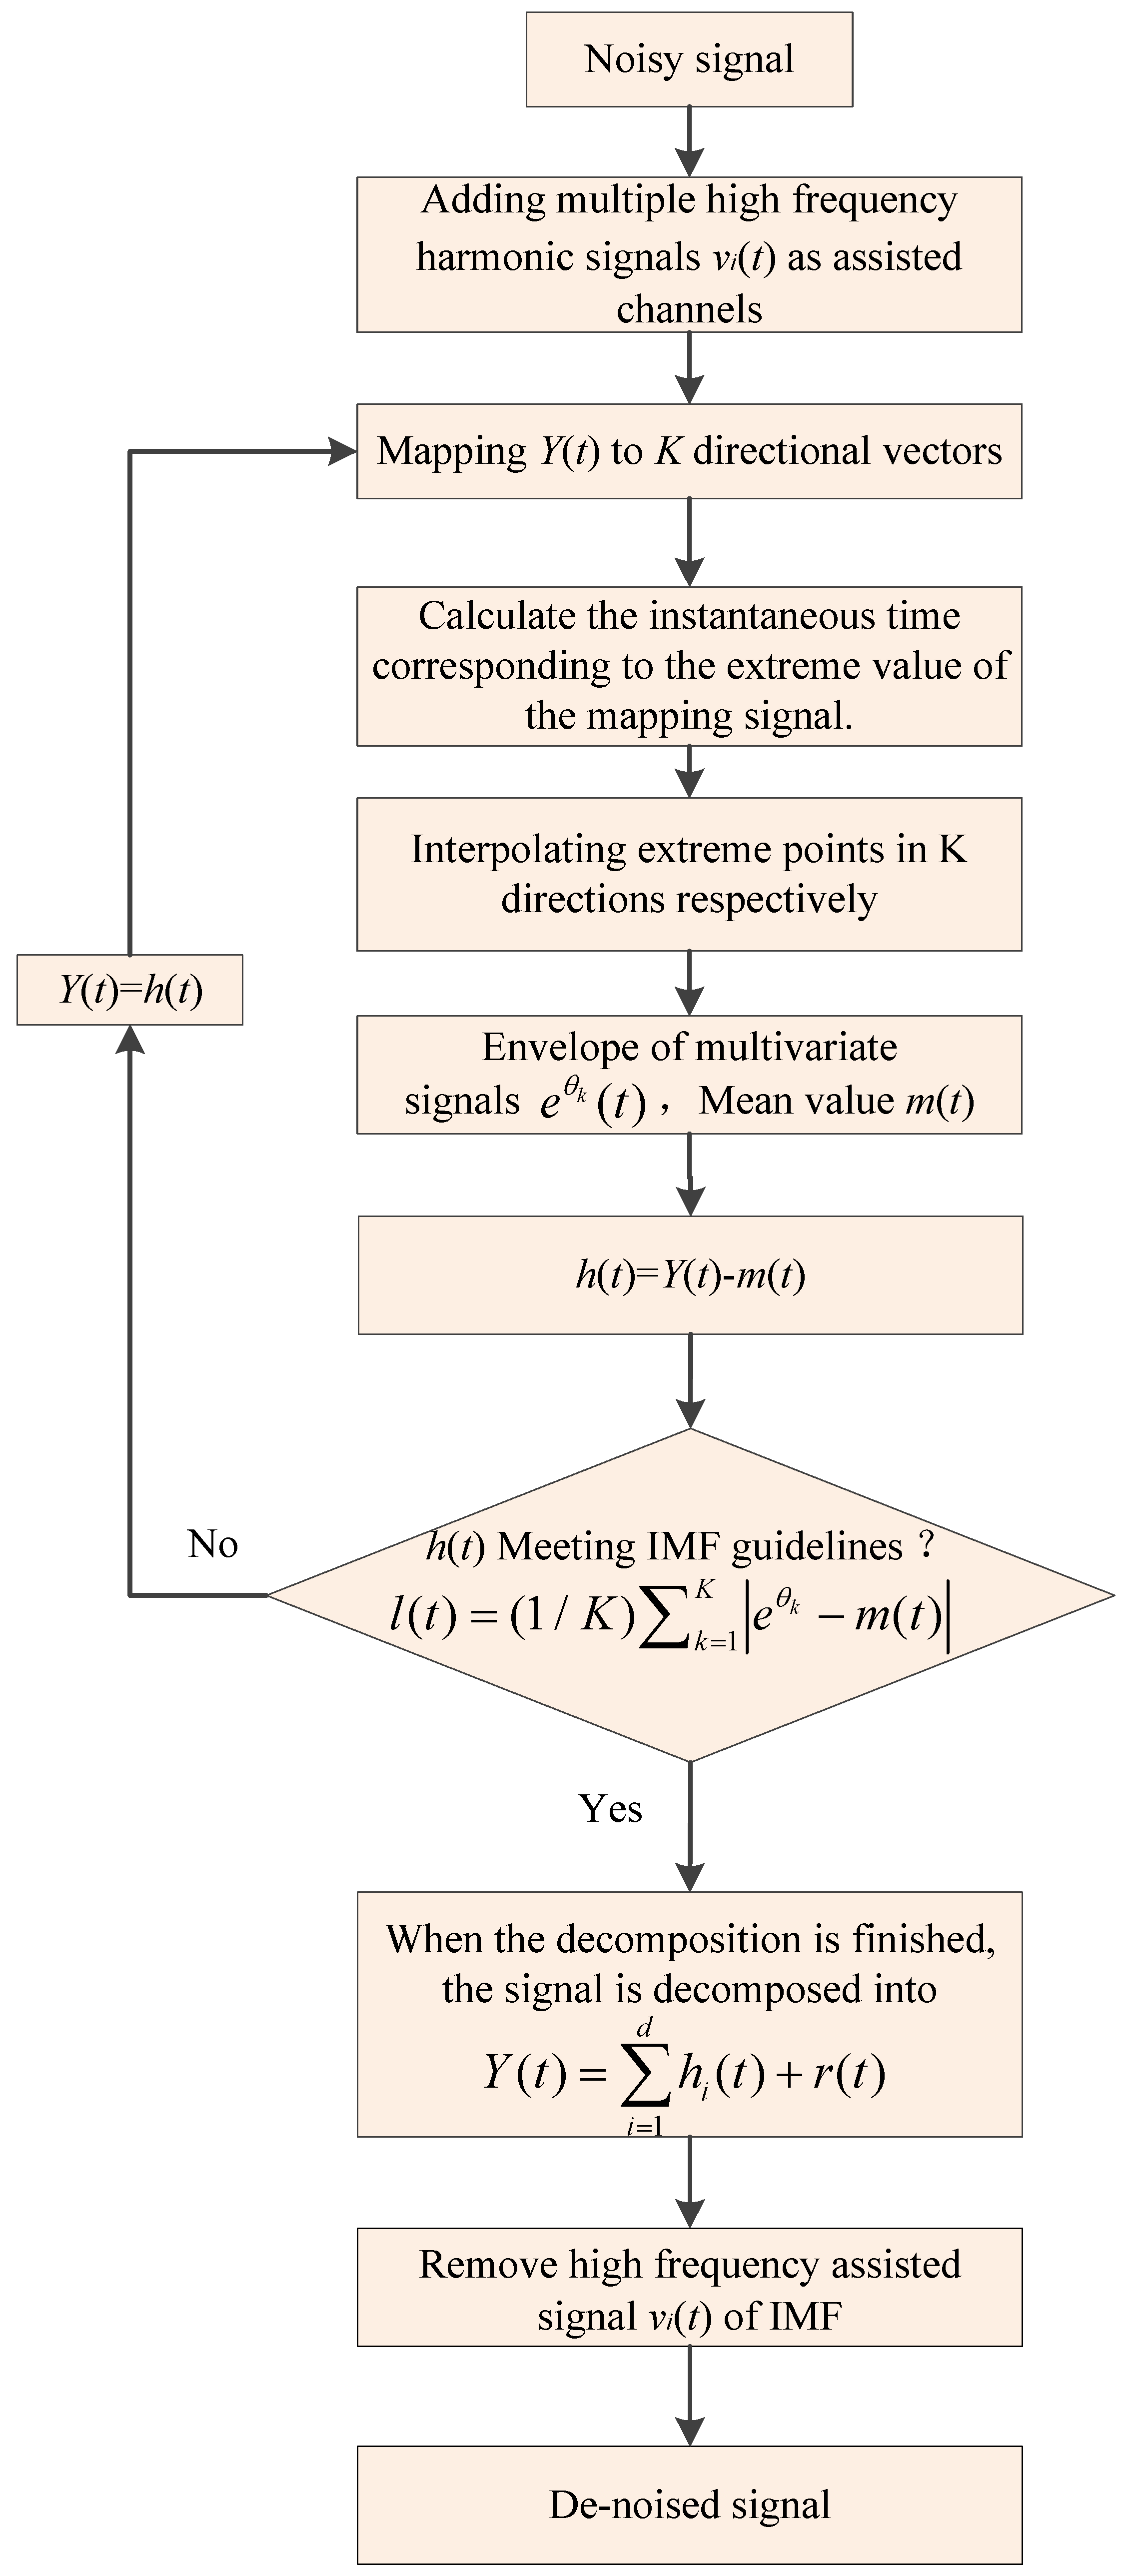
2. HA-MEMD
3. Transfer Entropy
4. Early Degradation State Recognition Method of Rotating Machinery Based on HA-MEMD and Transfer Entropy
- (1)
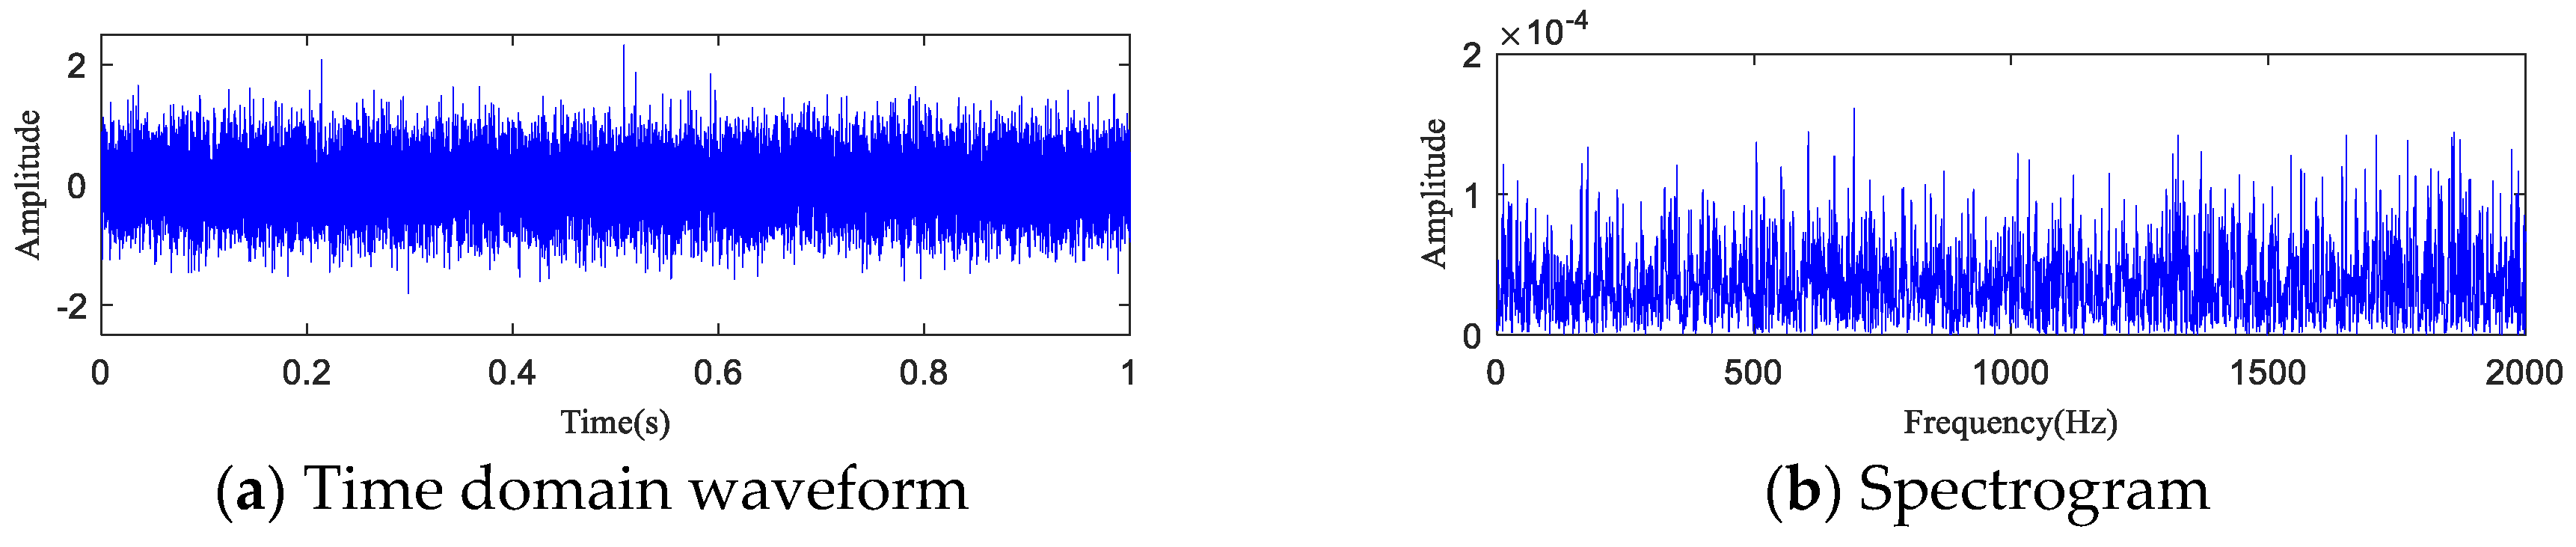
- Test data acquisition and denoising: The vibration signal is subjected to active noise cancellation by subjecting the acquired bearing vibration data to HA-MEMD decomposition, reconstructing the IMF components that contain key information, and removing the false components.
- (2)
- Time series transfer entropy analysis: The transfer entropy between various time series is computed and the performance index for an accurate reflection of the bearing fault evolution trend is established.
- (3)
- Mechanical fault evolution analysis and fault diagnosis: The stable and accurate fault thresholds are set based on early and stationary monitoring of transfer entropy variation, the transfer entropy trend is monitored in real time, and the rotating machinery is subjected to state recognition and fault diagnosis.
5. Numerical Simulation
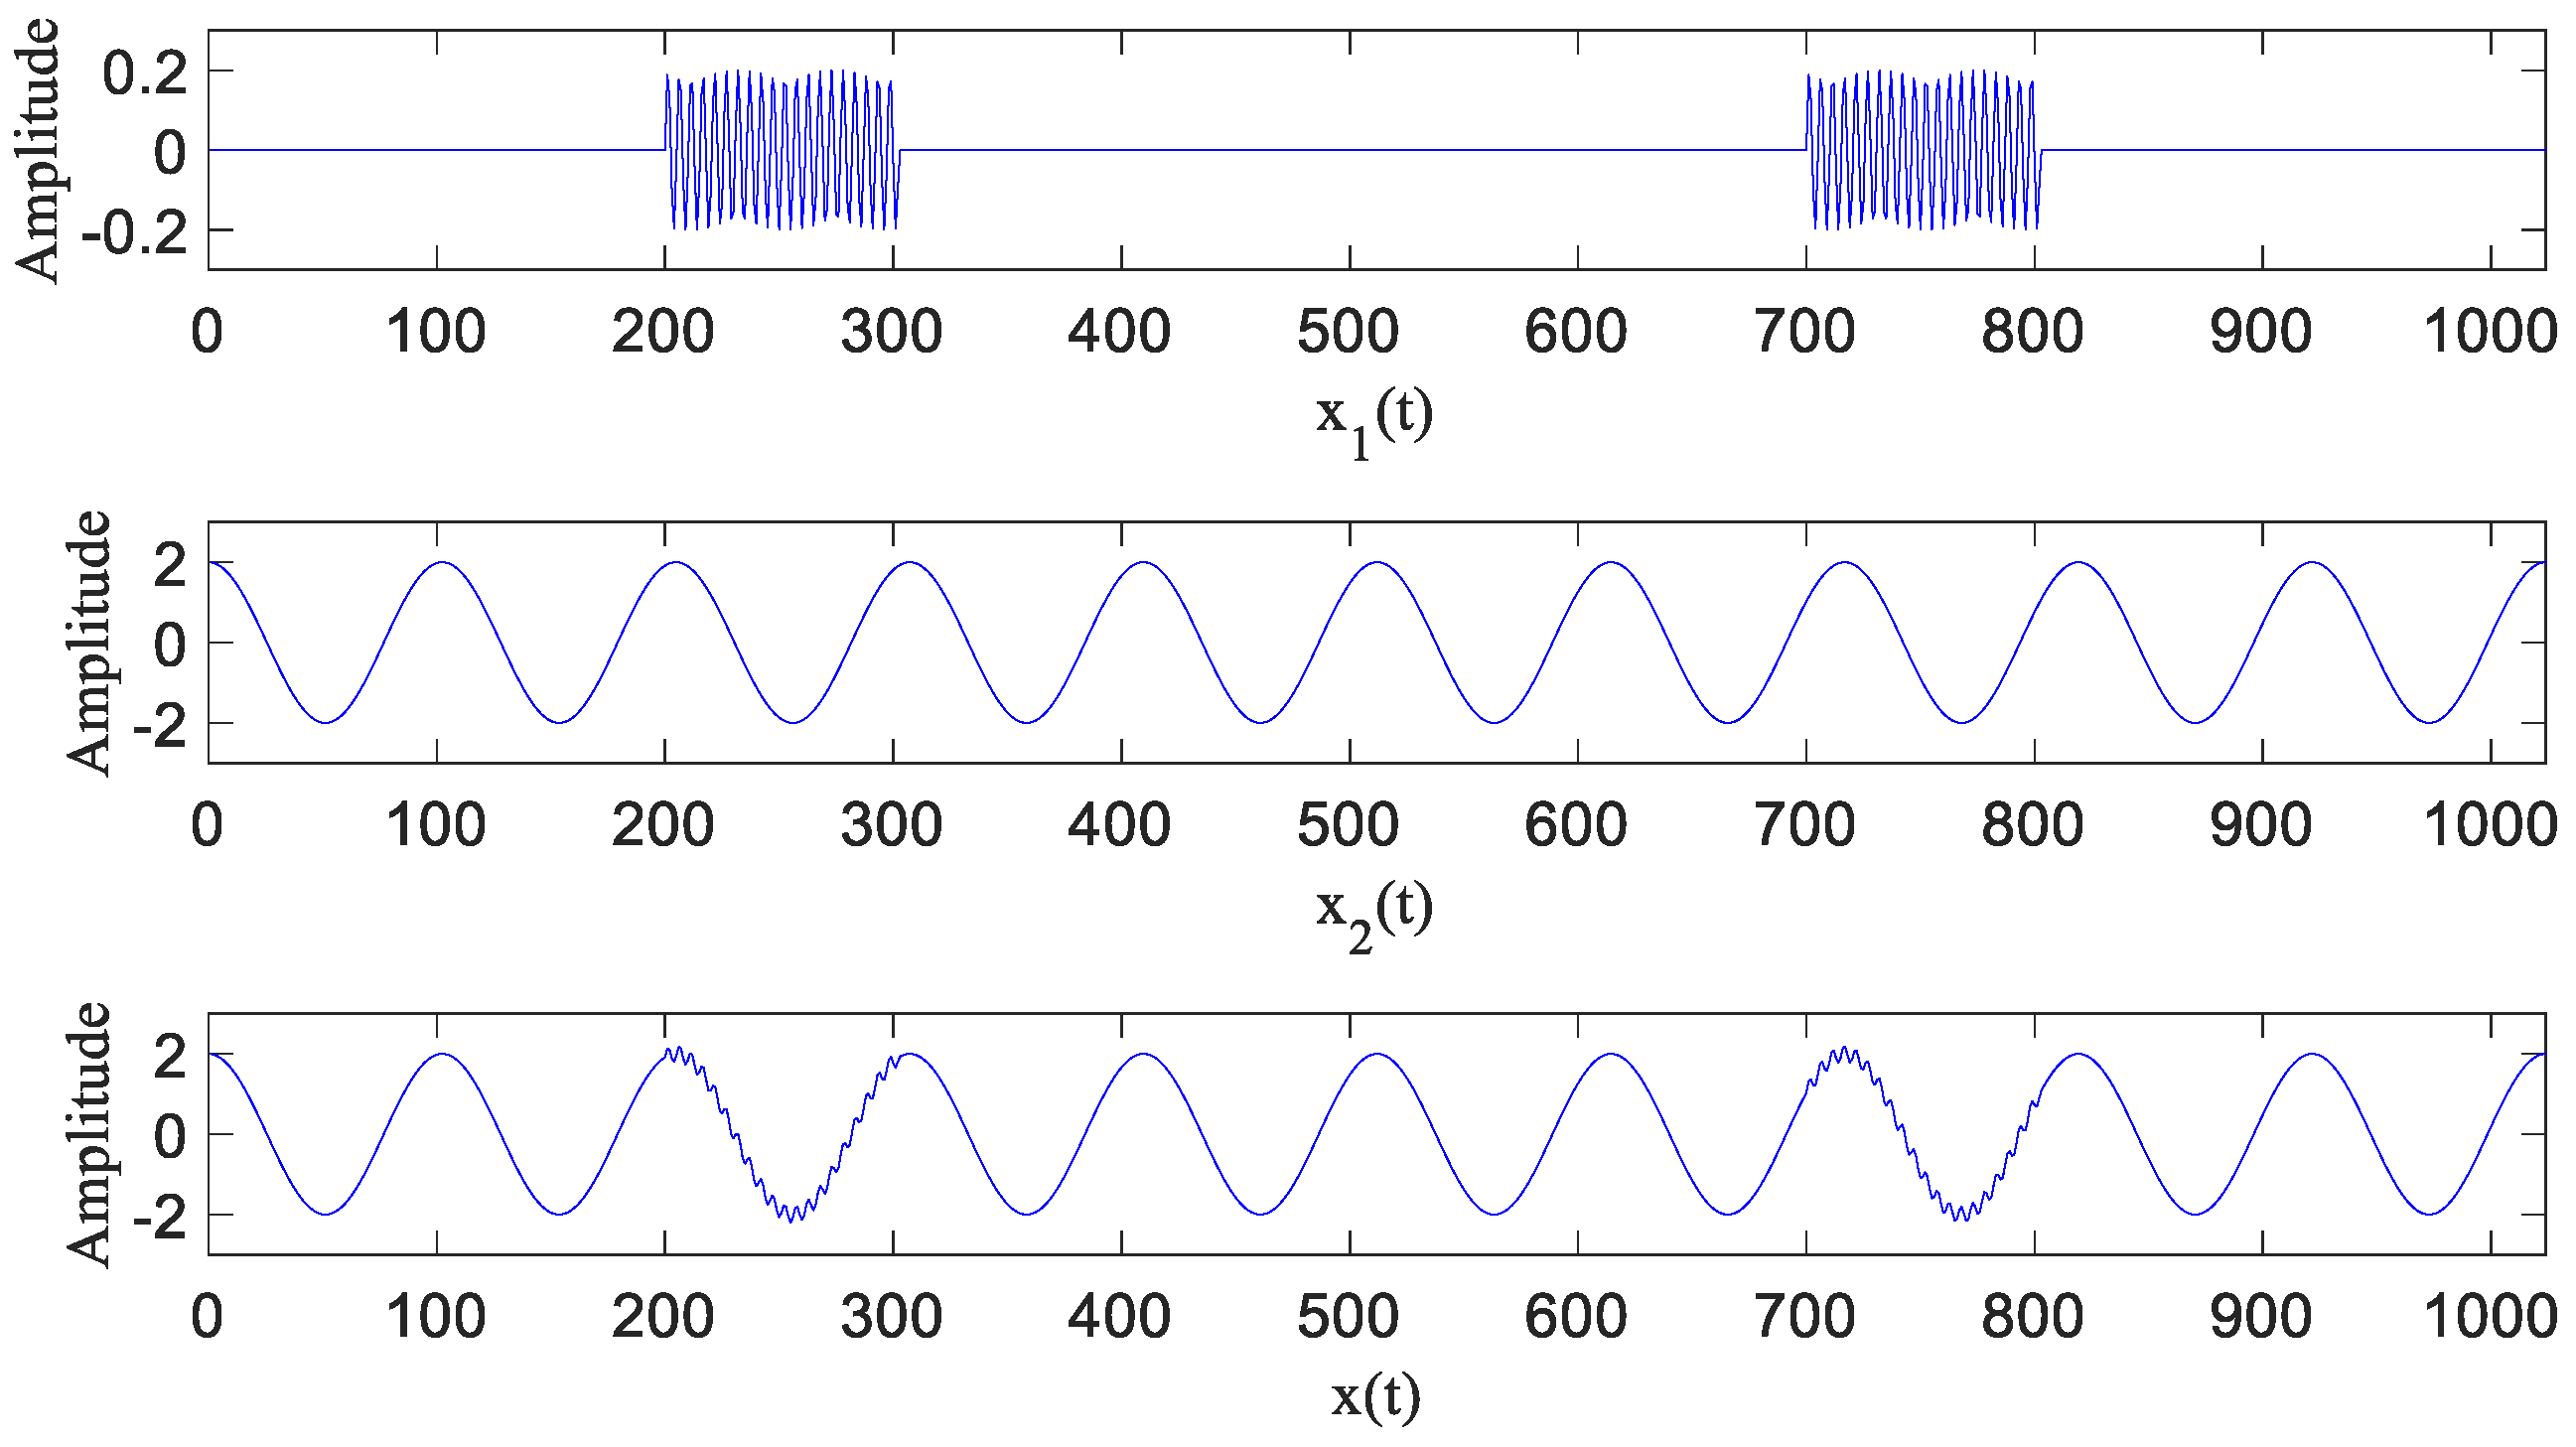
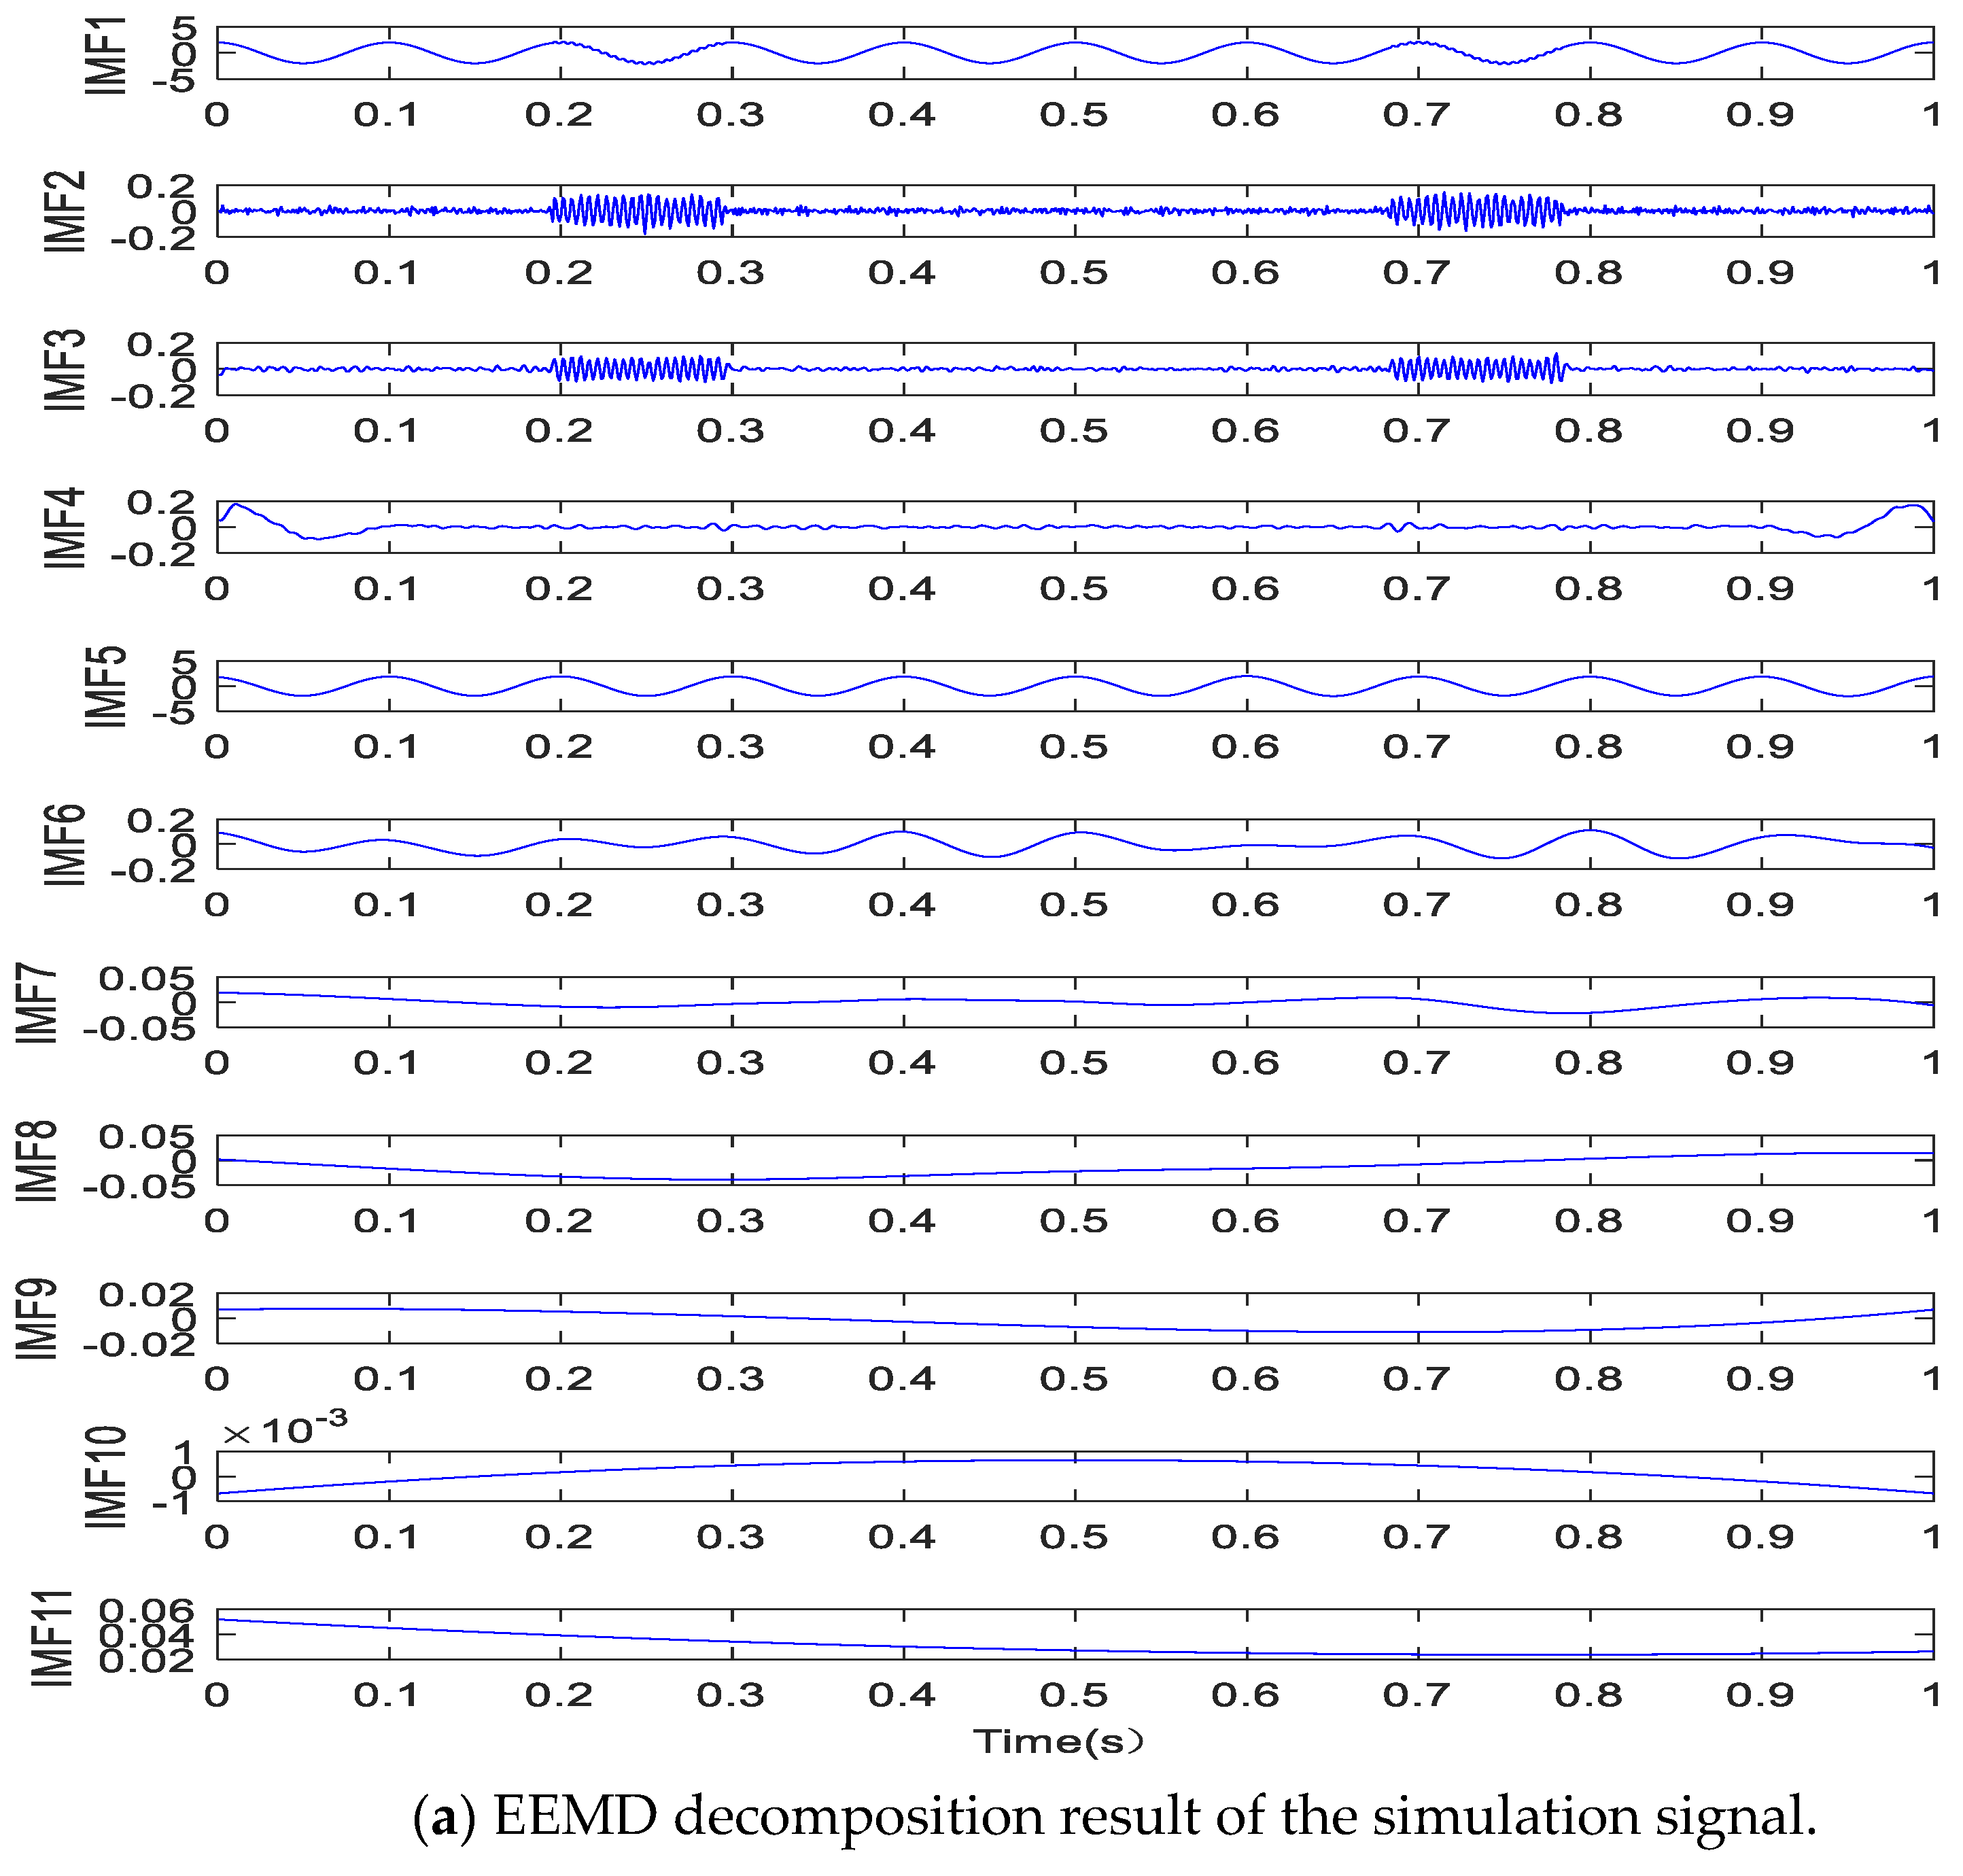
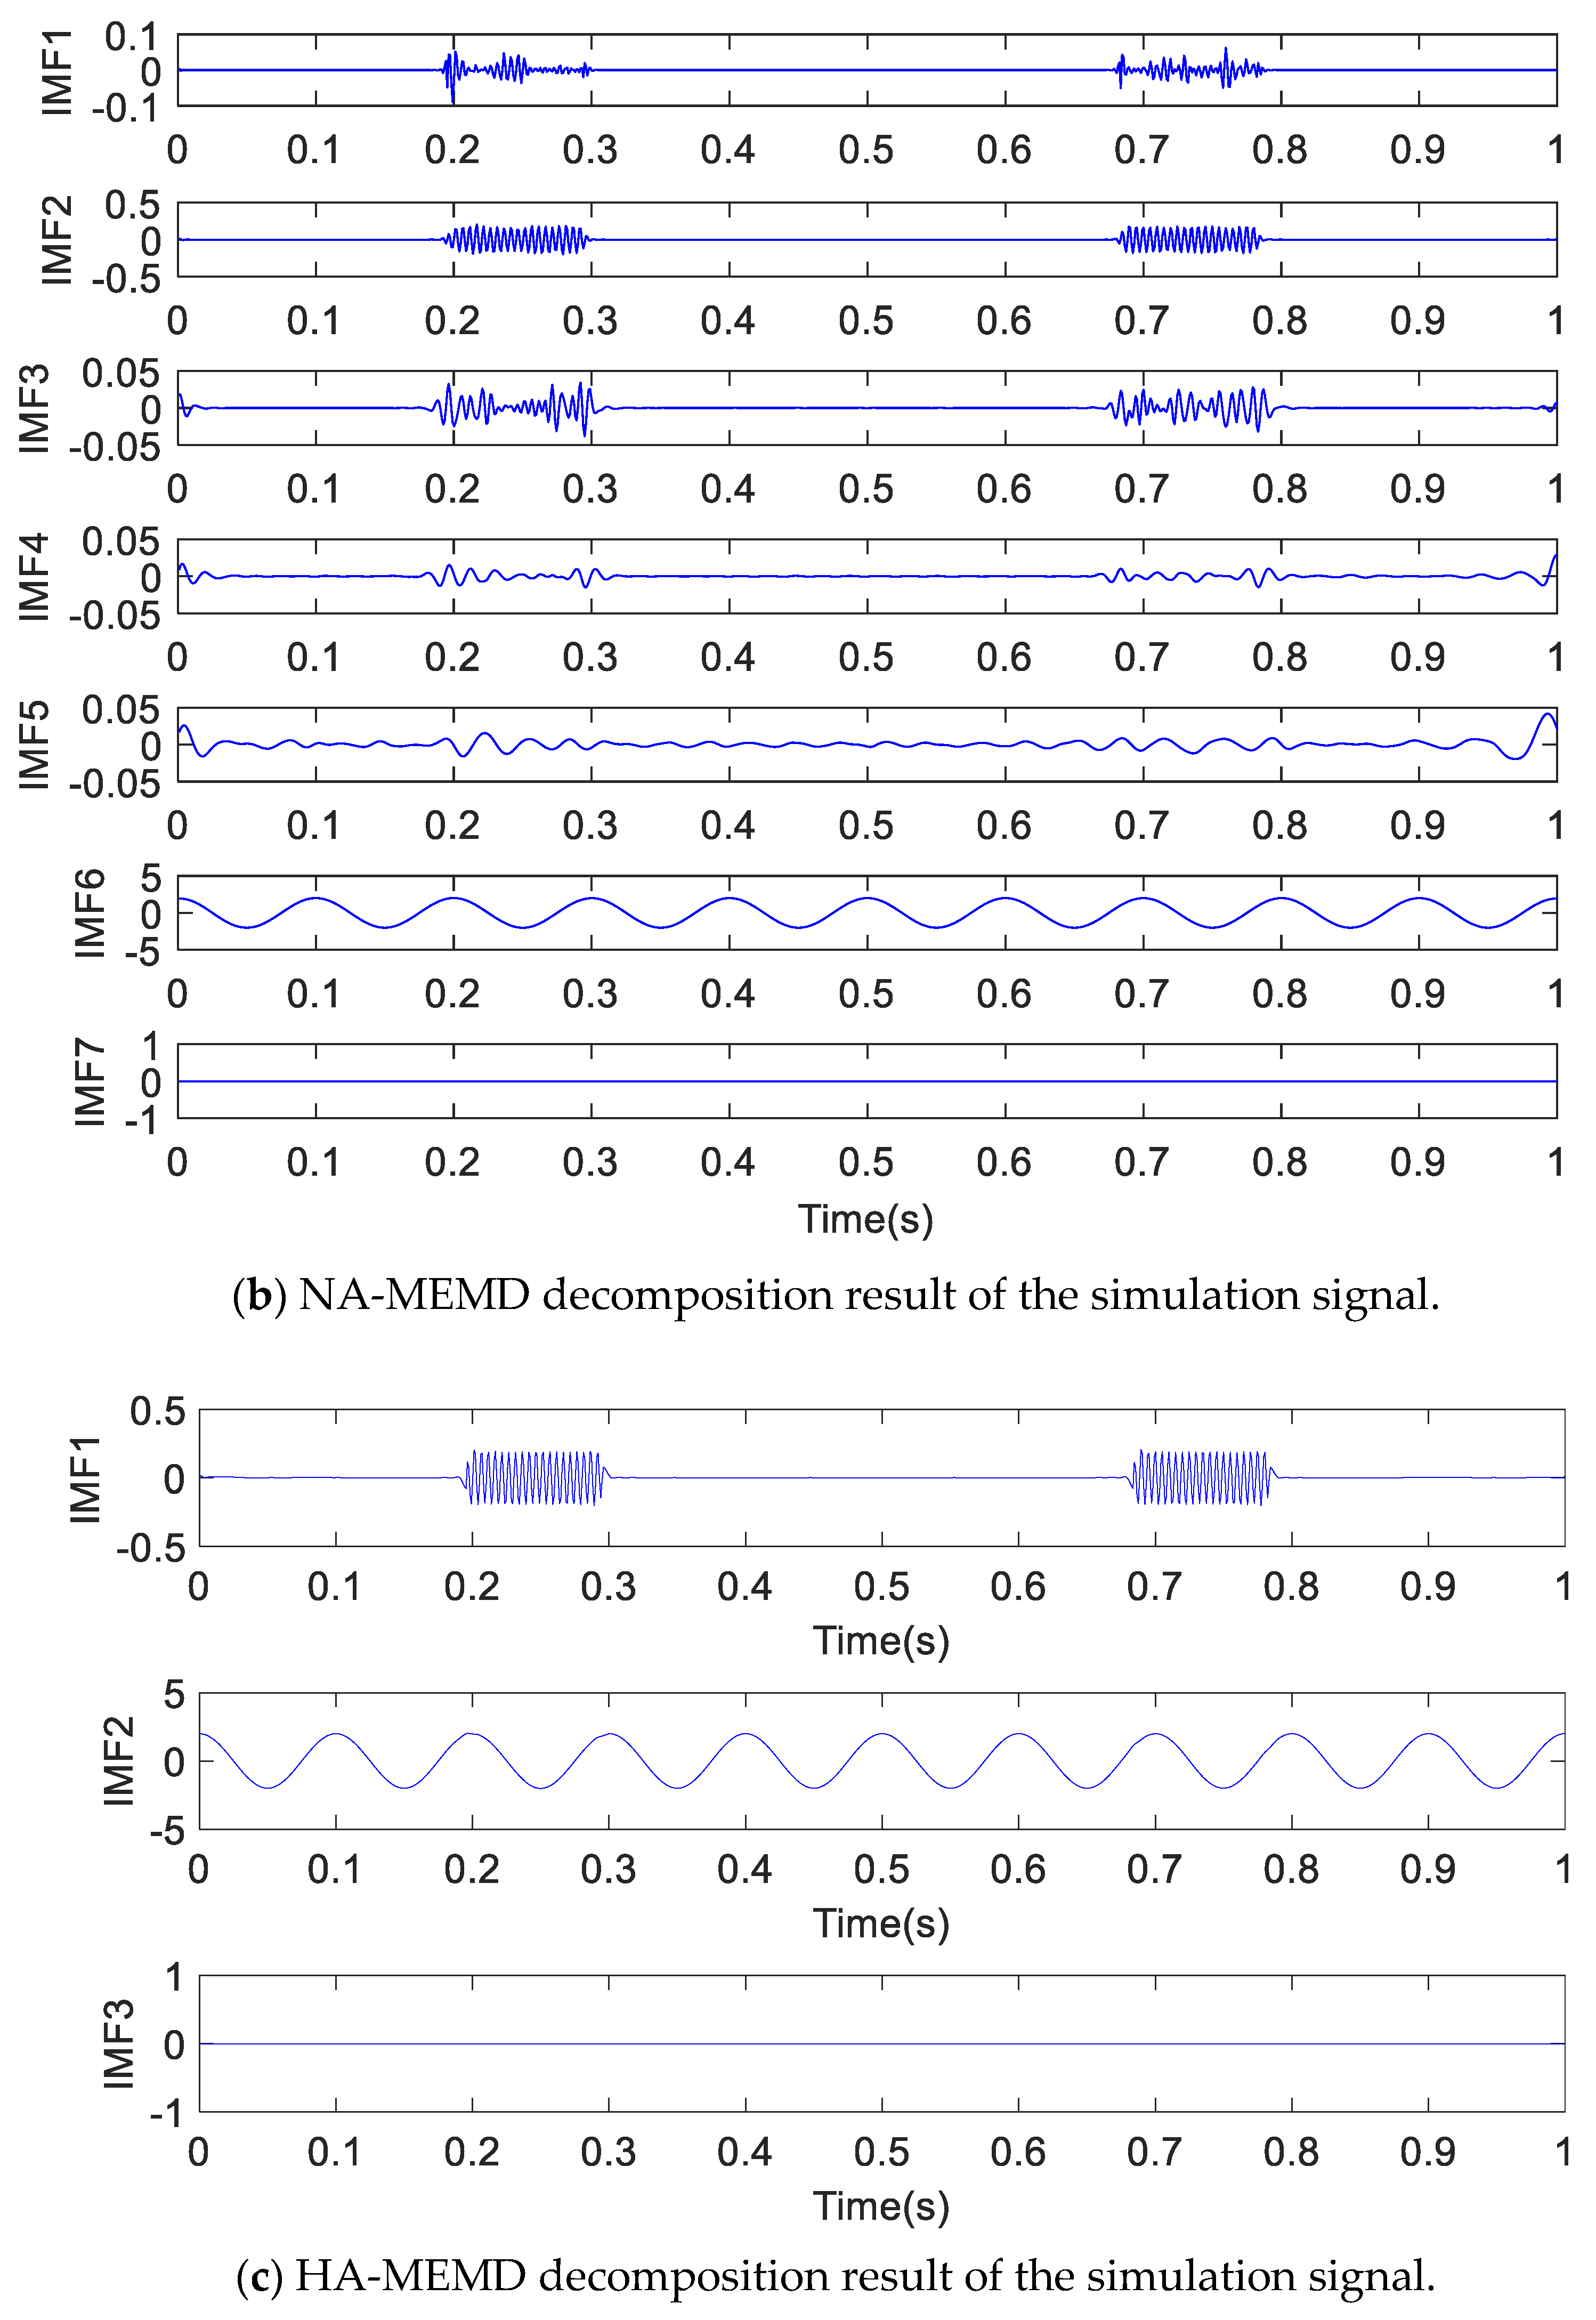
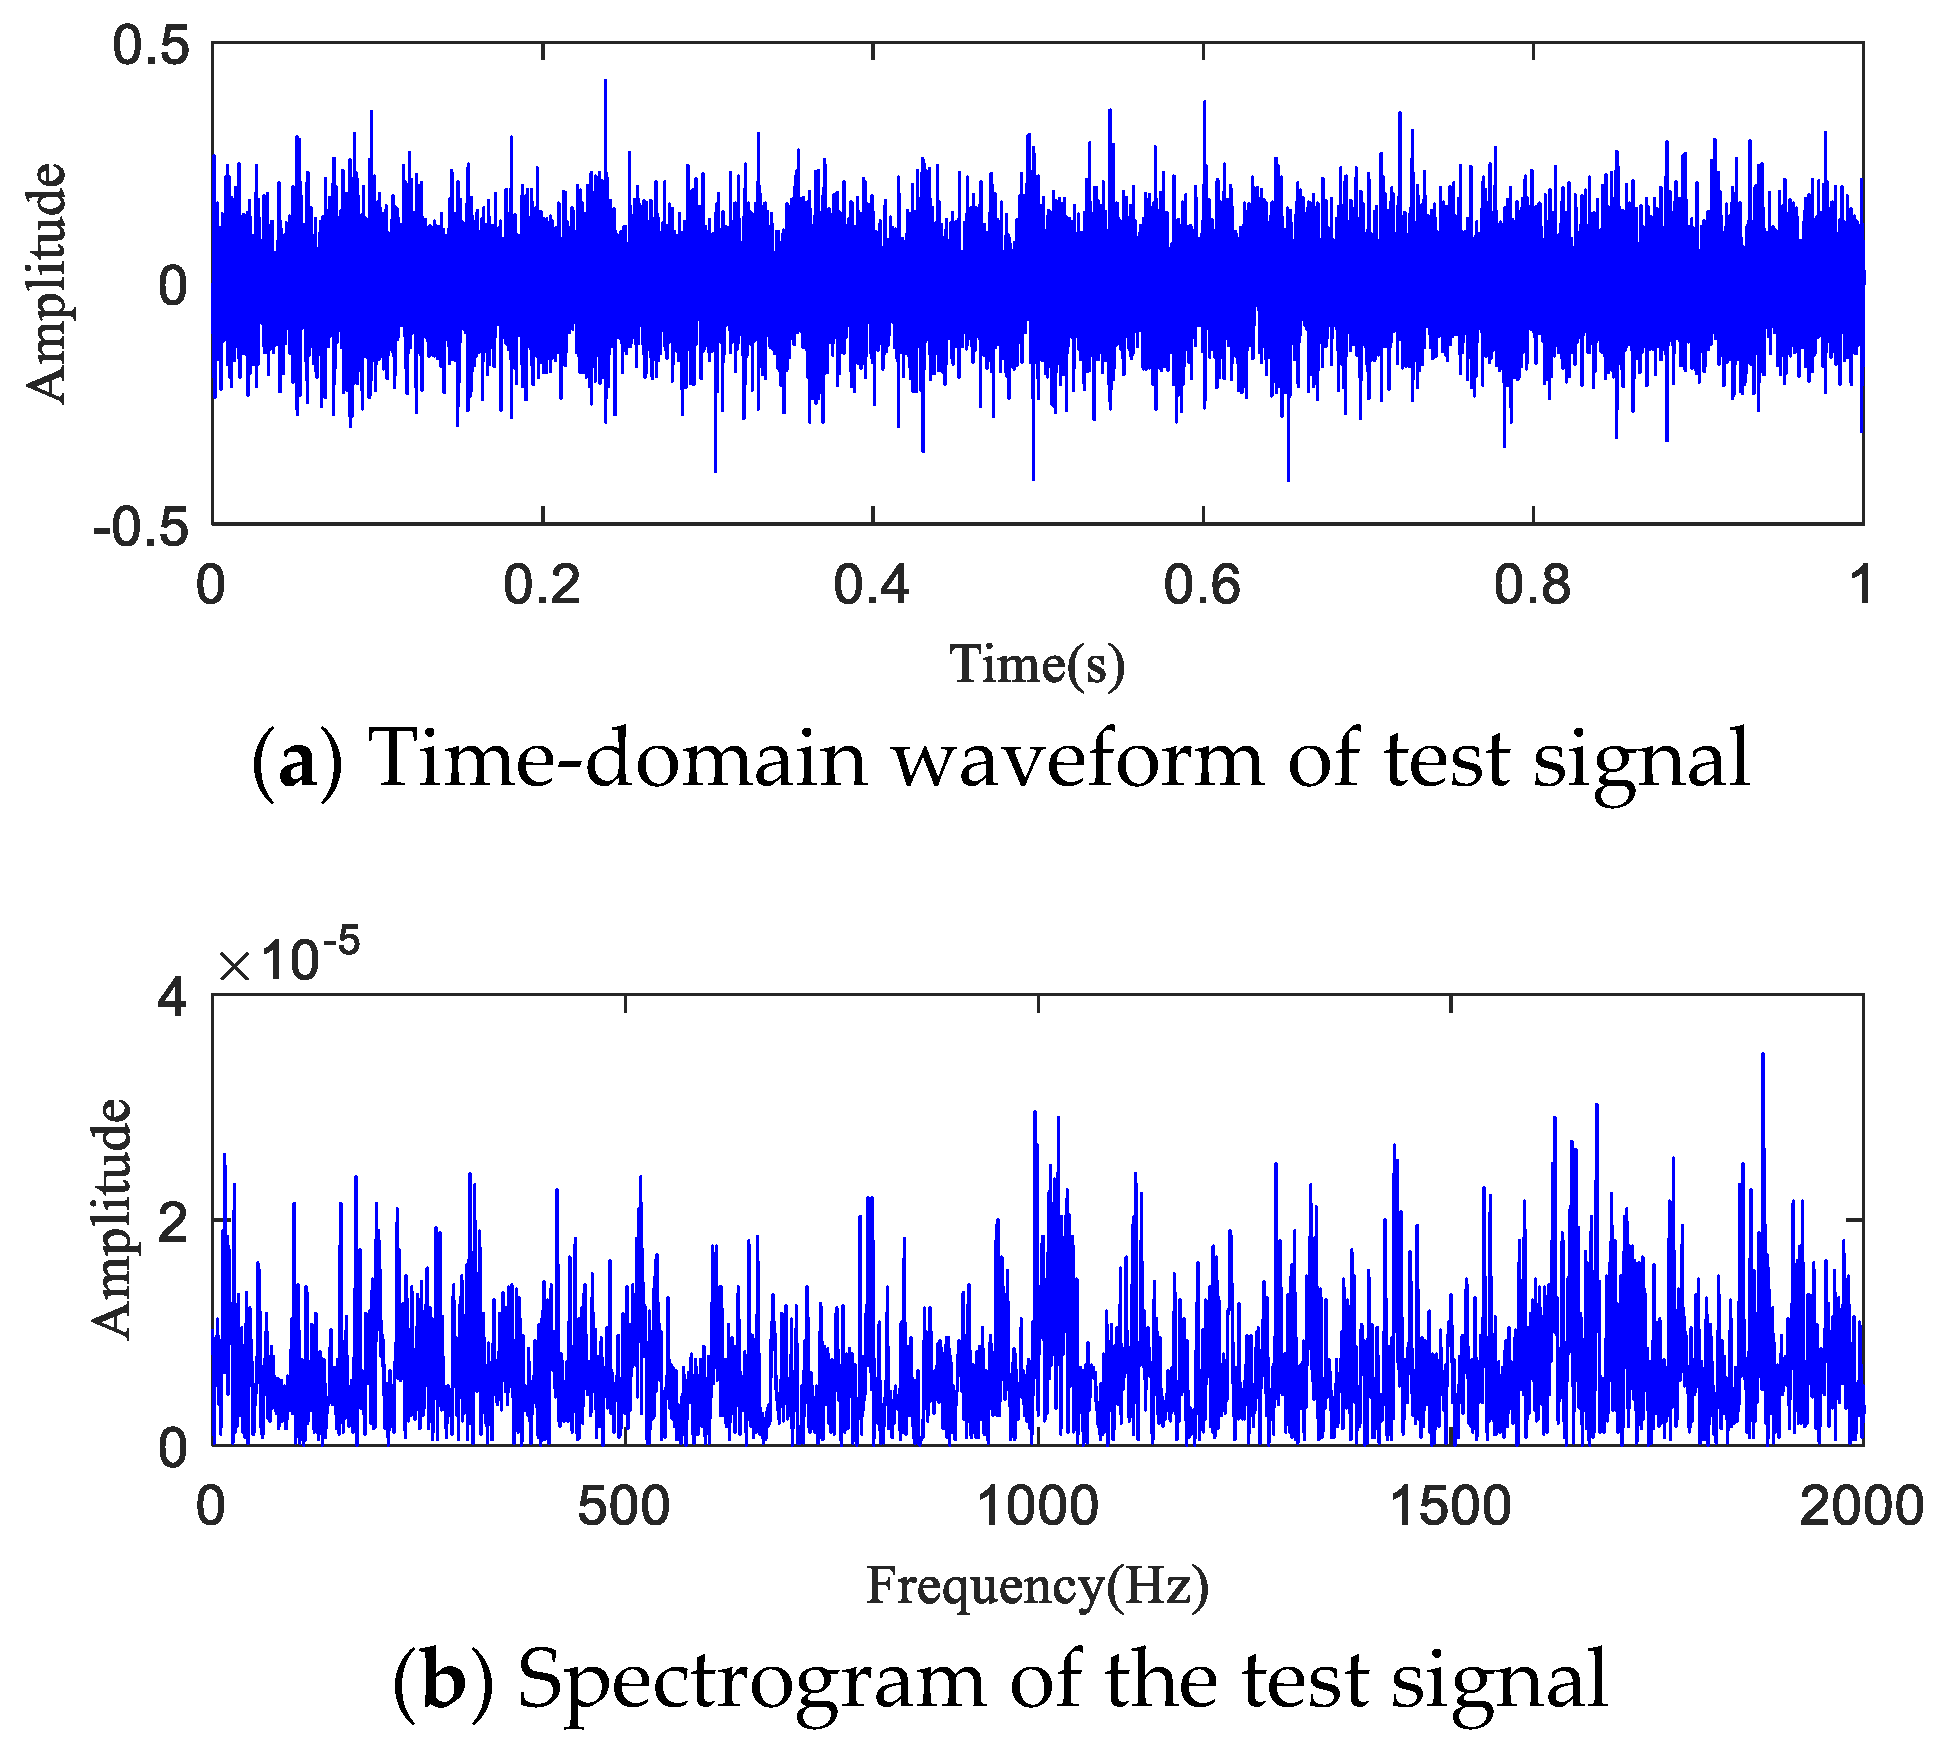
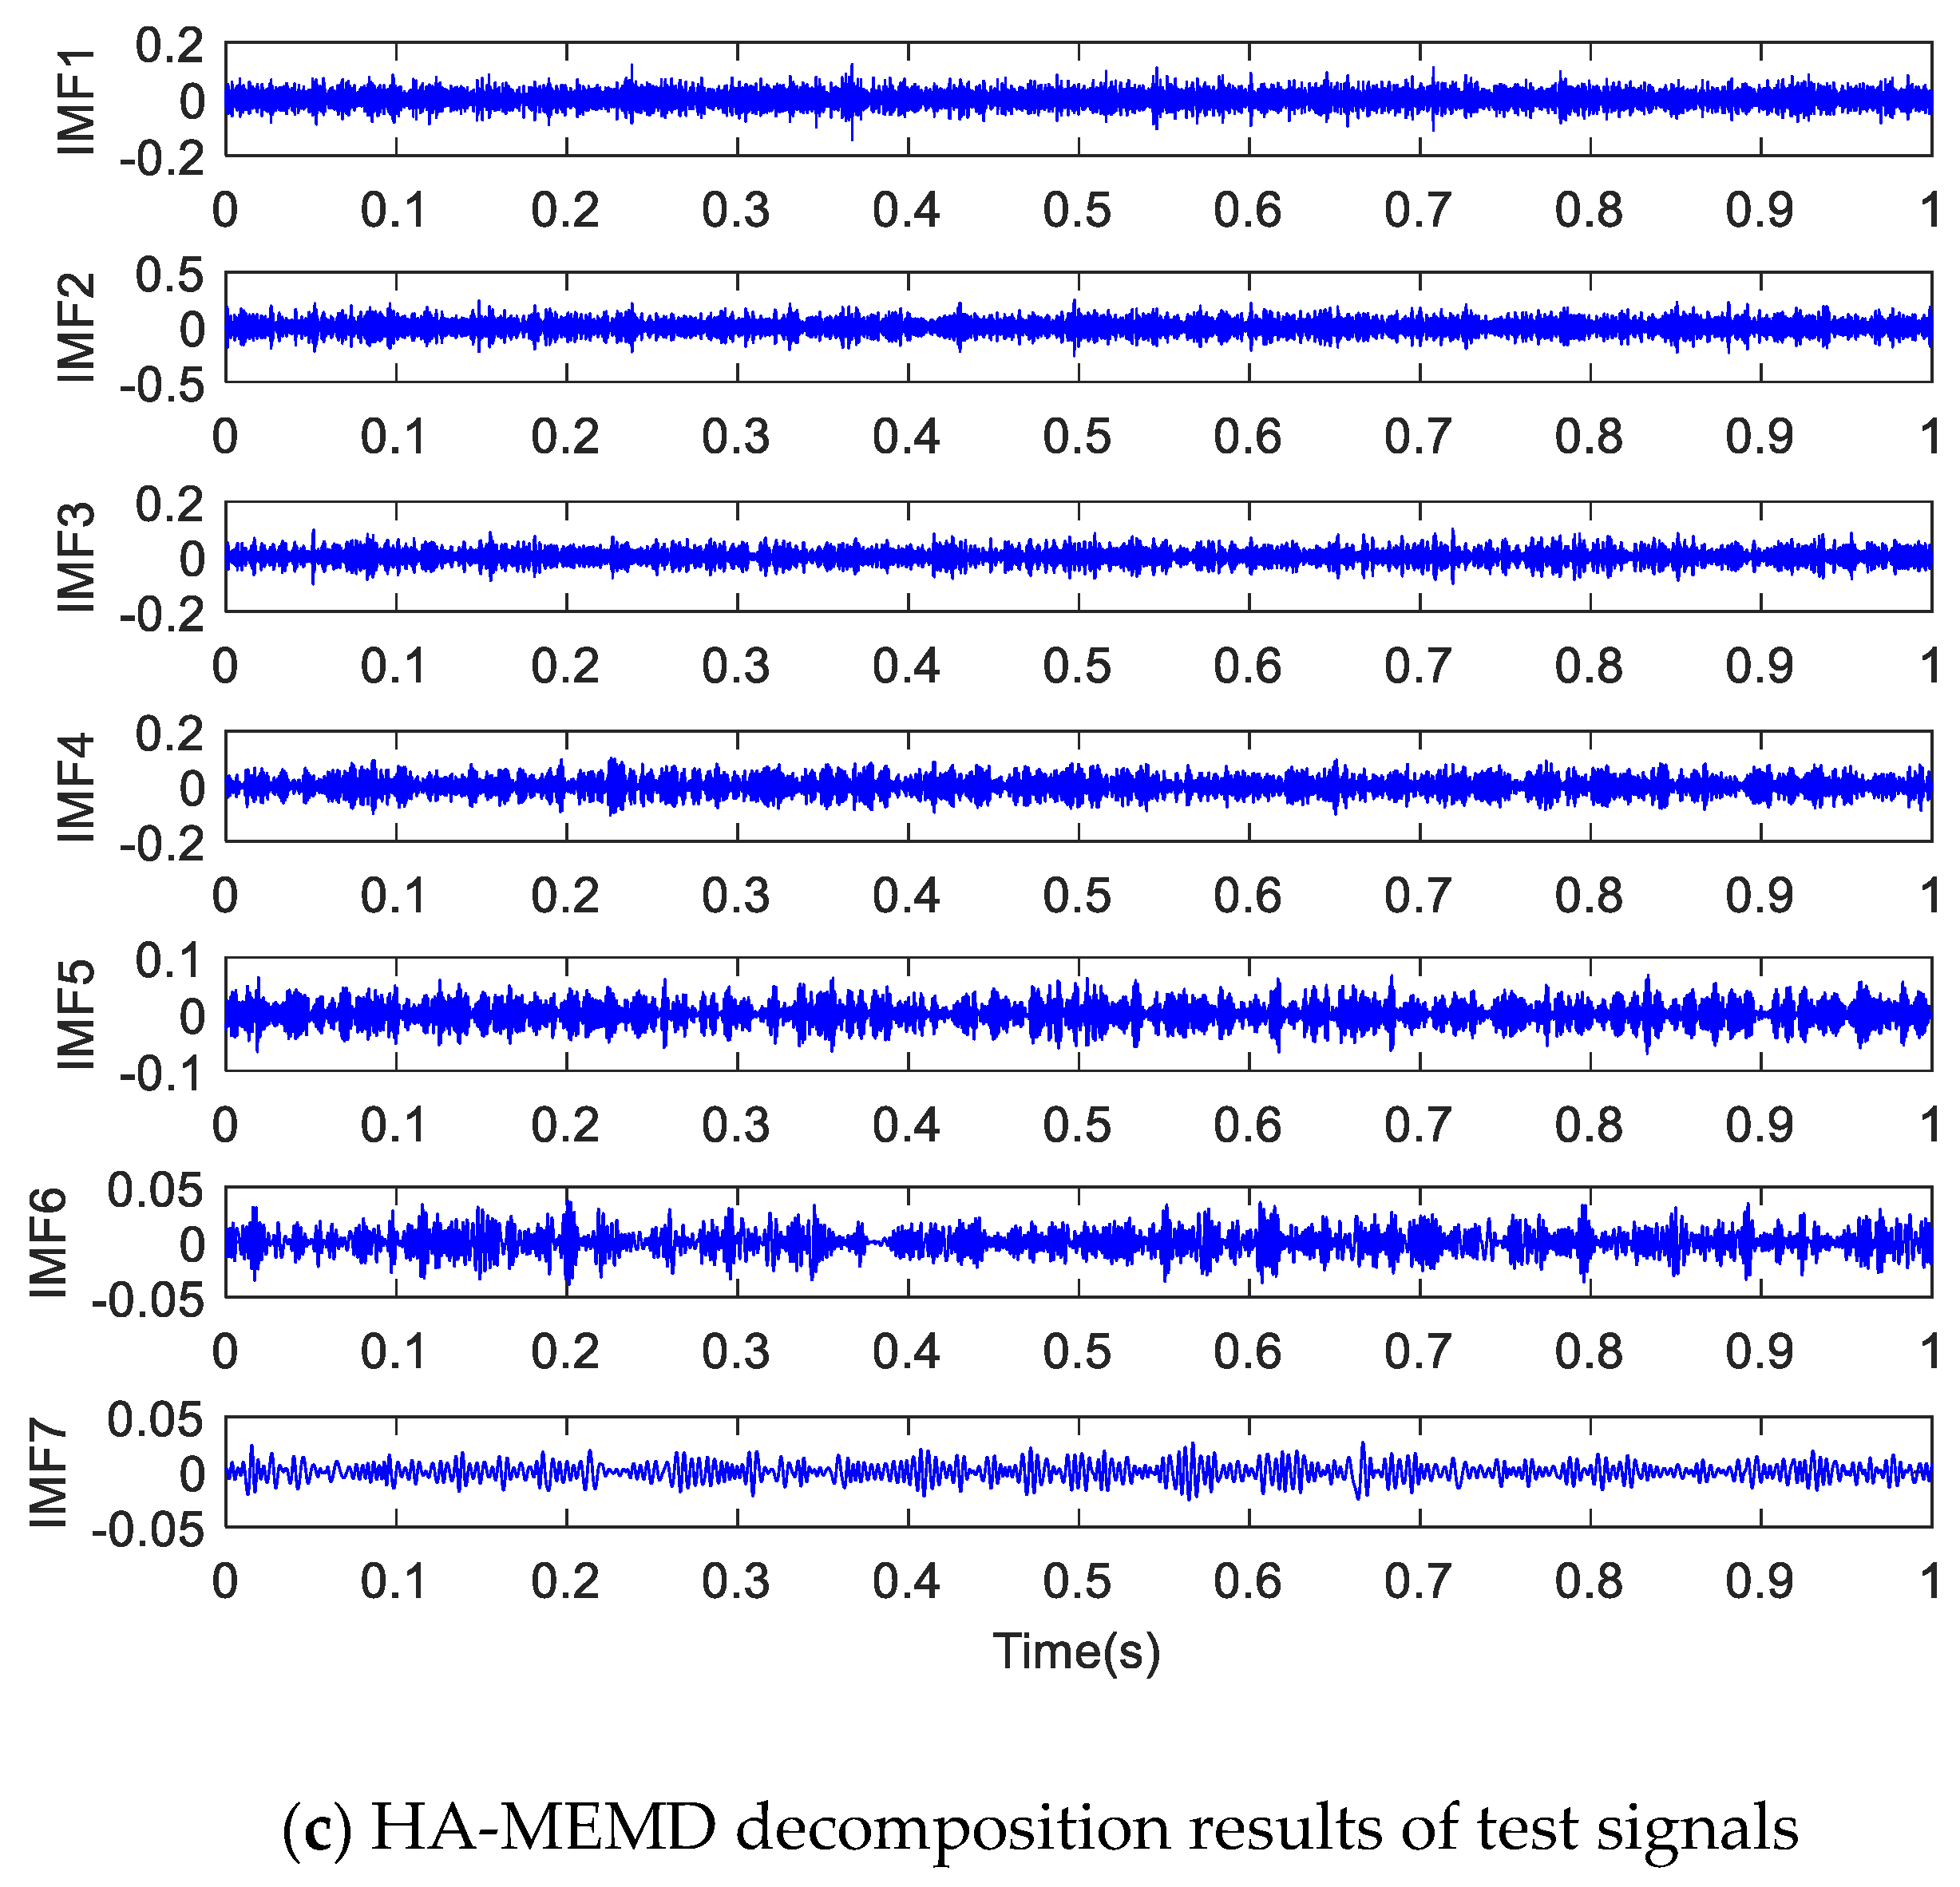
5.1. Intermittent Signal
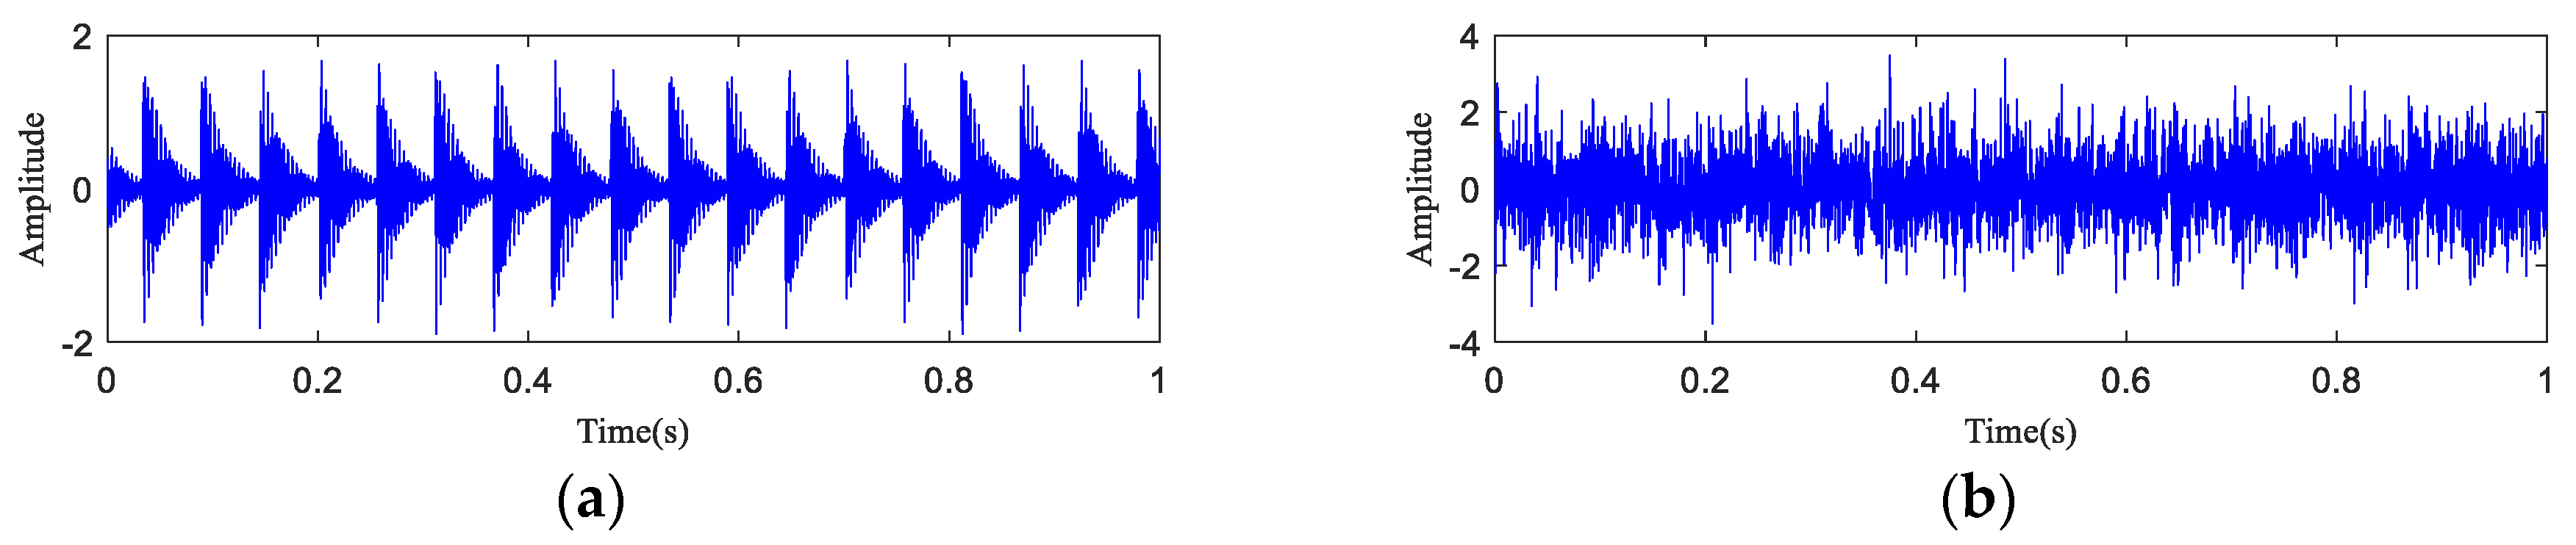
5.2. Rotating Machinery Early Fault Analog Signal
6. Experimental Research
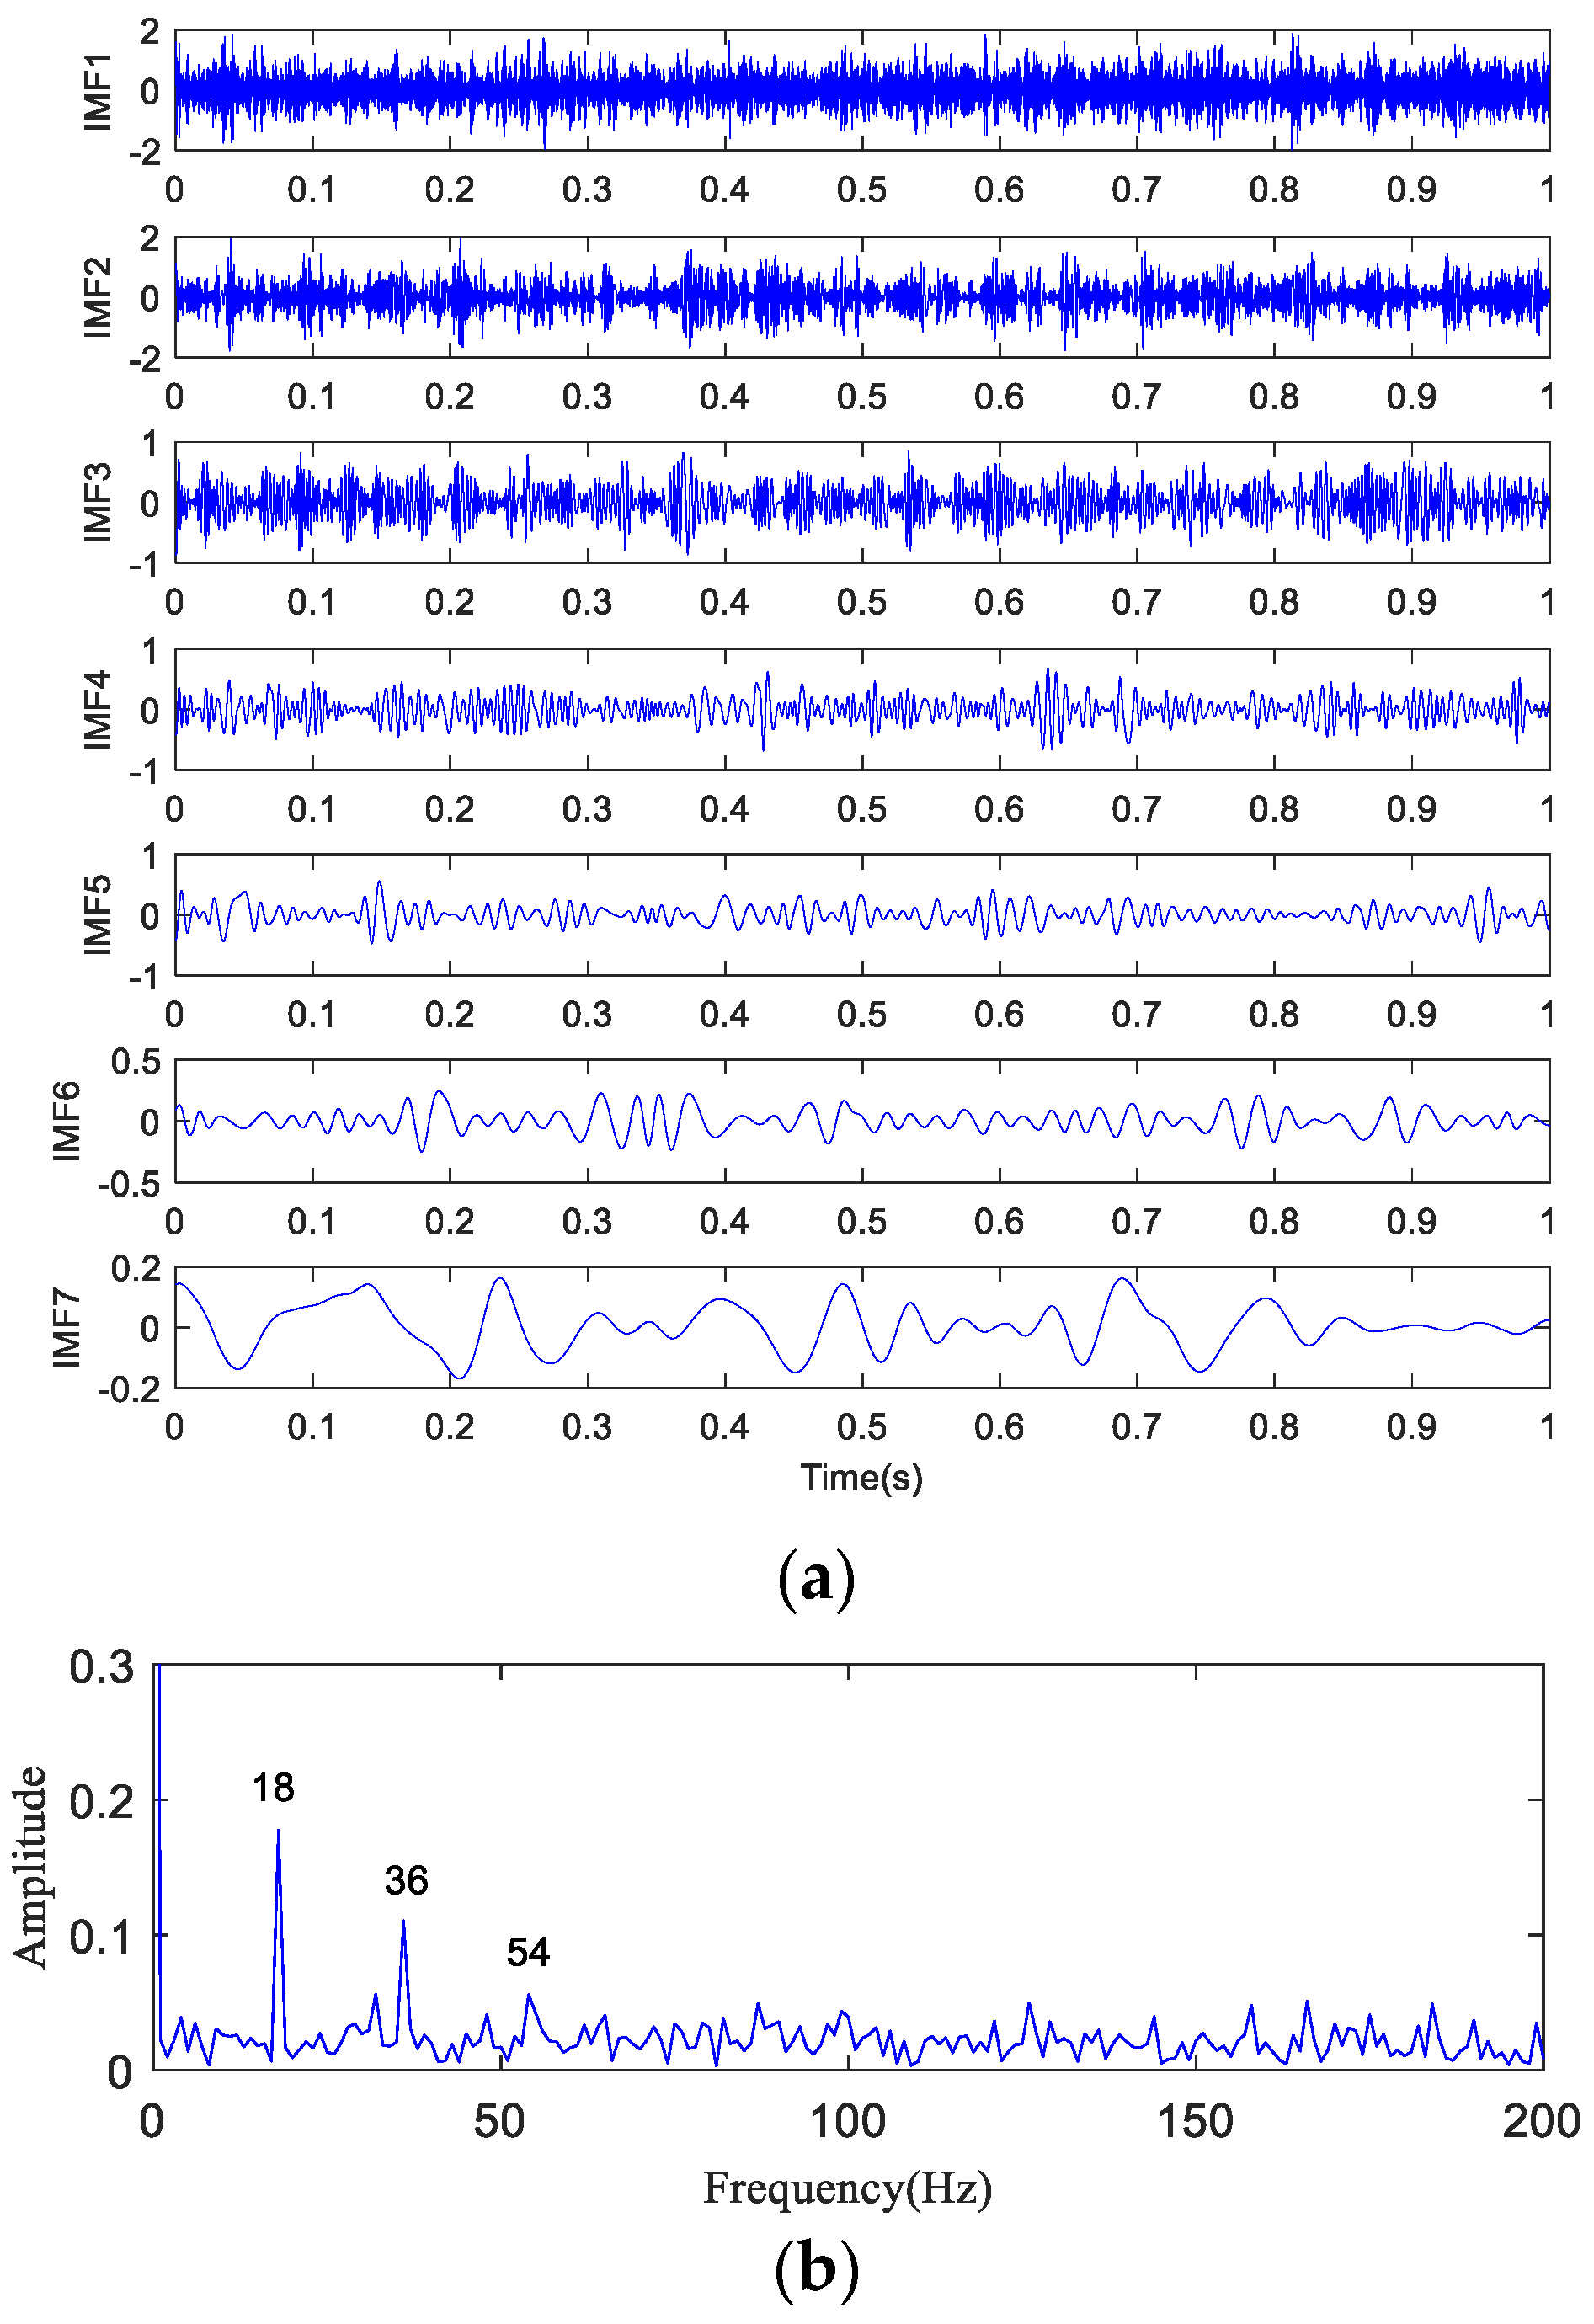
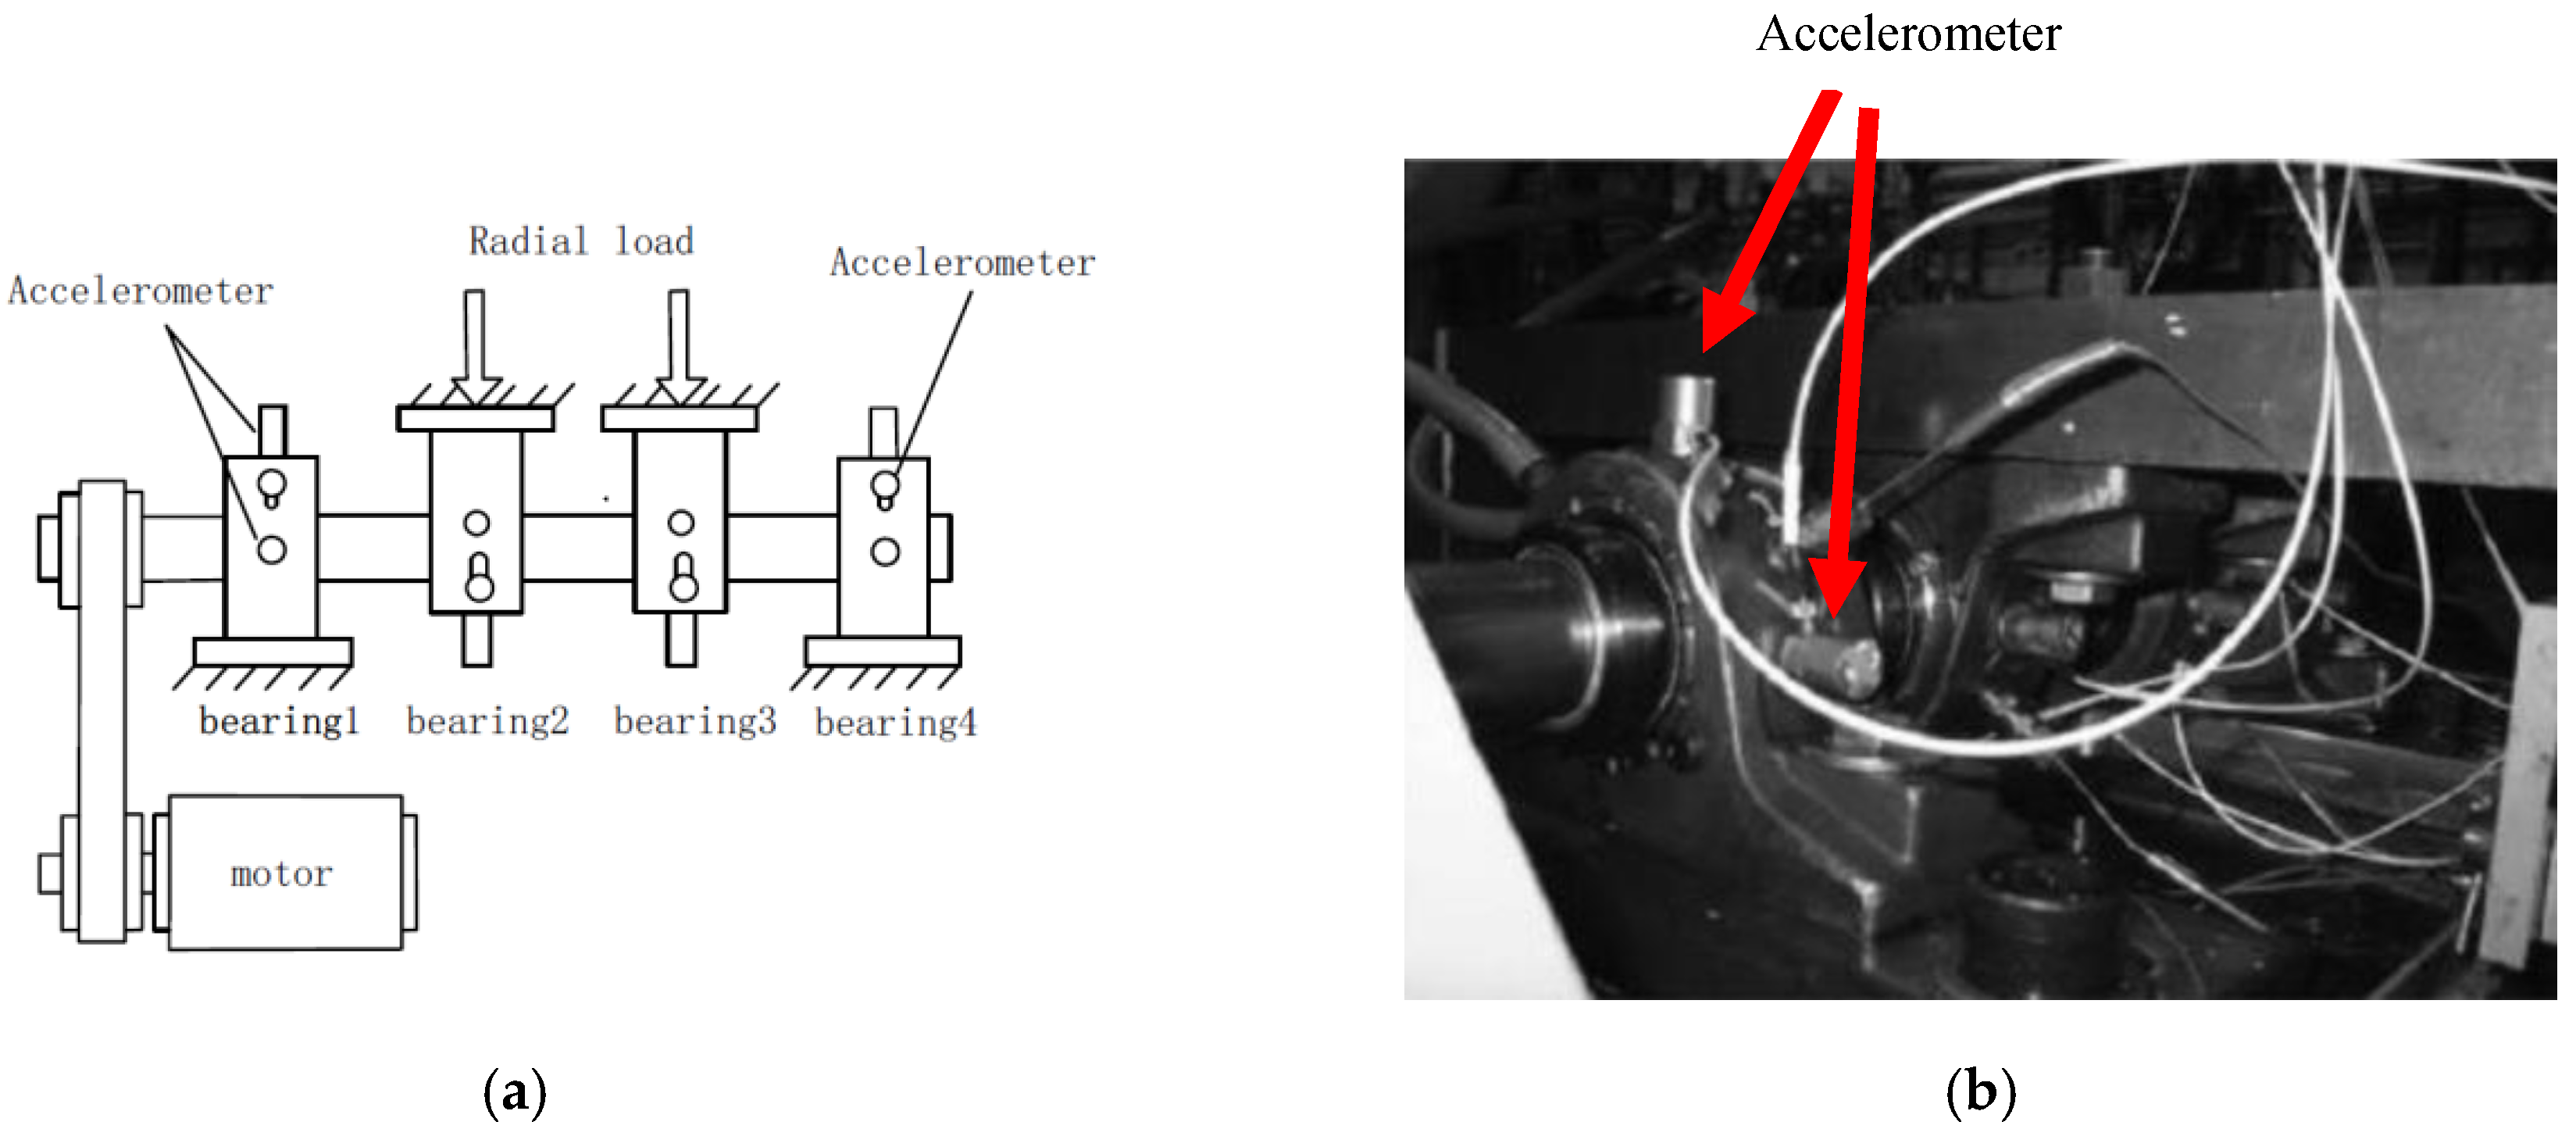
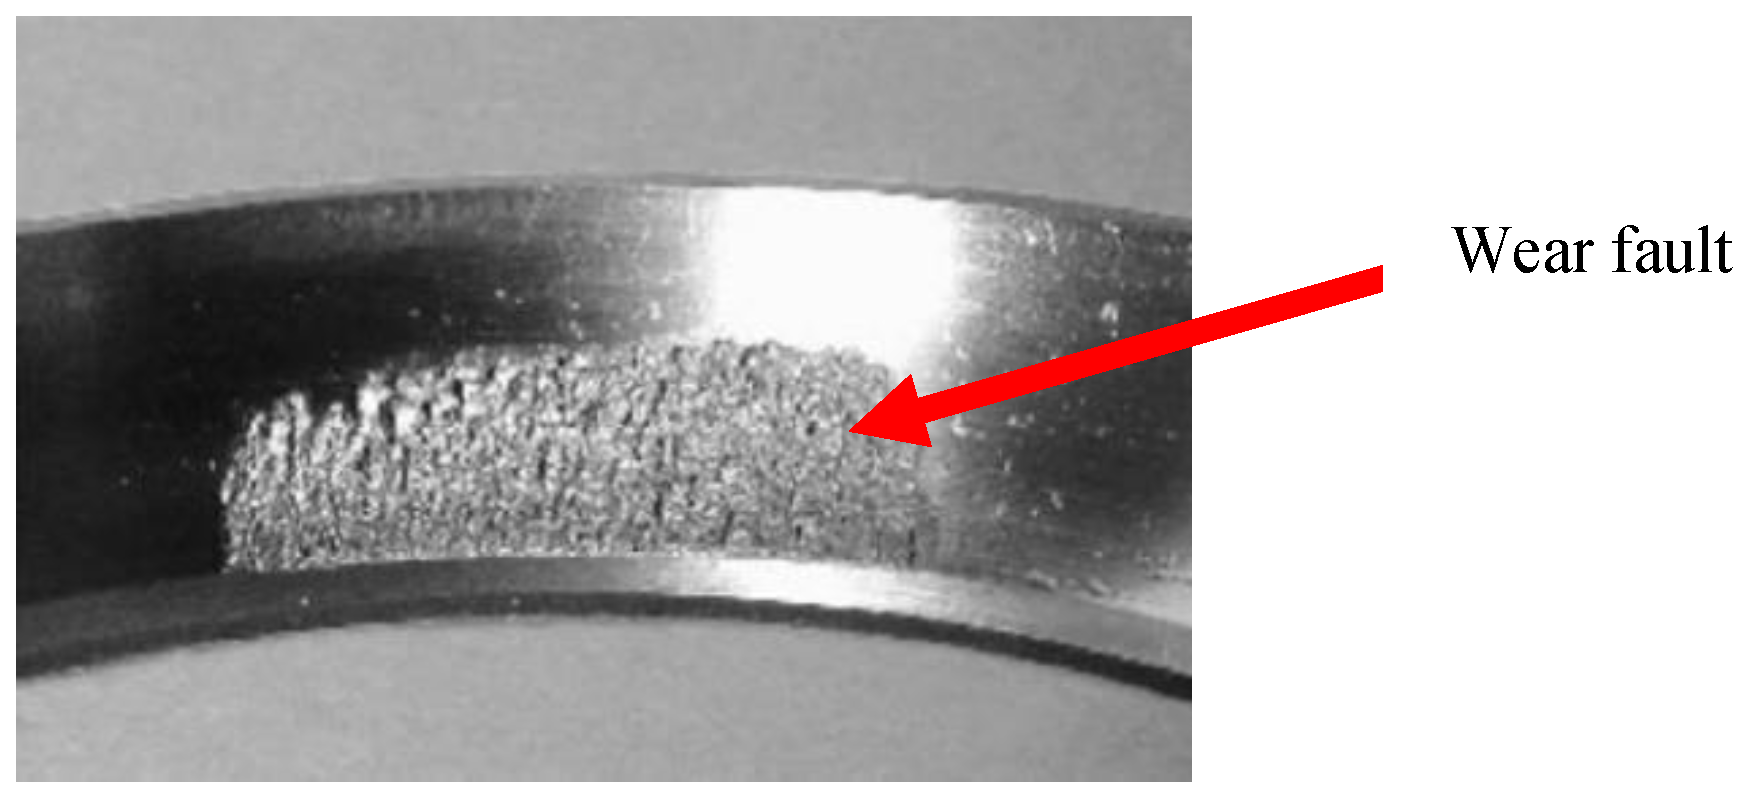
6.1. Test Introduction
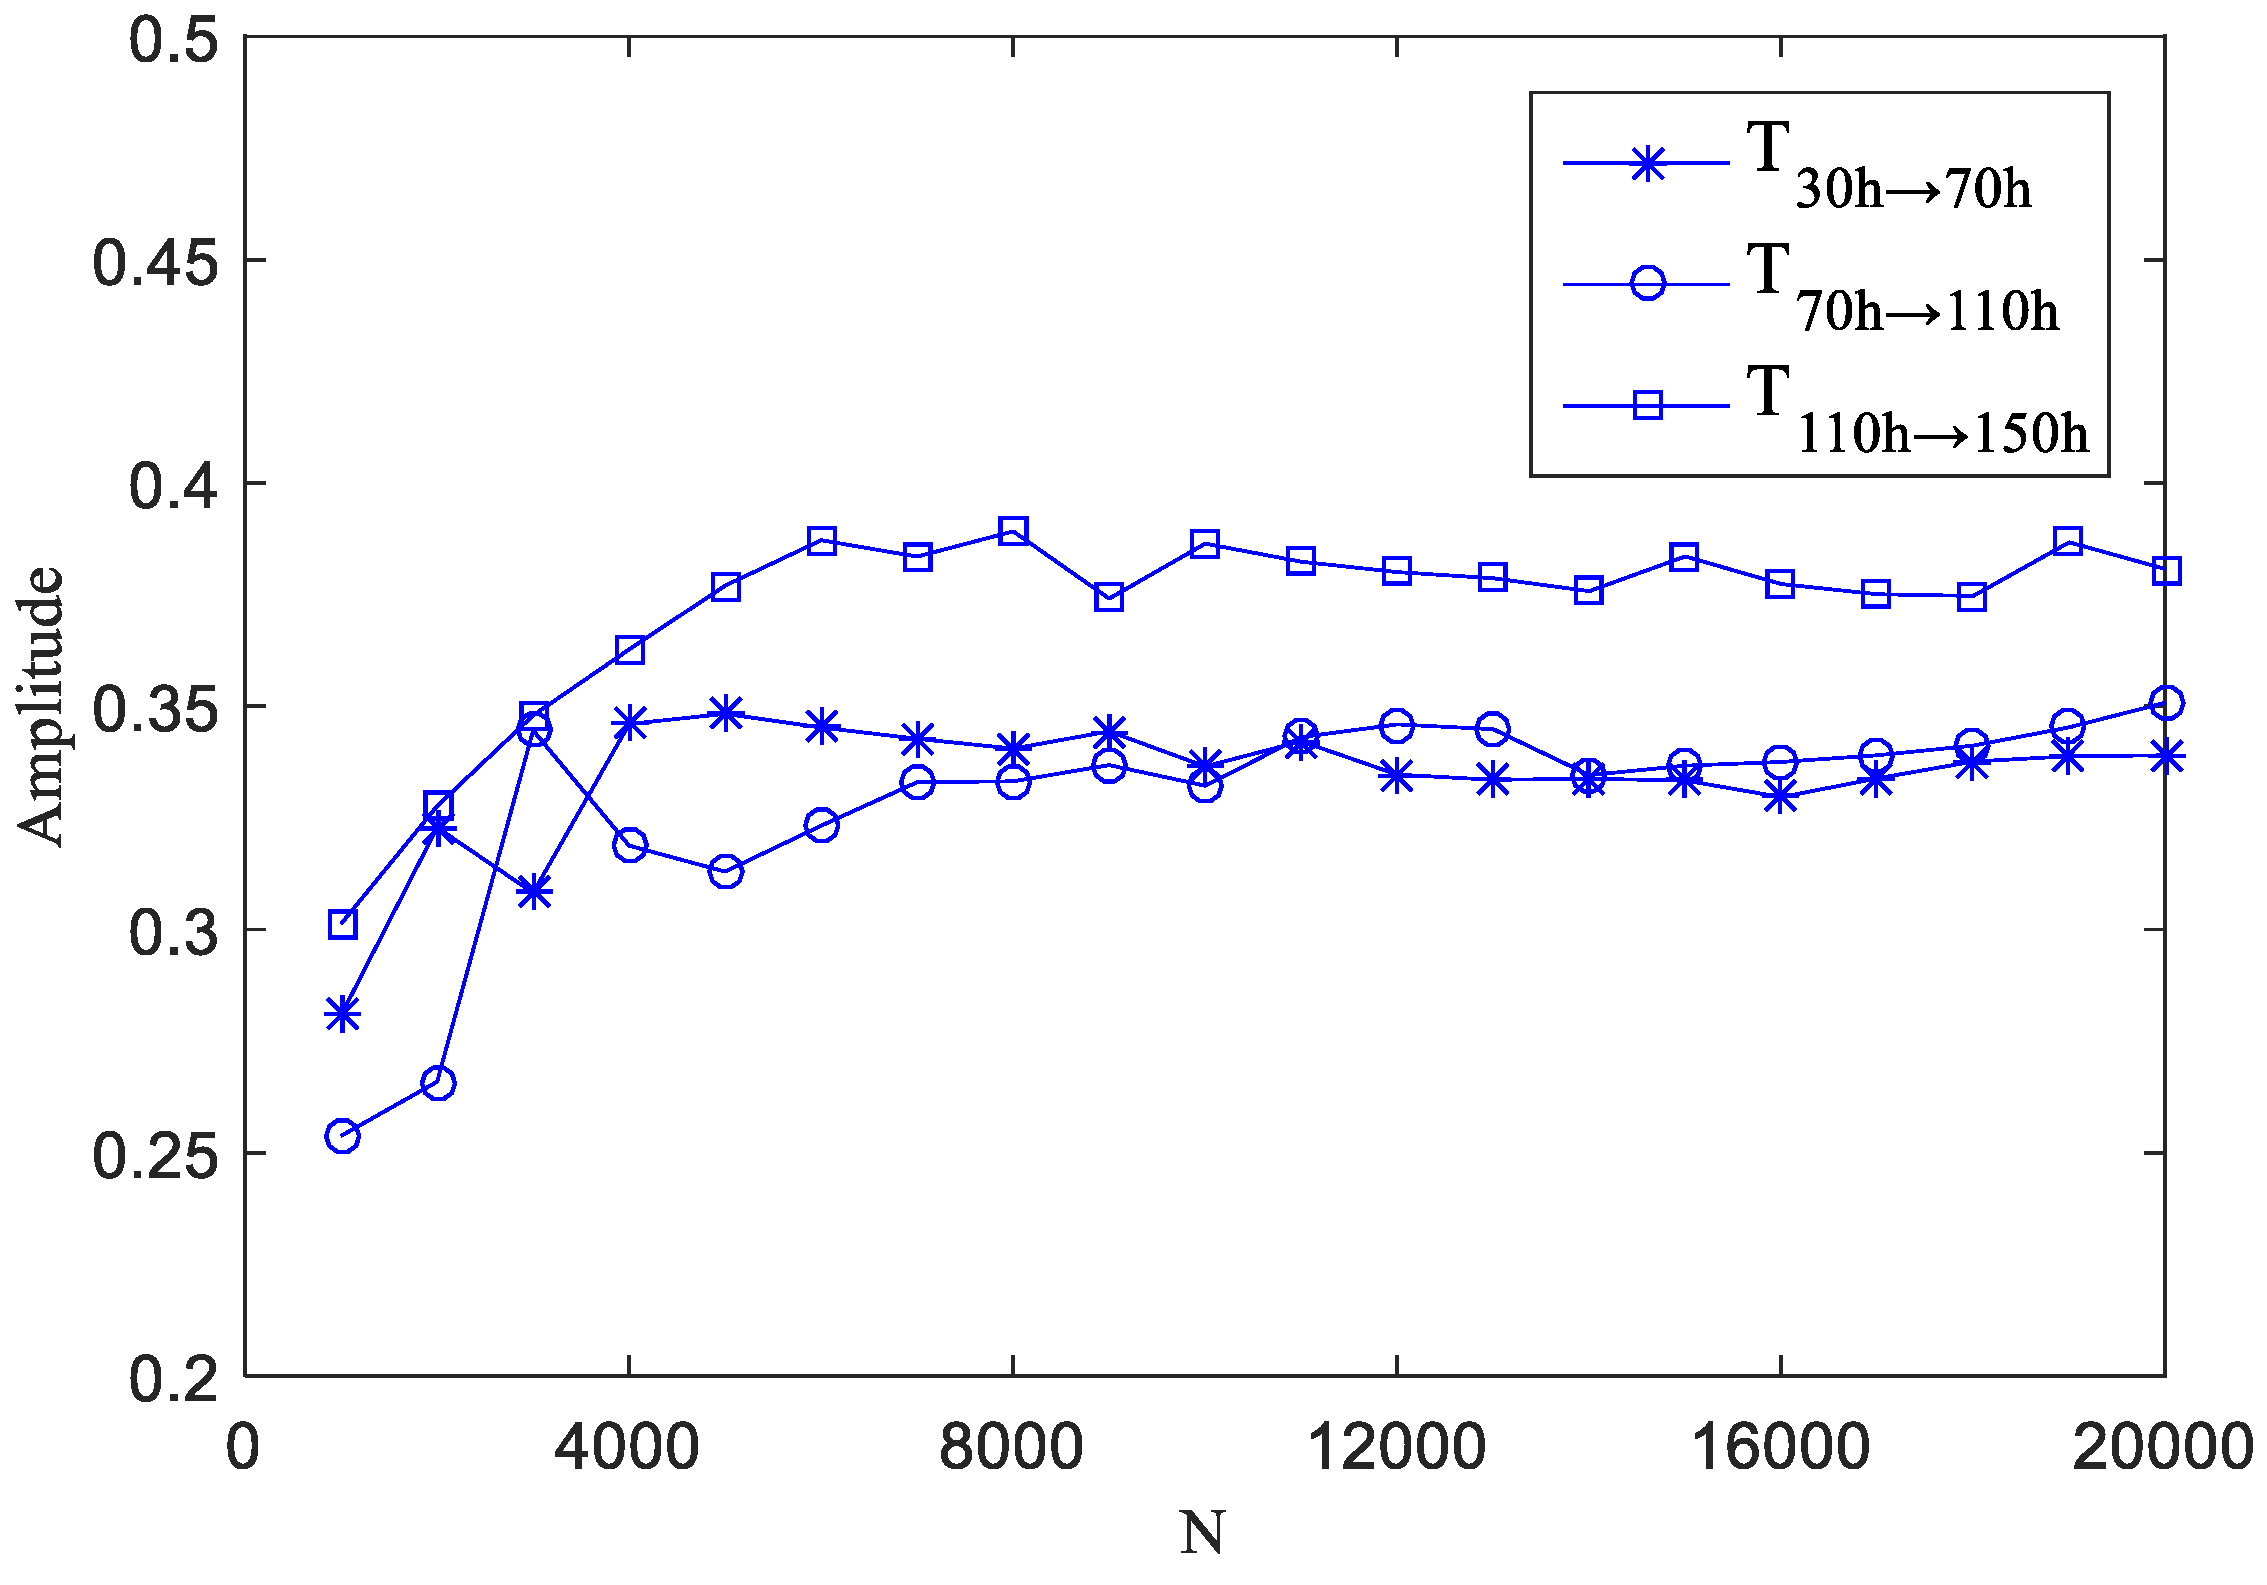
6.2. The Effect of Time Series Length on the Calculation of Transfer Entropy
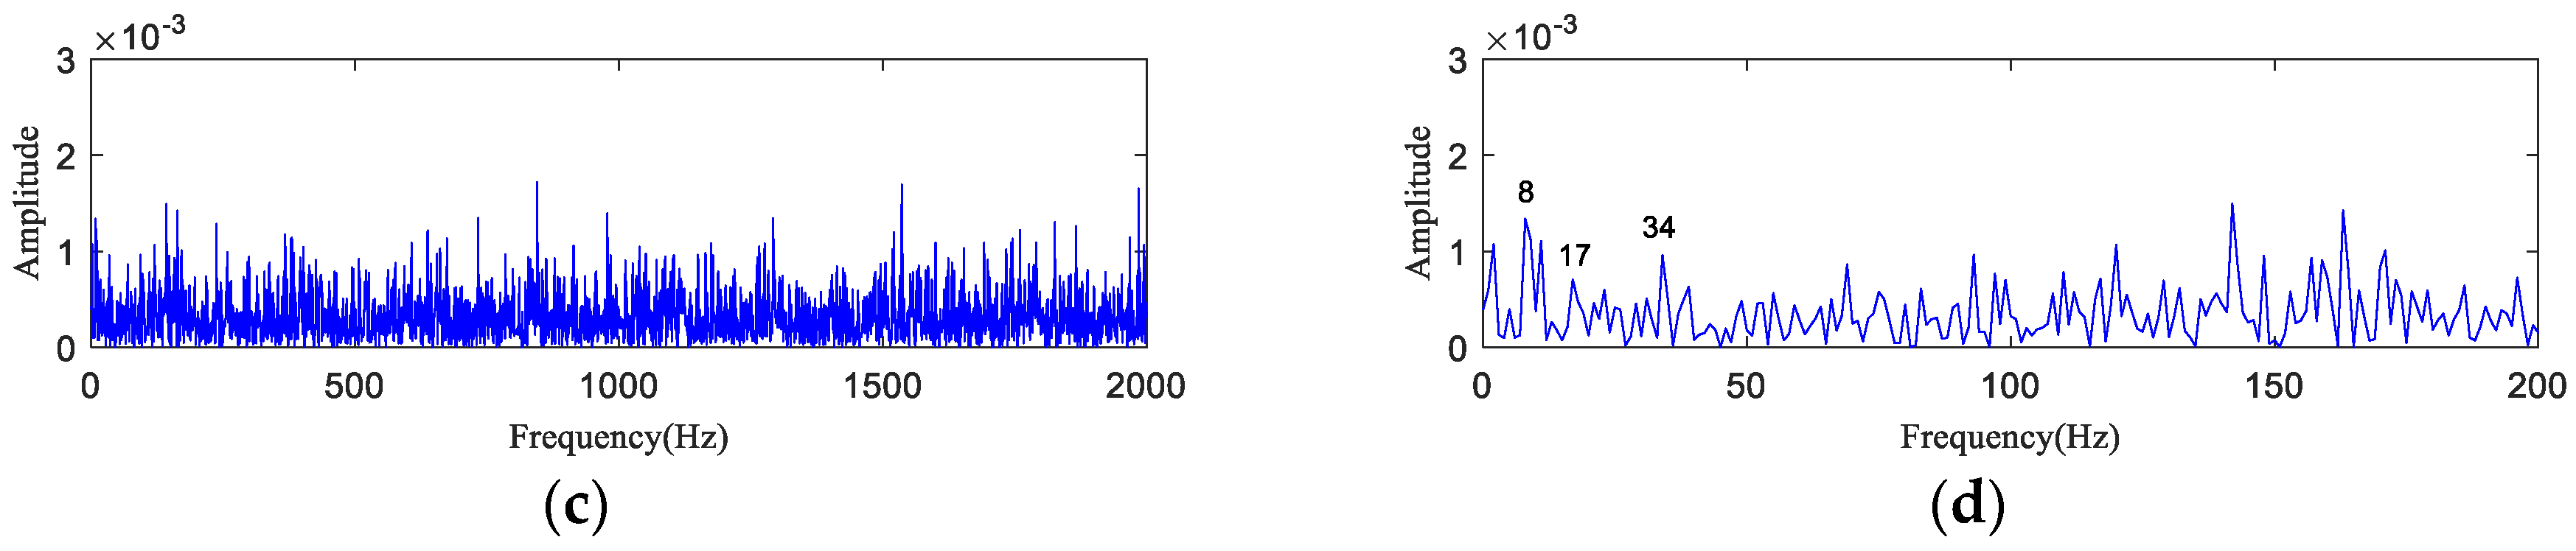
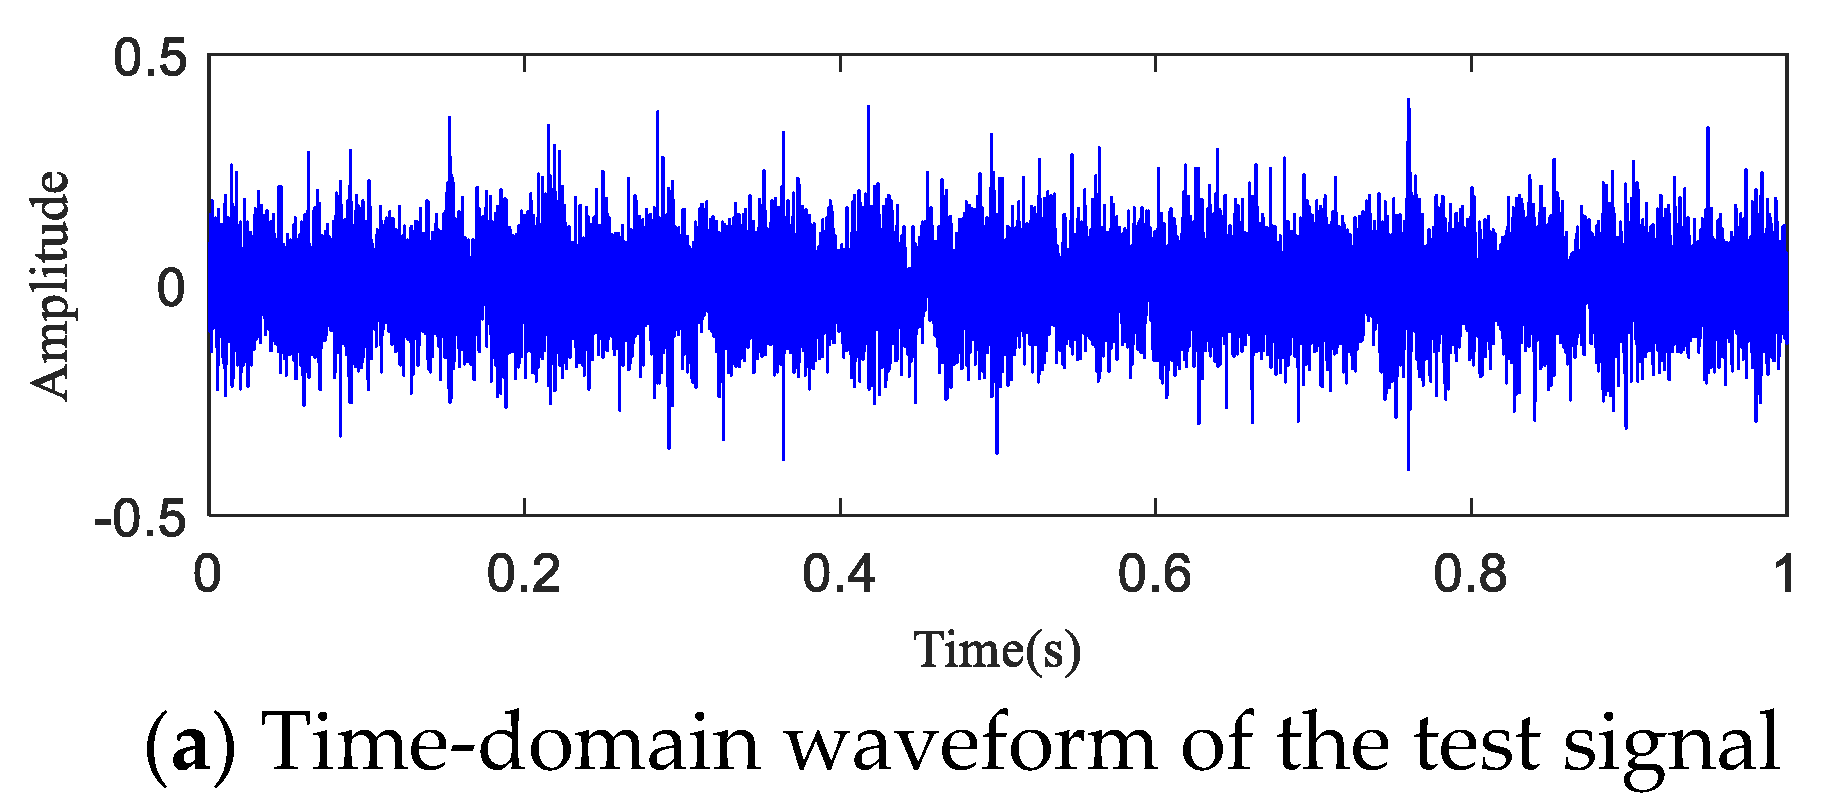
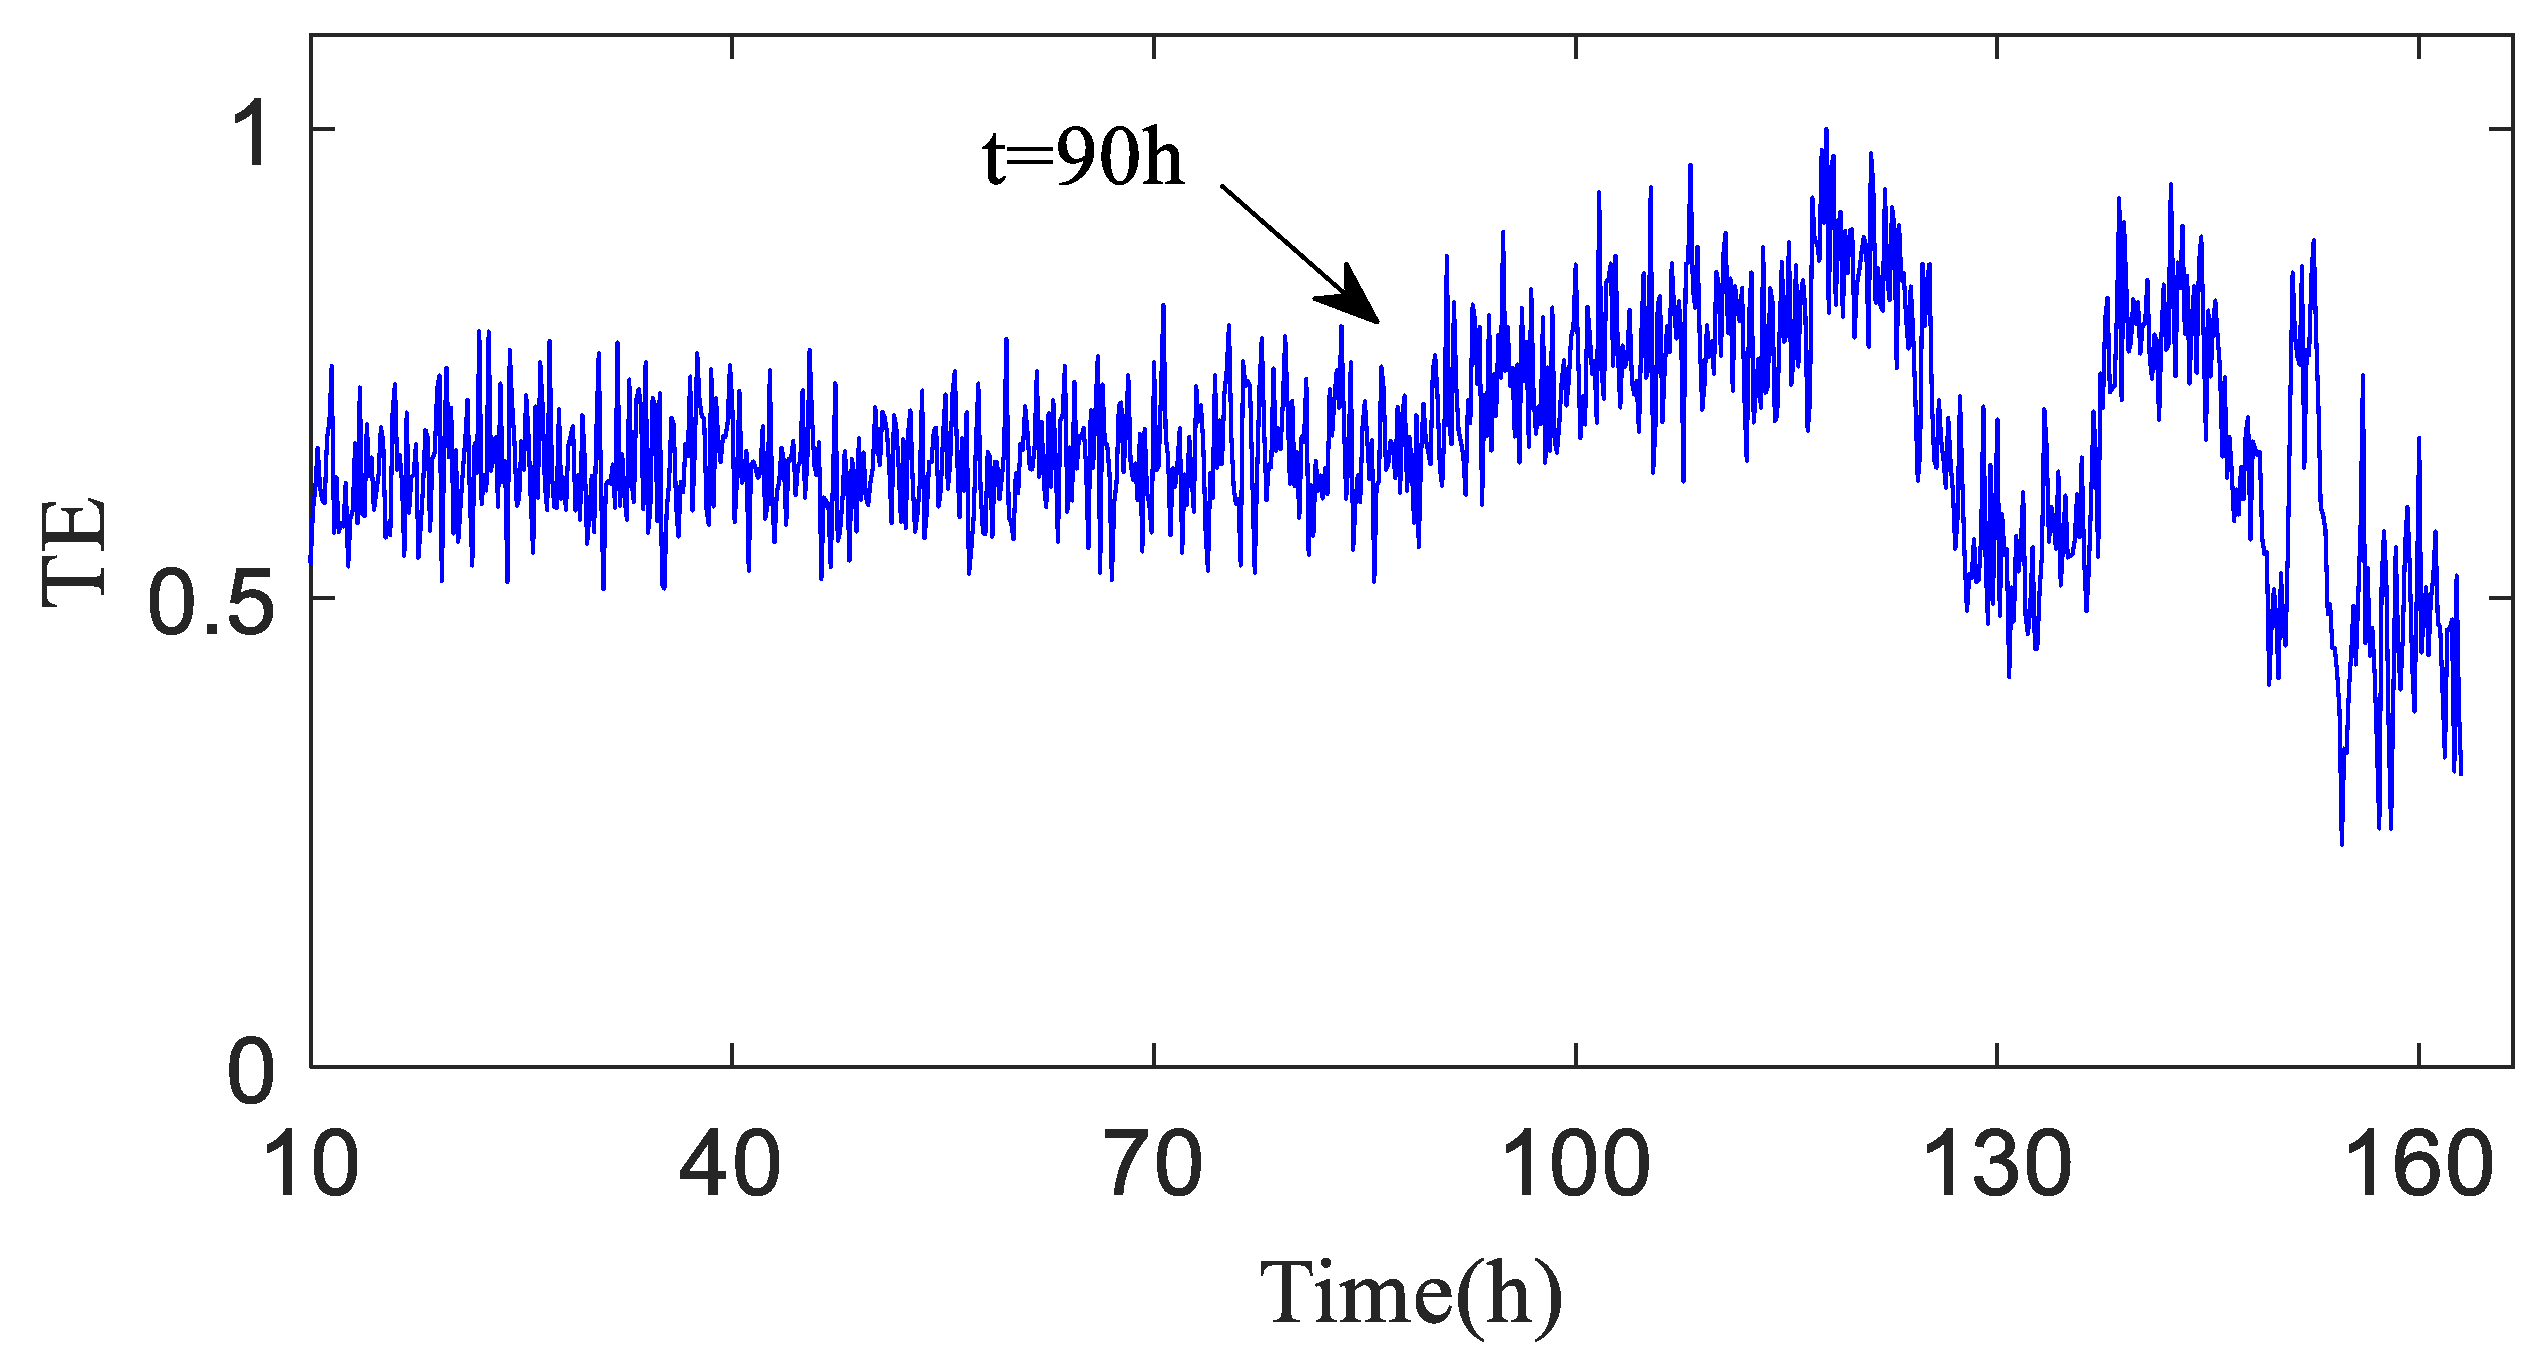
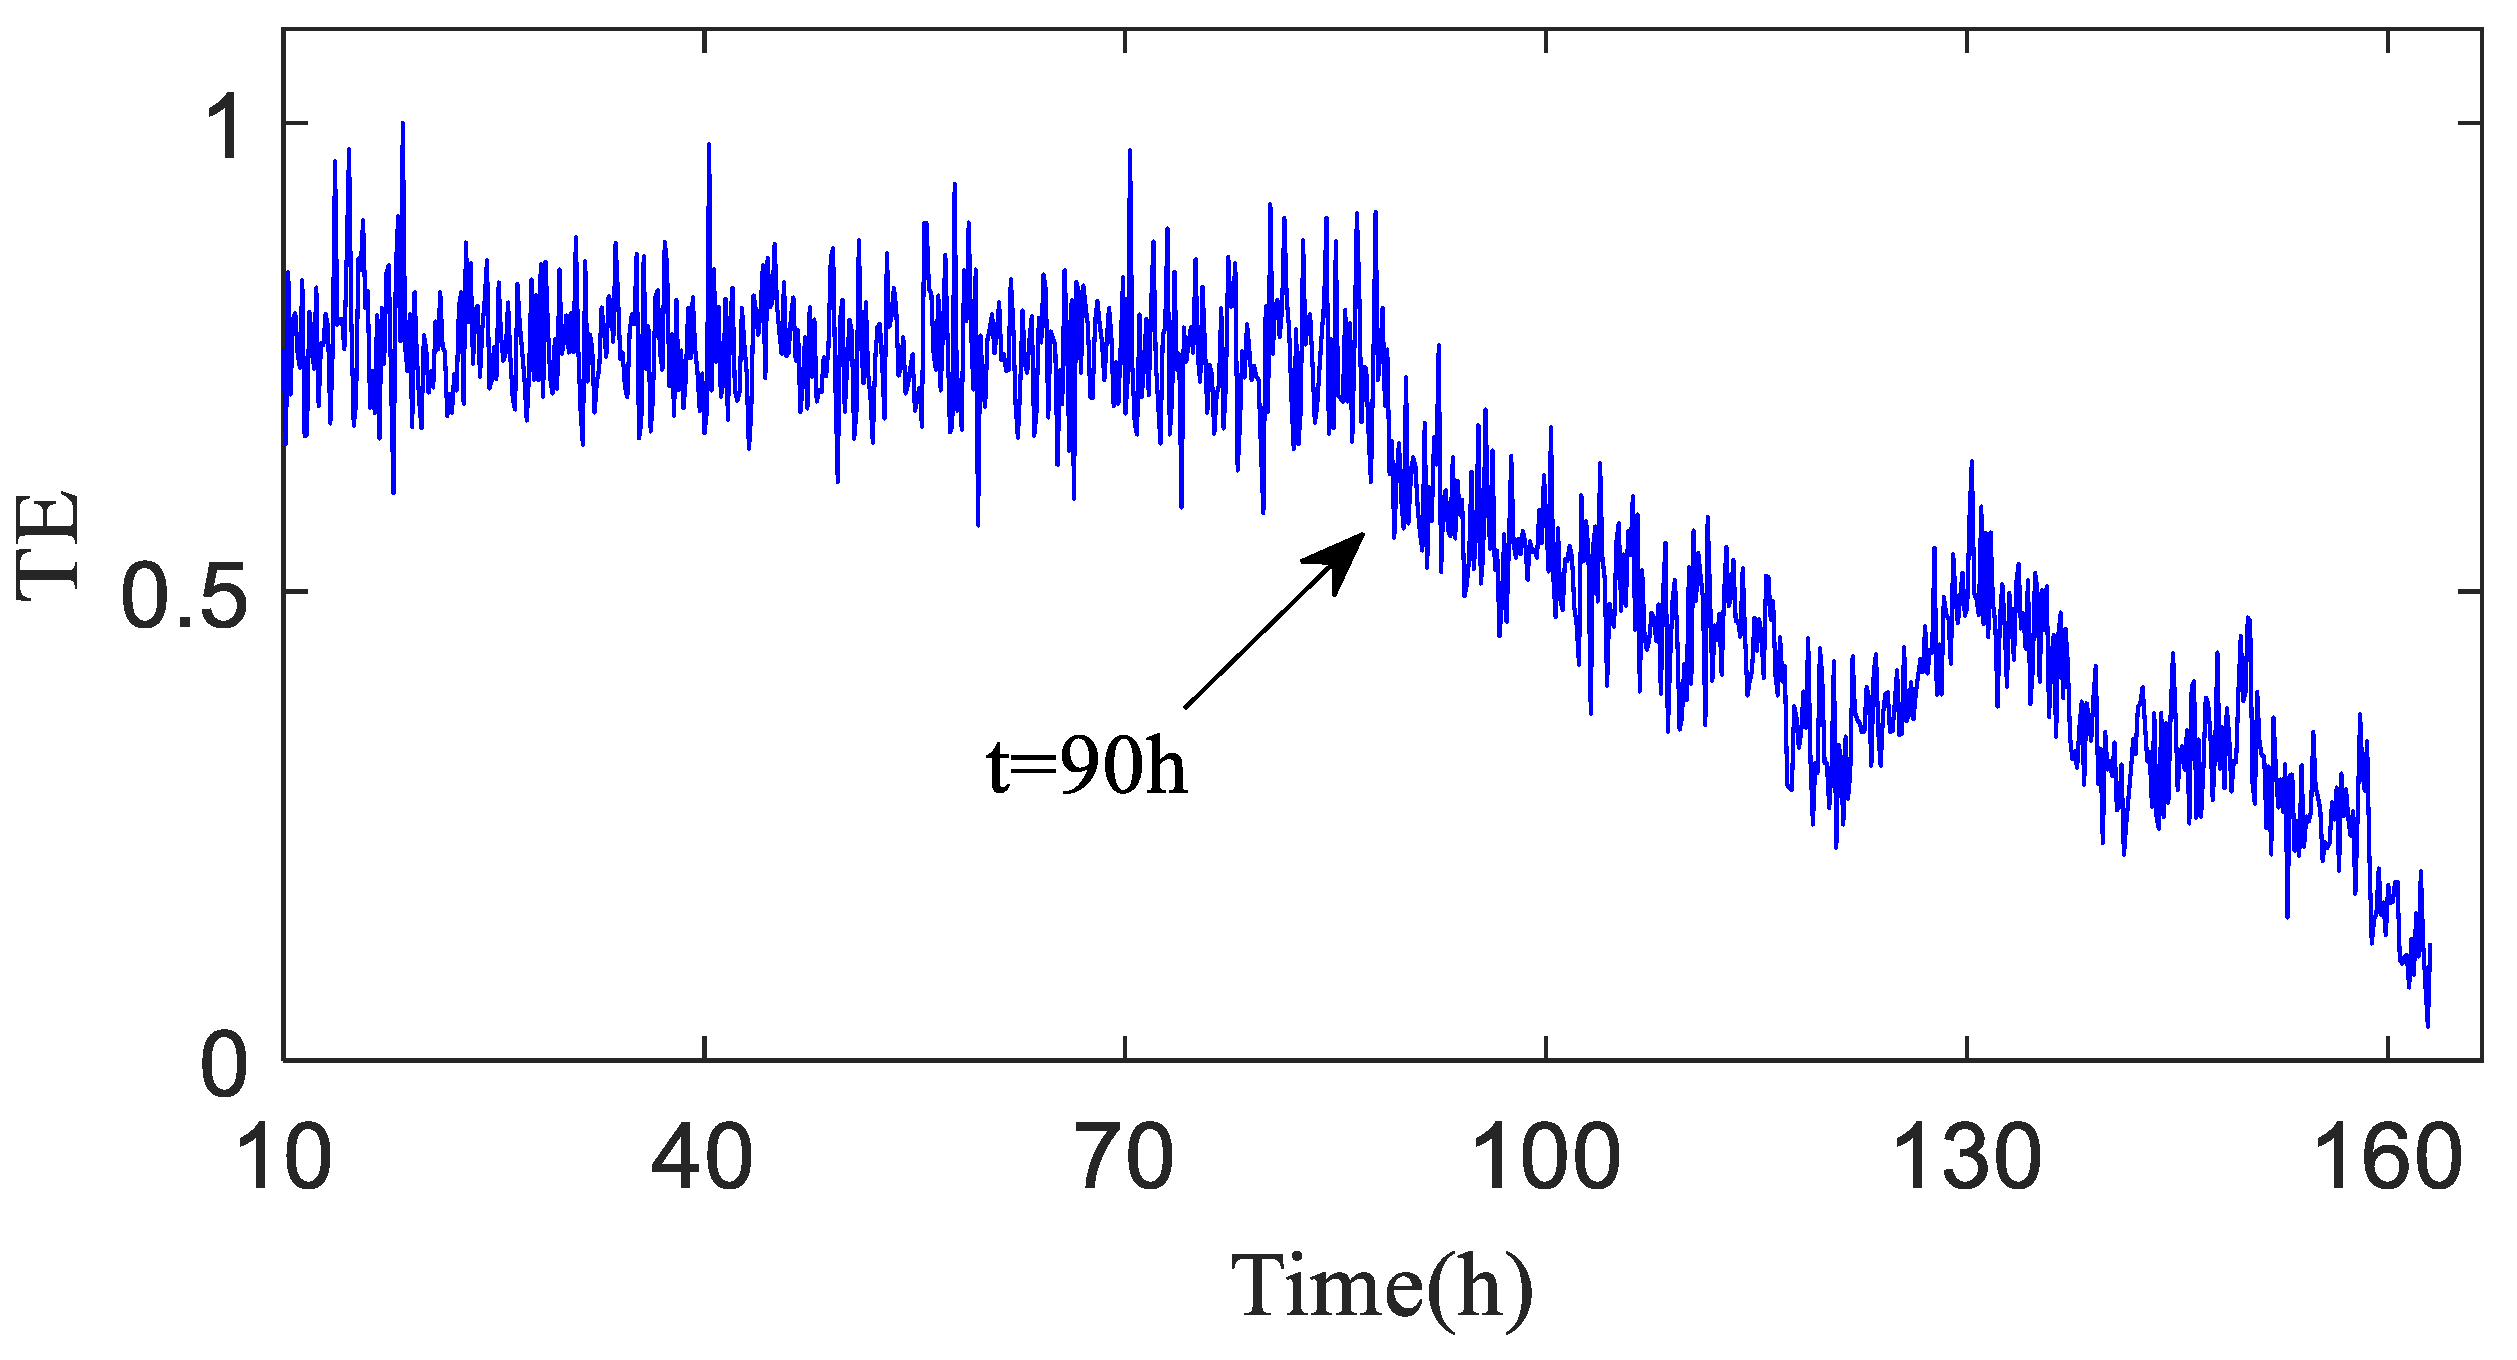
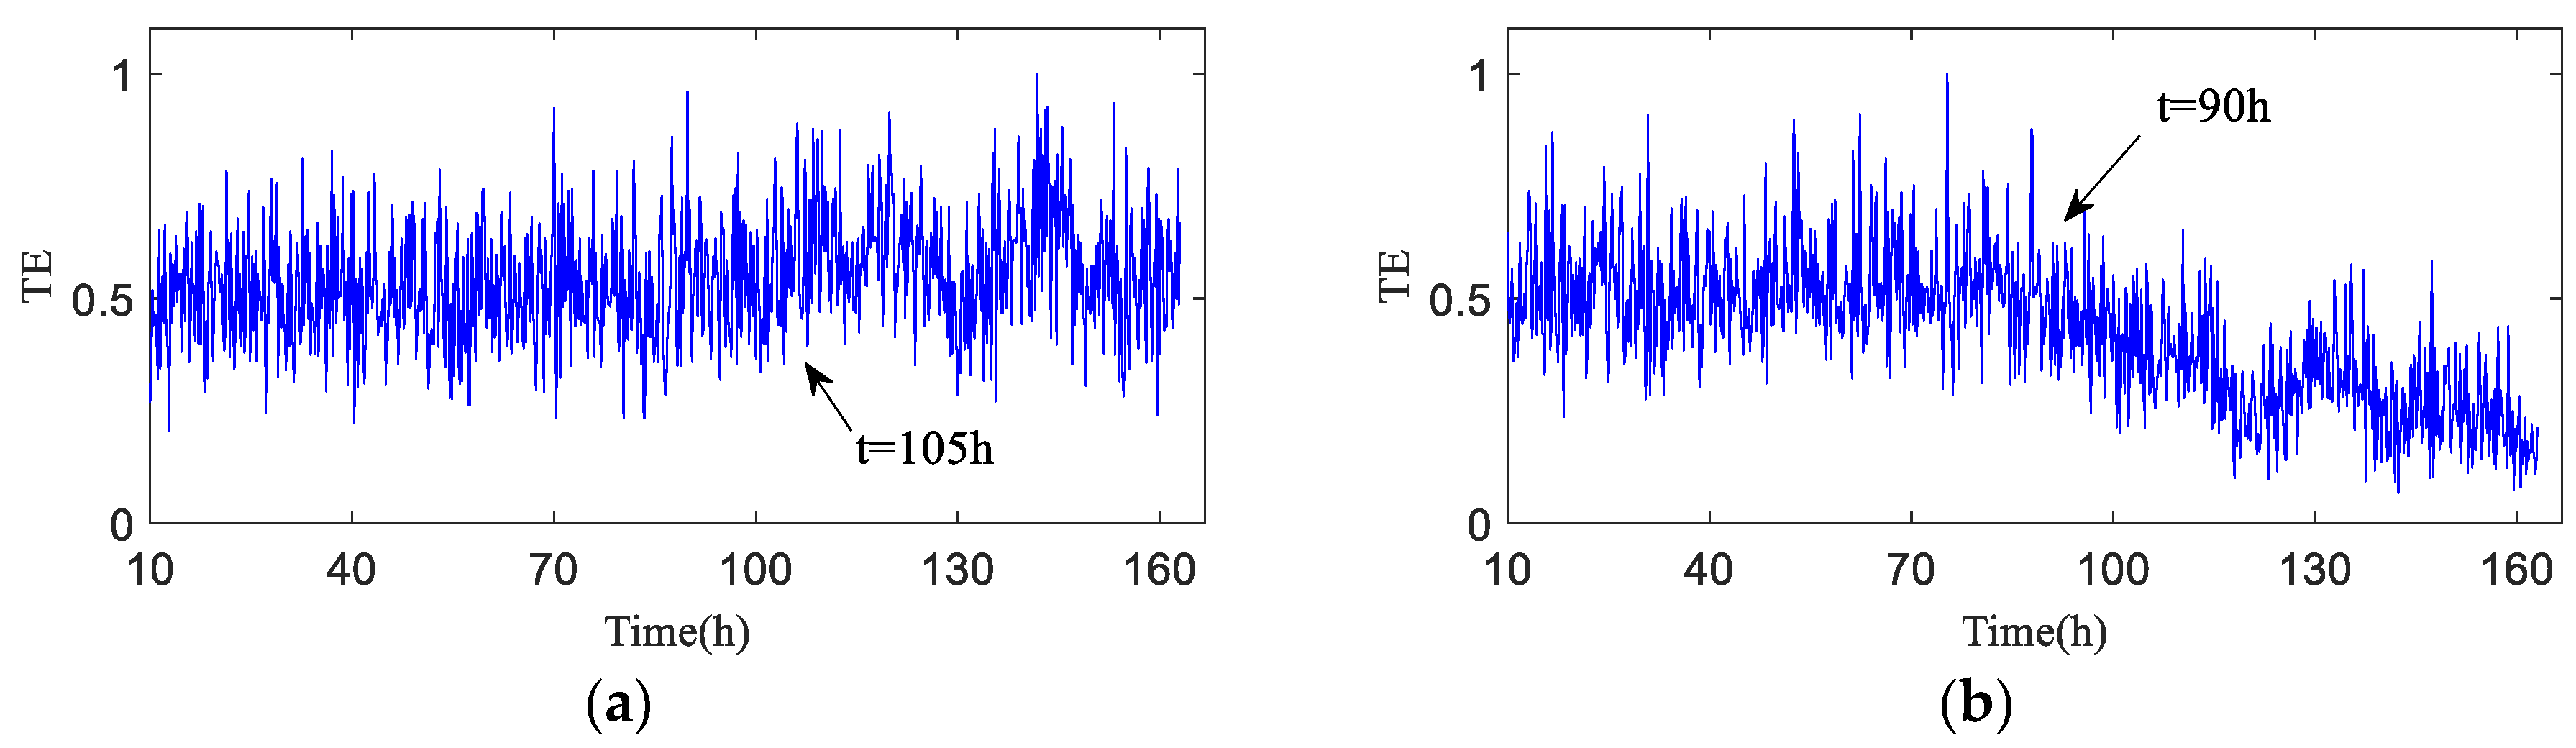
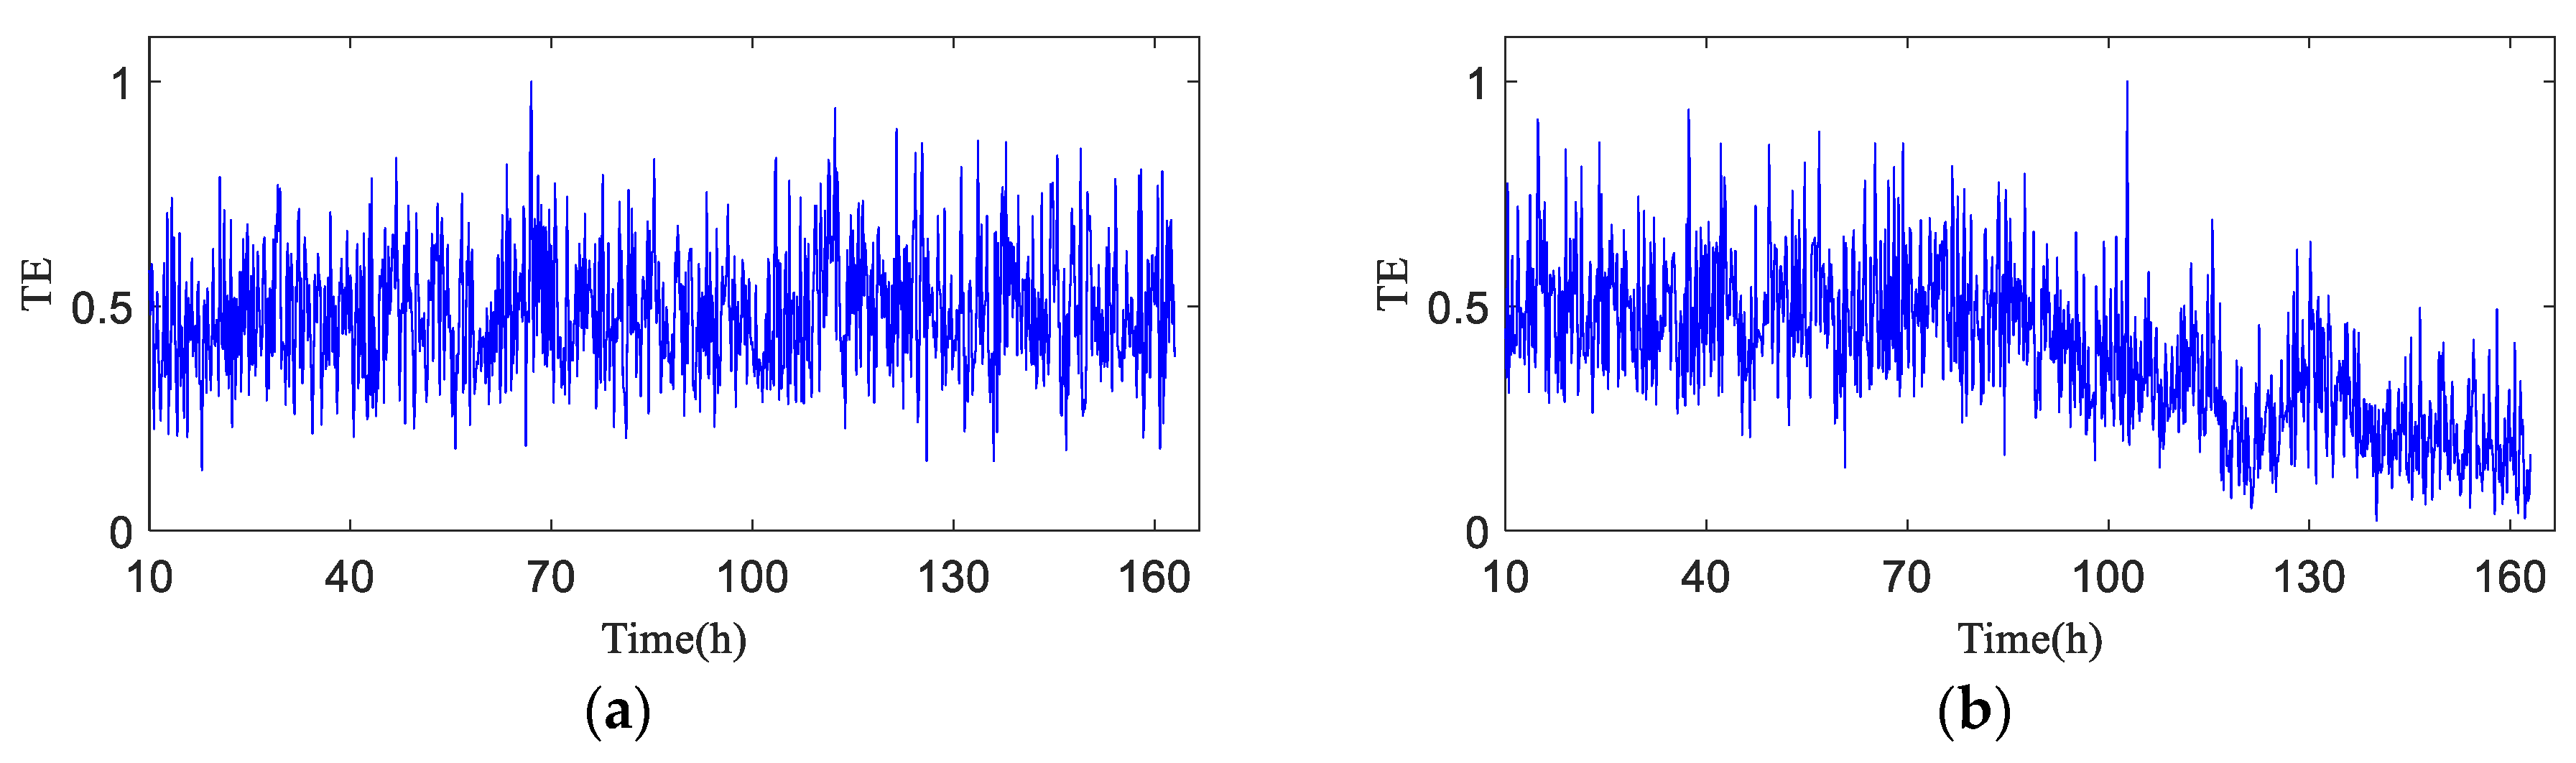
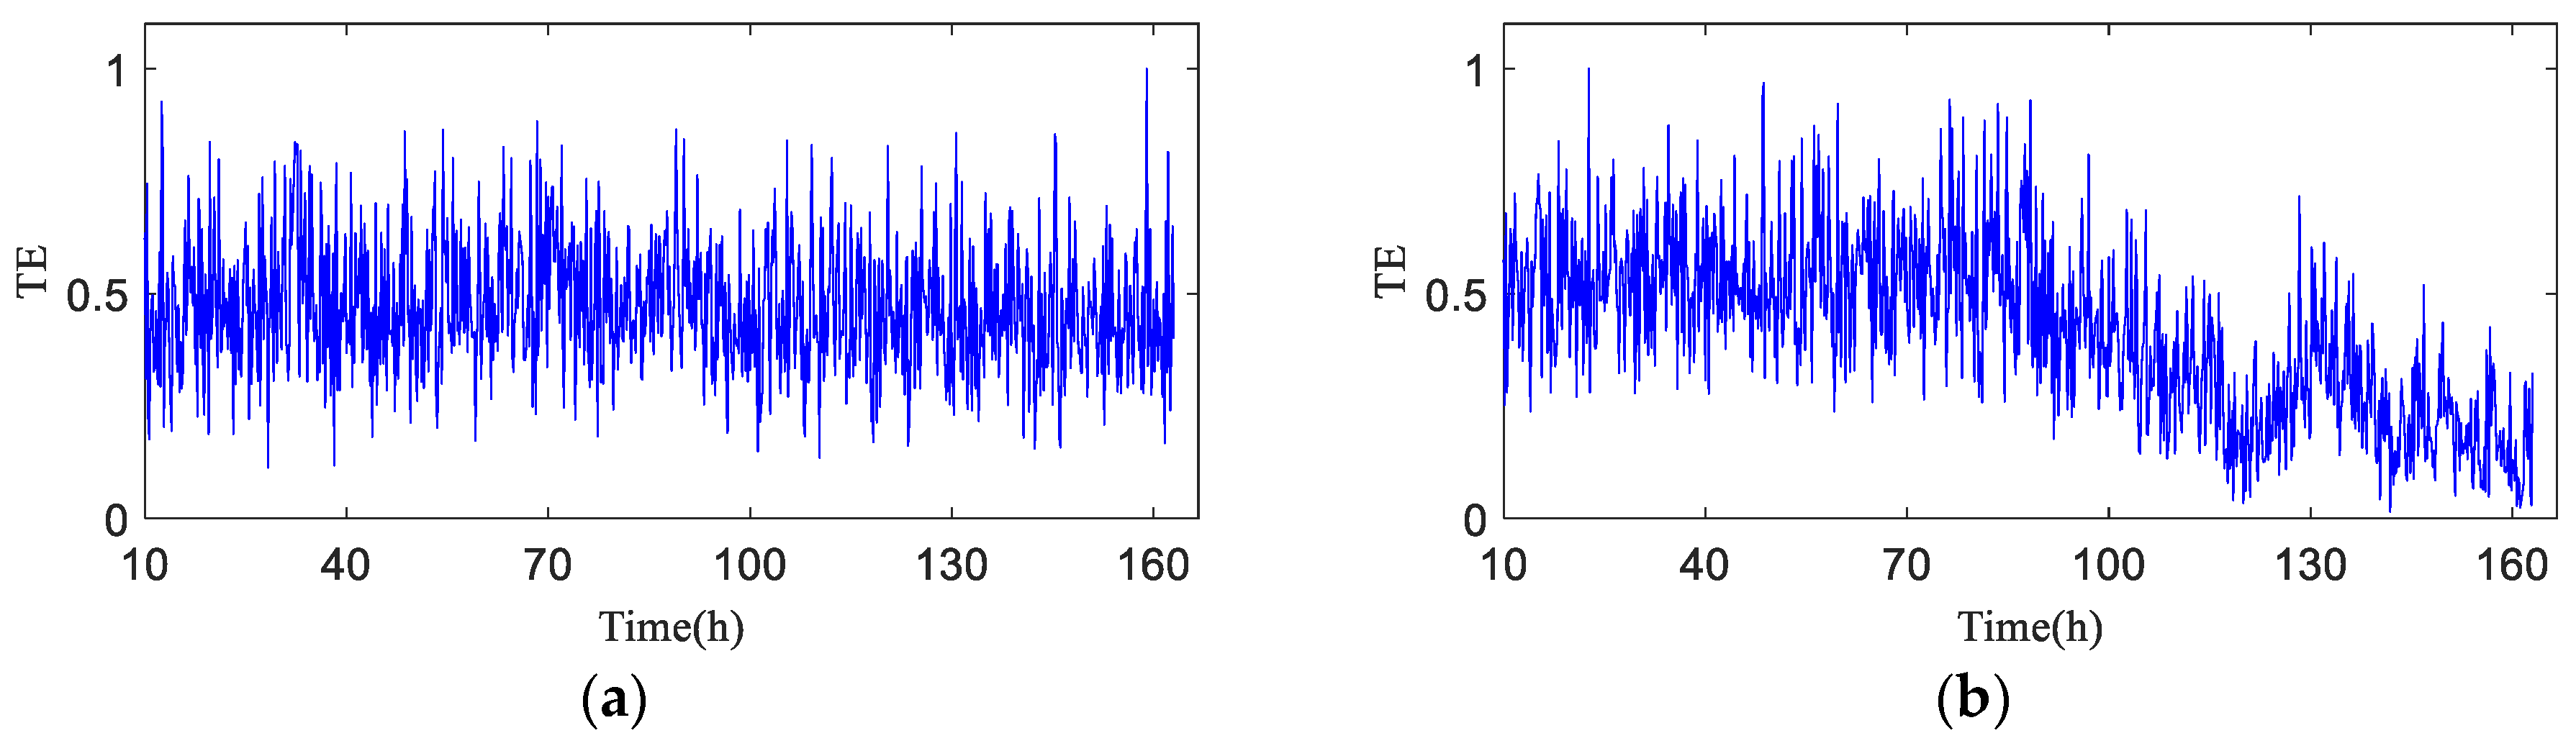
6.3. Early Fault Detection of Rotating Machinery Based on the HAMMED-TE Method
6.4. Research on Noise Robustness of HAMEMD-TE Method
7. Summary and Discussion
Author Contributions
Funding
Acknowledgments
Conflicts of Interest
References
- Montalvo, C.; Gavilán Moreno, C.J.; García-Berrocal, A. Cofrentes nuclear power plant instability analysis using ensemble empirical mode decomposition. Ann. Nucl. Energy 2017, 101, 390–396. [Google Scholar] [CrossRef]
- Li, Z.; Jiang, Y.; Hu, C.; Peng, Z. Recent progress on decoupling diagnosis of hybrid failures in gear transmission systems using vibration sensor signal: A review. Measurement 2016, 90, 4–19. [Google Scholar] [CrossRef]
- Dalvand, F.; Dalvand, S.; Sharafi, F.; Pecht, M. Current noise cancellation for bearing fault diagnosis using time shifting. IEEE Trans. Ind. Electron. 2017, 64, 8138–8147. [Google Scholar] [CrossRef]
- Saucedo-Dorantes, J.J.; Delgado-Prieto, M.; Ortega-Redondo, J.A.; Osornio-Rios, R.A.; Romero-Troncoso, R.D.J. Multiple-fault detection methodology based on vibration and current analysis applied to bearings in induction motors and gearboxes on the kinematic chain. Shock Vib. 2016, 2016, 5467643. [Google Scholar] [CrossRef]
- Glowacz, A. Fault diagnosis of single-phase induction motor based on acoustic signals. Mech. Syst. Signal Process. 2019, 117, 65–80. [Google Scholar] [CrossRef]
- Krolczyk, G.M.; Krolczyk, J.B.; Legutko, S.; Hunjet, A. Effect of the disc processing technology on the vibration level of the chipper during operations. Tehnički Vjesnik 2014, 21, 447–450. [Google Scholar]
- Singh, A.; Parey, A. Gearbox fault diagnosis under fluctuating load conditions with independent angular re-sampling technique, continuous wavelet transform and multilayer perceptron neural network. IET Sci. Meas. Technol. 2017, 11, 220–225. [Google Scholar] [CrossRef]
- Huang, N.E.; Shen, Z.; Long, S.R. The empirical mode decomposition and the Hilbert spectrum for nonlinear and nonstationary time series analysis. Proc. R. Soc. A 1998, 454, 903–995. [Google Scholar] [CrossRef]
- Smith, J.S. The local mean decomposition and its application to EEG perception data. J. R. Soc. Interface 2005, 2, 443–454. [Google Scholar] [CrossRef] [PubMed] [Green Version]
- Guo, T.; Deng, Z. An improved EMD method based on the multi-objective optimization and its application to fault feature extraction of rolling bearing. Appl. Acoust. 2017, 127, 46–62. [Google Scholar] [CrossRef]
- Mariyappa, N.; Sengottuvel, S.; Parasakthi, C.; Gireesan, K.; Janawadkar, M.P.; Radhakrishnan, T.S.; Sundar, C.S. Baseline drift removal and denoising of MCG data using EEMD: Role of noise amplitude and the thresholding effect. Med. Eng. Phys. 2014, 36, 1266–1276. [Google Scholar] [CrossRef] [PubMed]
- Zhang, Y.; Zhang, C.; Sun, J.; Guo, J. Improved wind speed prediction using empirical mode decomposition. Adv. Electr. Comput. Eng. 2018, 18, 3–10. [Google Scholar] [CrossRef]
- Zhang, C.; Li, Z.; Chen, S.; Wang, J.; Zhang, X. Optimised ensemble empirical mode decomposition with optimised noise parameters and its application to rolling element bearing fault diagnosis. Insight-Non-Destr. Test. Cond. Monit. 2016, 58, 494–501. [Google Scholar] [CrossRef]
- Amarnath, M.; Krishna, I.R.P. Detection and diagnosis of surface wear failure in a spur geared system using EEMD based vibration signal analysis. Tribol. Int. 2013, 61, 224–234. [Google Scholar] [CrossRef]
- Vapnik, V. Statistical Learning Theory; Wiley: New York, NY, USA, 1998. [Google Scholar]
- Tabrizi, A.; Garibaldi, L.; Fasana, A.; Marchesiello, S. Early damage detection of roller bearings using wavelet packet decomposition, ensemble empirical mode decomposition and support vector machine. Meccanica 2015, 50, 865–874. [Google Scholar] [CrossRef]
- Sun, J.; Xiao, Q.; Wen, J.; Zhang, Y. Natural gas leak location with K-L divergence-based adaptive selection of Ensemble Local Mean Decomposition components and high-order ambiguity function. J. Sound Vib. 2015, 347, 232–245. [Google Scholar] [CrossRef]
- Yang, Y.; Cheng, J.; Zhang, K. An ensemble local means decomposition method and its application to local rub-impact fault diagnosis of the rotor systems. Measurement 2012, 45, 561–570. [Google Scholar] [CrossRef]
- Zhang, C.; Li, Z.; Hu, C.; Hu, C.; Chen, S.; Wang, J.; Zhang, X. An optimized ensemble local mean decomposition method for fault detection of mechanical components. Meas. Sci. Technol. 2017, 28, 035102. [Google Scholar] [CrossRef] [Green Version]
- Sweeney, K.T.; Mcloone, S.F.; Ward, T.E. The use of ensemble empirical mode decomposition with canonical correlation analysis as a novel artifact removal technique. IEEE Trans. Biomed. Eng. 2013, 60, 97–105. [Google Scholar] [CrossRef] [PubMed]
- Rehman, N.; Mandic, D.P. Multivariate empirical mode decomposition. Proc. R. Sci. A 2010, 466, 1291–1302. [Google Scholar] [CrossRef] [Green Version]
- Mandic, D.; Goh, V.S.L. Complex Valued Nonlinear Adaptive Filters: Noncircularity, Widely Linear and Neural Models; Wiley Publishing: New York, NY, USA, 2009. [Google Scholar]
- Hao, H.; Wang, H.L.; Rehman, N.U. A joint framework for multivariate signal denoising using multivariate empirical mode decomposition. Signal Process. 2017, 135, 263–273. [Google Scholar] [CrossRef]
- Park, C.; Looney, D.; Rehman, N.U.; Ahrabian, A.; Mandic, D.P. Classification of motor imagery bci using multivariate empirical mode decomposition. IEEE Trans. Neural Syst. Rehabil. Eng. 2013, 21, 10–22. [Google Scholar] [CrossRef] [PubMed]
- Lv, Y.; Yuan, R.; Song, G. Multivariate empirical mode decomposition and its application to fault diagnosis of rolling bearing. Mech. Syst. Signal Process. 2016, 81, 219–234. [Google Scholar] [CrossRef]
- Rehman, N.U.; Mandic, D.P. Filter bank property of multivariate empirical mode decomposition. IEEE Trans. Signal Process. 2011, 59, 2421–2426. [Google Scholar] [CrossRef]
- Wu, Y.; Liu, C.; Fan, D. Wind turbine fault diagnosis based on adaptive high-frequency harmonics LMD. J. Chin. Soc. Power Eng. 2014, 34, 952–958. [Google Scholar]
- Hu, A.; Sun, J.; Ling, X. Mode mixing in empirical mode decomposition. J. Vib. Meas. Diagn. 2011, 31, 429–434. [Google Scholar]
- Si, L.; Wang, Z.; Tan, C.; Xu, X. A feature extraction method for shearer cutting pattern recognition based on improved local mean decomposition and multi-scale fuzzy entropy. Curr. Sci. 2017, 112, 2243–2252. [Google Scholar] [CrossRef]
- Richman, J.S.; Lake, D.E.; Moorman, J.R. Sample entropy. Methods Enzymol. 2004, 384, 172–184. [Google Scholar] [PubMed]
- Ni, Q.; Feng, K.; Wang, K.; Yang, B.; Wang, Y. A case study of sample entropy analysis to the fault detection of bearing in wind turbine. Case Stud. Eng. Fail. Anal. 2017, 9, 99–111. [Google Scholar] [CrossRef]
- Bandt, C.; Pompe, B. Permutation entropy: A natural complexity measure for time series. Phys. Rev. Lett. 2002, 88, 174102. [Google Scholar] [CrossRef] [PubMed]
- Tiwari, R.; Gupta, V.K.; Kankar, P.K. Bearing fault diagnosis based on multi-scale permutation entropy and adaptive neuro fuzzy classifier. J. Vib. Control 2015, 21, 461–467. [Google Scholar] [CrossRef]
- Schreiber, T. Measuring Information Transfer. Phys. Rev. Lett. 2000, 85, 461–464. [Google Scholar] [CrossRef] [PubMed] [Green Version]
- Bauer, M.; Cox, J.W.; Caveness, M.H.; Downs, J.J.; Thornhill, N.F. Finding the direction of disturbance propagation in a chemical process using transfer entropy. IEEE Trans. Control Syst. Technol. 2006, 15, 12–21. [Google Scholar] [CrossRef] [Green Version]
- Vakorin, V.A.; Kovacevic, N.; Mcintosh, A.R. Exploring transient transfer entropy based on a group-wise ICA decomposition of EEG data. Neuroimage 2010, 49, 1593–1600. [Google Scholar] [CrossRef] [PubMed]
- Vicente, R.; Wibral, M.; Lindner, M. Transfer entropy: A model-free measure of effective connectivity for the neurosciences. J. Comput. Neurosci. 2011, 30, 45–67. [Google Scholar] [CrossRef] [PubMed]
- Kaiser, A.; Schreiber, T. Information transfer in continuous processes. Phys. D Nonlinear Phenom. 2002, 166, 43–62. [Google Scholar] [CrossRef]
- Nichols, J.M.; Seaver, M.; Trickey, S.T.; Todd, M.D.; Olson, C.; Overbey, L. Detecting nonlinearity in structural systems using the transfer entropy. Phys. Rev. E Stat. Nonlinear Soft Matter Phys. 2005, 72, 046217. [Google Scholar] [CrossRef] [PubMed]
- Liu, G.H.; Xie, Z.K. A modified transfer entropy method for damage detection of beam structures. J. Vib. Eng. 2014, 27, 136–144. [Google Scholar]
- Sun, W.Q.; Huang, X.H. Identification of vibration transfer path for the coupled system of water turbine generator set and power house. J. Vib. Shock 2014, 33, 23–28. [Google Scholar]
- Overbey, L.A.; Todd, M.D. Dynamic system change detection using a modification of the transfer entropy. J. Sound Vib. 2009, 322, 438–453. [Google Scholar] [CrossRef]
- Lee, J.; Nemati, S.; Silva, I.; Edwards, B.A.; Butler, J.P.; Malhotra, A. Transfer entropy estimation and directional coupling change detection in biomedical time series. Biomed. Eng. Online 2012, 11, 19. [Google Scholar] [CrossRef] [PubMed] [Green Version]
- Nichols, J.M.; Seaver, M.; Trickey, S.T. A method for detecting damage-induced nonlinearities in structures using information theory. J. Sound Vib. 2006, 297, 1–16. [Google Scholar] [CrossRef]
- Xie, Z.K.; Liu, G.H.; Wu, Z.G. Dynamic damage identification for beam structures based on transfer entropy. J. Zhejiang Univ. 2012, 46, 1880–1886. [Google Scholar]
- Qiu, H.; Lee, J.; Lin, J.; Yu, G. Wavelet filter-based weak signature detection method and its application on rolling element bearing prognostics. J. Sound Vib. 2006, 289, 1066–1090. [Google Scholar] [CrossRef]


| Rotating Shaft Speed | Sampling Frequency | Sampling Period | Sampling Time | Data Length | Sample Number |
|---|---|---|---|---|---|
| 2000 r/min | 20 kHz | 10 min | 1 s | 20,480 | 984 |
© 2018 by the authors. Licensee MDPI, Basel, Switzerland. This article is an open access article distributed under the terms and conditions of the Creative Commons Attribution (CC BY) license (http://creativecommons.org/licenses/by/4.0/).
Share and Cite
Wu, Z.; Zhang, Q.; Wang, L.; Cheng, L.; Zhou, J. Early Fault Detection Method for Rotating Machinery Based on Harmonic-Assisted Multivariate Empirical Mode Decomposition and Transfer Entropy. Entropy 2018, 20, 873. https://doi.org/10.3390/e20110873
Wu Z, Zhang Q, Wang L, Cheng L, Zhou J. Early Fault Detection Method for Rotating Machinery Based on Harmonic-Assisted Multivariate Empirical Mode Decomposition and Transfer Entropy. Entropy. 2018; 20(11):873. https://doi.org/10.3390/e20110873
Chicago/Turabian StyleWu, Zhe, Qiang Zhang, Lixin Wang, Lifeng Cheng, and Jingbo Zhou. 2018. "Early Fault Detection Method for Rotating Machinery Based on Harmonic-Assisted Multivariate Empirical Mode Decomposition and Transfer Entropy" Entropy 20, no. 11: 873. https://doi.org/10.3390/e20110873