Determinants and Impacts of Financial Literacy in Cambodia and Viet Nam


Asian Development Bank Institute, Tokyo 100-6008, Japan
*
Author to whom correspondence should be addressed.
J. Risk Financial Manag. 2019, 12(1), 19; https://doi.org/10.3390/jrfm12010019
Submission received: 1 December 2018
/
Revised: 11 January 2019
/
Accepted: 21 January 2019
/
Published: 24 January 2019
(This article belongs to the Special Issue Trends in Emerging Markets Finance, Institutions and Money)
Abstract
:Our paper extends the literature on the determinants and impacts of financial literacy by conducting the OECD/INFE survey in two relatively low-income Asian economies—Cambodia and Viet Nam—and analyzing the determinants of financial literacy and the effects of financial literacy on savings and financial inclusion. Generally, our study corroborates the findings of studies of other countries, but uncovers some differences as well. The main determinants of financial literacy are found to be educational level, income, age, and occupational status. Both financial literacy and general education levels are found to be positively and significantly related to savings behavior and financial inclusion, and these results generally hold even when correcting for possible endogeneity of financial literacy.
1. Introduction
Financial literacy is becoming increasingly recognized as an important policy objective in many countries (OECD/INFE 2015b). This reflects the increasing need for individuals to manage their own retirement savings and pensions, resulting mainly from the trend of switching to defined-contribution from defined-benefit pension plans, as well as developments in financial technology (fintech) which require greater sophistication on the part of users. However, surveys consistently show that the level of financial literacy is relatively low even in advanced economies (OECD/INFE 2016). This points to the need to develop strategies for financial education to improve financial literacy. At their summit in Los Cabos in 2012, G20 leaders endorsed the High-Level Principles on National Strategies for Financial Education developed by the Organization for Economic Cooperation and Development International Network on Financial Education (OECD/INFE), thereby acknowledging the importance of coordinated policy approaches to financial education (Group of Twenty (G20) 2012).
Survey data on financial literacy can provide information on the levels of financial literacy of various groups within a country, and thereby indicate which groups have the greatest needs for financial education. Ideally, the survey should be carried out repeatedly to identify where policies have led to improvement of what more needs to be done. Use of a standardized survey instrument also makes it possible to make cross-country comparisons of key measures of financial literacy and related variables.
In order to accomplish this, the OECD/INFE developed a standard survey for gathering information on financial literacy and financial inclusion, the latest version of which is described in OECD/INFE (2015c). OECD/INFE (2016) and OECD/INFE (2017) provides summaries of the results of these surveys for over 30 countries. However, this list includes only five Asian economies—Hong Kong, China; India, the Republic of Korea; Malaysia; and Thailand—and most of these have relatively high incomes. Our study of adult financial literacy in Cambodia and Viet Nam breaks new ground in two ways: (i) It marks the first implementation of the OECD/INFE survey in the so-called CLMV countries (Cambodia, Lao PDR, Myanmar, and Viet Nam); and (ii) Cambodia and Viet Nam have considerably lower levels of per capita income than do most of the other countries previously surveyed. In 2015, nominal per capita GDP in Cambodia was $1144, while in Viet Nam it was $2088, compared to $3754 for Georgia and $3954 for Albania, the lowest among countries previously sampled (IMF World Economic Outlook database).
In the survey form, financial literacy is divided into three related aspects: financial knowledge, financial behavior, and attitudes toward longer-term financial planning. This is consistent with OECD/INFE (2016, p. 47), which defines financial literacy as “… [a] combination of awareness, knowledge, skill, attitude, and behavior necessary to make sound financial decisions and ultimately achieve individual financial well-being.” In other words, the OECD/INFE concept of financial literacy is multidimensional, reflecting not only knowledge, but also skills, attitudes, and actual behavior.
Financial knowledge is information and concepts which help individuals to compare financial products and services and make appropriate, well-informed financial decisions. A basic knowledge of financial concepts, and the ability to apply numerical skills to financial issues enable consumers to manage their financial affairs and respond appropriately to news and events that may have implications for their financial situation. Financial knowledge can be measured either objectively (through survey questions) or subjectively; i.e., by asking respondents to rate their own knowledge compared with that of their peers.
Financial behavior (or financial “savvy”) refers to financial decisions and actions. Some types of behavior, such as delaying bill payments, not planning for future expenditures, or choosing financial products without researching the market, may adversely effect on an individual’s financial situation and well-being. Financial behavior may thus differ from financial knowledge, and it is important to how financial knowledge can affect financial behavior.
Financial attitudes regarding longer-term financial planning include aspects such as individuals’ time preference and willingness to make planned savings. For example, one survey question asks about preferences for the short term through “living for today” and spending money. Such preferences are likely to promote behaviors that could lead to reduced financial resilience and well-being.
This paper is organized as follows. Section 2 briefly discusses the literature on determinants of financial literacy and its effects. The data collection and empirical approach is presented in Section 3. Section 4 and Section 5 present the descriptive analyses and empirical results, followed by conclusions and policy implications in Section 6.
2. Literature Survey
The literature on financial literacy focuses on two main areas: (i) the determinants of financial literacy, including age, gender, level of education, and occupation; and (ii) the effects of financial literacy on financial behavior, including saving, use of credit, and preparation for retirement.
One of the earliest to develop quantifiable measures of financial literacy was that of the Jump$tart Coalition for Personal Financial Literacy program for high school and college students in the US in 1997 described in Mandell (2009). Lusardi and Mitchell (2006) added a set of financial literacy questions to the 2004 Health and Retirement Study (HRS), a survey of US households aged 50 and older, which have served as a model for later surveys. The three core questions in the original survey were aimed at identifying respondents’ understanding of some key financial concepts: compound interest, real rates of return, and risk diversification. Later surveys, including the OECD/INFE survey, extended the financial knowledge questions but also added questions about financial attitudes, financial behavior, and financial experience. The methodology for calculating scores from the OECD/INFE survey responses is described below in Section 3.2.
Lusardi and Mitchell (2014) provide an extensive review of the literature on factors related to financial literacy. Financial literacy scores tend to follow a hump-shaped pattern with respect to age, first rising and then declining in old age. However, elderly persons’ confidence in their financial literacy shows no similar decline, suggesting a perceptual gap. Women generally score lower than men in financial literacy, although this seems to vary a lot by country and culture. On the other hand, women tend to be more willing to admit not knowing an answer than men are. Higher levels of education and parents’ education are positively correlated with financial literacy. These findings were generally confirmed in the analysis of the results of the OECD/INFE survey in the above-mentioned sample of 30 countries in OECD/INFE (2016).
A key question for policy is whether financial education programs can improve financial literacy. A large number of studies have been conducted, but the results are inconclusive. The results depend on many specific aspects of the programs, including course content, knowledge of the teachers, etc. Fernandes et al. (2014) perform a meta-analysis of 188 studies and find that financial education has a significant but very small effect of only 0.1% on related economic behaviors. Lusardi and Mitchell (2014) cite Walstad et al. (2010) as an example of a careful study that found significant impacts from a financial literacy study program. In their survey, Hastings et al. (2013, p. 359) argue that the evidence on the effectiveness of financial education programs on financial literacy is “… at best contradictory.”
Many papers attempt to link measures of financial literacy with other economic and financial behaviors, going back to Bernheim (1995, 1998) in the US. Hilgert et al. (2003) found a strong correlation between financial literacy and daily financial management skills, while other studies found that the more numerate and financially literate are more likely to participate in financial markets, invest in stocks, and make precautionary savings (Christelis et al. 2010; van Rooij et al. 2011; de Bassa Scheresberg 2013). The more financially savvy are also more likely to undertake retirement planning, and those who make financial plans also tend to accumulate more wealth (Lusardi and Mitchell 2011). Mahdzan and Tabiani (2013) find similar evidence in Malaysia.
In terms of household borrowing, Moore (2003) found that those with lower financial literacy are more likely to have more expensive mortgages. Campbell (2006) showed that those with lower income and less education were less likely to refinance their mortgages during periods of falling interest rates. Stango and Zinman (2009) found that those who could not correctly calculate interest rates generally borrowed more and accumulated less wealth.
3. Data and Methodology
3.1. Data Collection
We used the harmonized OECD/INFE questionnaire of adult financial literacy (OECD/INFE 2015c) to ensure comparability with studies of other countries. The questionnaire includes questions about individual information (such as gender, age, income, occupation, and other sociodemographic information) and questions about financial literacy and financial inclusion. ADBI translated the OECD/INFE questionnaire into Khmer and Vietnamese and conducted cross-checks with Cambodian and Vietnamese teams from Indochina Research Ltd. to ensure the correctness of the translation.
The surveys were conducted by Indochina Research Ltd. under the direction of the Asian Development Bank Institute. Data collection was conducted in October and November 2016. Multilevel stratification was used. Cambodia was divided into five geographical regions (including Phnom Penh, Coastal, Plain, Mountain, Plateau and Mountain, and Tonle Sap) and Viet Nam into six geographical regions (including Northern Highland and Midland, Red River Delta, Northern and Coastal Central, Central Highland, South East, and Mekong River Delta). For Cambodia, we selected Phnom Penh plus two randomly chosen provinces from each of the other four regions. For Viet Nam, we selected Ha Noi (the capital city) and Ho Chi Minh City (the economic hub), plus two provinces each in the Red River Delta and South East areas, and three provinces in other regions. In each province, the provincial city was selected to represent the urban population while we randomly selected one rural district (in Cambodia) or one or two rural districts (in Viet Nam) for the rural sample. In each district, we randomly selected the communes and individual households based on simple sampling procedures. In Cambodia, there were 1035 respondents from nine cities/provinces, and in Viet Nam, there were 1000 respondents from 18 cities/provinces. Details of the sample distribution are given in Appendix A.
3.2. Construction of Financial Literacy Scores
In this paper, we follow the methodology in OECD/INFE (2015a) to calculate scores for the various indicators of financial literacy and financial inclusion. The score for financial knowledge is calculated from responses to seven questions reflecting the subject’s understanding of basic knowledge (or awareness) of finance such as calculation of interest rates and compound interest rates, risk and return evaluation, the effect of inflation, and the benefits of financial diversification. This indicator ranges between 0 and 7 based on the number of correct answers. The financial behavior score is calculated from nine questions relating to household budgeting, saving, considered purchases, bill payments, care about financial affairs, long-term financial goals, and borrowing, and ranges between 0 and 9. The score for financial attitude measures the respondent’s responses to five questions about about money, saving, and spending, and ranges from 1 to 5. A higher score represents more conservative and considered behavior. The overall score for financial literacy is the sum of three scores, and hence takes values between 1 and 21. The score for financial inclusion is calculated from seven indicators, including holdings of payment products, savings, insurance, credit products, product choice, and family financial support in case of emergency, and ranges from 0 to 7.
For ease of interpretation, we converted all indicator scores into z-score values:
where is the converted z-score, is the mean score, and is the standard deviation of the score.
3.3. Methodology
In this paper, we estimate the following equations for indices related to financial literacy:
where alternatively indicates the financial literacy, financial knowledge, financial behavior, and financial attitude score of individual ; is the natural logarithm of individual ’s household income; is a vector of control variables; and is the identically and independently distributed (i.i.d.) error term. The control variables include individual age, education level, gender, occupation, rural versus urban residence, and province. With regards to age, we divide the sample into three age groups: those under 30 years old, those over 30 years old but under 60 years old, and those over 60 years old. We use the group of over-60-years-old individuals as the base group. For educational level, we combine the categories into three groups: (i) those with some primary education or who have completed primary school (called the “some primary education” group)1; (ii) those with some secondary education or who have completed secondary school (called the “some secondary education” group); and (iii) those with at least some technical education or university-level education (called the “tertiary education” group). The last group is used as the base group. With regards to occupations, we combine those who are apprentices, unemployed workers (including voluntarily unemployed people), retired and disabled people, and students into one group of nonworking people and use this as the base group in this study. The remaining groups are self-employed people, salaried employees, and housewives.2
3.3.1. Effects of Financial Literacy on Saving Behavior
To quantify the effect of financial literacy on saving behavior, the following equation is estimated:
where is a dummy variable, taking the value of one if the individual has any types of saving products and zero otherwise.3 is the financial literacy score, and measures the effects of financial literacy on saving behavior. Other variables are defined the same as in Equation (1) and is the i.i.d. error term.
3.3.2. Effect of Financial Literacy on Financial Inclusion
To quantify the effect of financial literacy on financial inclusion, the following equation is estimated:
where is the financial inclusion score, is the financial literacy score, and measures the effects of financial literacy on saving behavior. Other variables are defined the same as in Equation (1) and is the i.i.d. error term.
4. Descriptive Statistics4
Table 1 presents the average values of the scores of financial literacy and financial inclusion in Cambodia and Viet Nam, including breakdowns by various categories. In both countries, the level of financial literacy is rather low, with that of Cambodia being the lower of the two. The financial literacy scores are only 11.8 and 12.5 in Cambodia and Viet Nam, respectively, out of a total possible score of 21. These scores are much lower than the 30-country average score of 13.3 and those of some other developing Asian economies such as Thailand (12.8) and Malaysia (12.3) (see OECD/INFE 2016).
Of greater concern, perhaps, is the fact that the share of respondents who answered correctly five out of seven financial knowledge questions, which is considered to be the minimum target level, was very low. Based on our samples, only 17.0% of people in Cambodia and 36% of people in Viet Nam answered correctly five or more questions. On average, this figure is 62% for the OECD countries surveyed, and 56% for the full sample of 30 countries surveyed (OECD/INFE 2016). Again, however, this gap can be attributed to the low level of income in these two countries.
These average financial literacy scores are quite consistent with individuals’ self-assessment of overall knowledge about financial matters compared with other adults in each country (Figure 1). Only about 12–14% of Cambodian and Vietnamese respondents considered themselves to have a better understanding of overall knowledge about financial matters than other adults. This is consistent with the results for other countries with relatively low financial literacy scores. About 63% in Cambodia and 59% in Viet Nam self-assessed that they have the same level as other adults.
Financial literacy varies by population group in both Cambodia and Viet Nam (Table 1). In both countries, younger, urban, more educated, and higher-income respondents have higher financial literacy scores. While female Cambodians have slightly lower financial literacy scores than male Cambodians (11.74 vs. 11.85), female Vietnamese have higher financial literacy scores than their male counterparts (12.80 vs. 12.50).
For all subcomponents of the financial literacy score, younger, more educated and higher income groups of population have higher scores than older, less educated and poorer ones in both Cambodia and Viet Nam. Cambodian women have higher financial knowledge and financial attitude scores, and lower financial behavior score than their male counterparts, but in Viet Nam, women have lower financial knowledge scores and higher financial behavior, and financial attitude scores than men. Similarly, the differences in financial literacy score between Cambodian rural and urban residents are mostly due to differences in financial behavior and financial attitude score while differences in scores of all three sub-components between rural and urban residents add up to the rather large gaps in urban and rural financial literacy scores in Viet Nam.
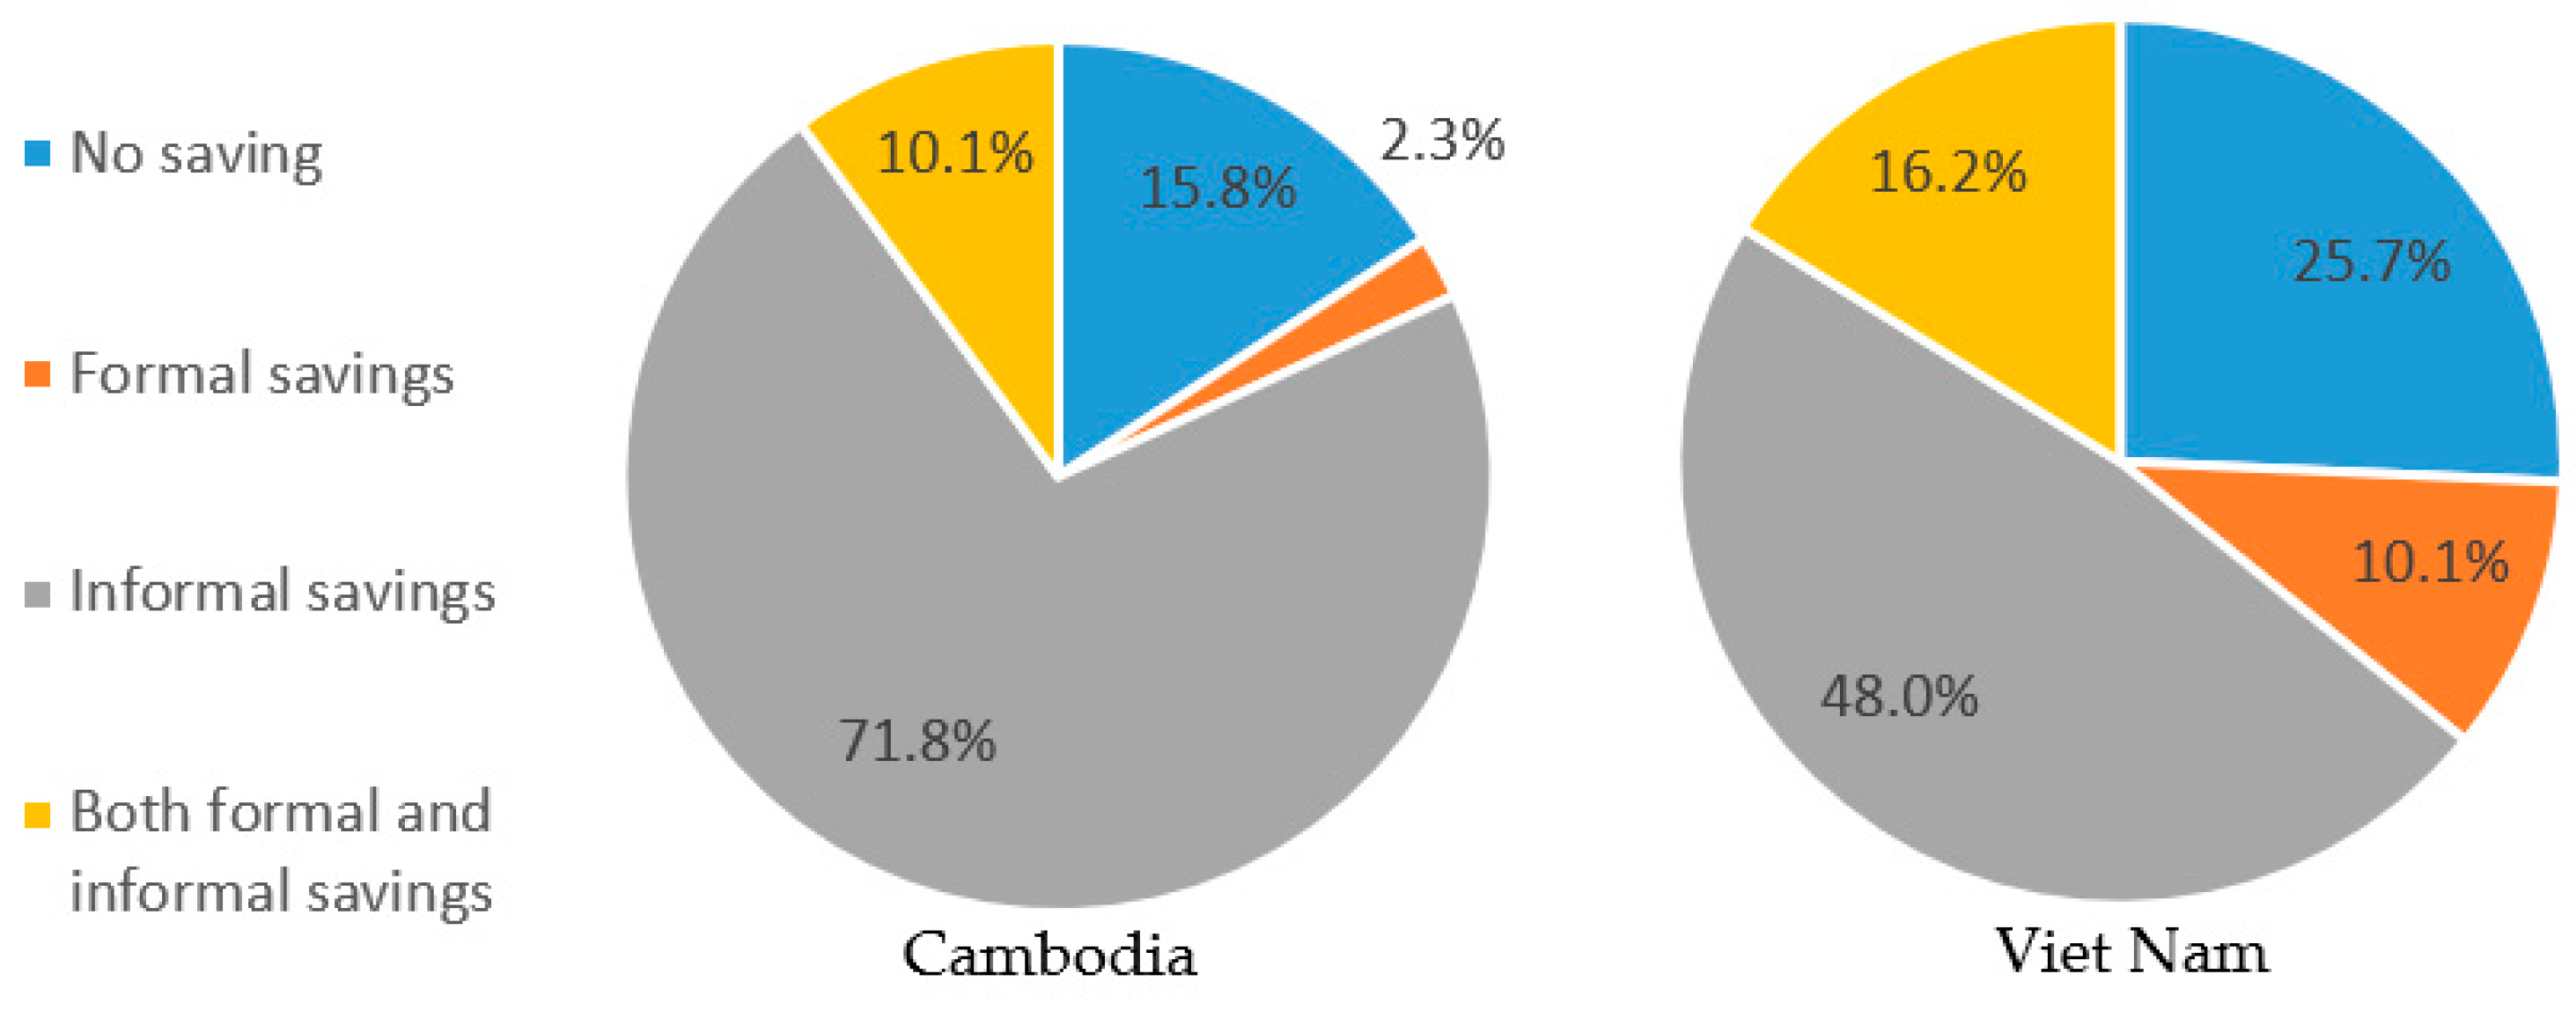
Figure 2 documents the saving behavior of Cambodian and Vietnamese in our sample. The proportion of respondents who do not have saving products is rather low in both Cambodia (16.0%) and Viet Nam (25.7%). The saving forms that most of respondents in our sample use are informal (such as keeping money at home, asking friends, relatives, or other family members to keep money for them). More than 80% of Cambodian and 64% of Vietnamese use this form of saving. The proportion of respondents who save in formal financial institutions or buy saving products (i.e., formal saving forms) is rather low, however. A relatively small share of respondents (10.1% in Cambodia and 16.2% in Viet Nam) have both formal and informal savings.
Table 2 presents the descriptive statistics of explanatory variables included in the econometric models (both unweighted and weighted samples). The average monthly household income is USD 310.0 in Cambodia and USD 420 in Viet Nam.5 In the Cambodian sample, 53% have only some primary education, 43% have some secondary education, while only 4.1% have some tertiary education. Although more than a quarter of the Vietnamese sample have some tertiary education, which is much higher than the Cambodian sample, the group with some secondary education accounts for the largest proportion, at 41%. The age distribution is also slightly different. While people aged over 60 account for more than 11% of the Cambodian sample, they make up only about 3% of the Vietnamese sample. With regards to occupation, while 52% of the Cambodian sample are self-employed, this figure is only 22% in the Viet Nam sample. Salaried employees account for one-third of the Vietnamese sample, which is much higher than the Cambodian figure (16%). About 70% of Cambodian respondents live in rural areas while this figure is about 61% in Viet Nam. Due to the rather large differences in the Cambodian and Vietnamese samples, in this paper, we estimate the determinants of financial literacy and the impacts of financial literacy on financial inclusion and the savings decision separately for each country. However, we also provide results for the pooled sample in Appendix D.
5. Econometric Results
In this section, we estimate the determinants of financial literacy, and the effects of financial literacy on the savings decision and financial inclusion in Cambodia and Viet Nam.
5.1. Determinants of Financial Literacy
Table 3 shows ordinary least squares (OLS) regressions for the overall financial literacy score of Cambodia (columns 1 and 2) and Viet Nam (columns 3 and 4). Columns 2 and 4 include household income as an explanatory variable. The results indicate that, in both Cambodia and Viet Nam, people with higher education have higher scores of financial literacy. For example, in Cambodia, those with only some primary education or some secondary education have a lower financial literacy score than those with some tertiary education by 0.63 or 0.37 percentage points, respectively. This corroborates the results of many other studies which used a variety of methods for calculating financial literacy scores, including Bucher-Koenen and Lusardi (2011), OECD/INFE (2016), and Murendo and Mutsonziwa (2017). The coefficients on education level are slightly smaller in absolute terms in Viet Nam than in Cambodia, but still highly significant. It should be noted that the R-squared is significantly lower for Cambodia than for Viet Nam in all of the regressions.
The coefficient on income is statistically significant at the 1% level, suggesting that a higher income is associated with a higher financial literacy score. This relationship holds even when some indicators that determine the individual income such as education and occupation have been controlled for.
It is surprising that the coefficients of the two age categories are not statistically significant for Viet Nam, suggesting that the individual age is not correlated with financial literacy, although the 30–60 age group shows a significantly higher level in Cambodia.6 This result is different from some previous literature such as Jappelli and Padula (2013) and OECD/INFE (2016). The correlation between age and financial literacy may be captured by the education variables. This could be due to the fact that both Viet Nam and Cambodia are developing economies, and thus the older generation has lower education levels than the younger generation. The coefficient for males is not significant, which shows that there is not much difference in financial literacy between women and men in Cambodia and Viet Nam. This is also different from results in other studies, where men typically score higher (Lusardi and Mitchell 2014).
The results also indicate that occupational status correlates with financial literacy. In Cambodia, the self-employed, salaried workers, and housewives have significantly higher financial literacy scores than the base group (the unemployed, retired people, students). In Viet Nam, the self-employed workers have higher financial literacy scores than the base group, while the salaried workers’ and housewives’ scores are not statistically, significantly different from the base group. Rural residents in Viet Nam have lower financial literacy scores than their urban counterparts, as expected, but no difference in financial literacy scores between rural and urban areas is observed in Cambodia.
Table 4 presents the regression results for the determinants of the three subcomponents of the financial literacy score: financial knowledge (columns 1 and 2), financial behavior (columns 3 and 4), and financial attitude (columns 5 and 6). We find that correlations between the covariates and each of the financial literacy subcomponents vary. For the Cambodian sample, only education level and income are significantly associated with financial knowledge. For the case of Viet Nam, income, education level, and occupation are not significantly correlated with financial knowledge. Unlike the case of Cambodia, in Viet Nam men have significantly higher financial knowledge scores than do women.7 Rural residents also have lower financial knowledge scores than urban residents. With regards to the determinants of financial behavior, the estimation results for both Cambodian and Vietnamese samples suggest that higher financial knowledge is positively associated with savvier financial behavior, and this relationship is statistically significant at the 1% level. In both countries, individuals with a higher household income show savvier behavior than those with a lower income. Higher education is only significantly correlated with higher financial behavior scores in the Vietnamese sample. Cambodian respondents who are from 30 to 60 years old and male are likely to have higher financial behavior scores, but at only the 10% level of significance. Meanwhile, in Viet Nam, the respondents aged under 30 are less savvy than those aged over 60, and those aged from 30 to 60 are not significantly different from those aged over 60 in terms of “savvy” financial behavior. Unlike the Cambodian sample, male respondents in the Vietnamese sample are less savvy than female respondents at the 1% level. In Cambodia, those who are either self-employed, salaried employees, or housewives are savvier than those in the base groups (i.e., the unemployed, retired people, and students). But among the Vietnamese, only the self-employed are more likely to be savvy in their financial behavior than individuals in other occupations.
The results in columns 5 and 6 show that very few covariates are correlated with financial attitude. In Cambodia, higher-income and salaried employees tend to have more conservative views on money, saving, and consumption, while this is only the case for housewives in Viet Nam. Financial knowledge is not significantly associated with financial attitude in Cambodia, and has only a weak (and not statistically significant) correlation among the Vietnamese.
5.2. Effect of Financial Literacy on Savings Behavior
Table 5 presents the regression results for the relation between financial literacy and savings behavior.8 Since our saving behavior variable is binary, we estimate the savings behavior equation using both linear probability and probit estimators. The linear probability regression results are reported in columns 1 and 2 (for Cambodia) and columns 4 and 5 (for Viet Nam) while columns 3 and 6 display the results (marginal effects) from probit estimators for each country, respectively. In both countries, financial literacy has a positive and statistically significant correlation with positive savings behavior, regardless of the estimators used. Moreover, the coefficients on financial literacy are quite similar in all estimates. A one standard deviation increase in the financial literacy score is associated with an increased probability of some savings by around 7 percentage points in Cambodia and 10 percentage points in Viet Nam. A higher income is also positively associated with the probability of saving in Cambodia, but not in Viet Nam. With regards to education, those with some primary education (in both Cambodia and Viet Nam) and some secondary education (in Viet Nam and, to some extent, in Cambodia) tend to have a lower probability of saving than those with some tertiary education (the base group). While age is not correlated with the probability of saving in Cambodia, in Viet Nam, individuals under 60 years old also tend to have a lower probability of saving than those over 60. There is no difference in savings probability between men and women in Viet Nam, but there is a weak (and positive) correlation between being a male and saving in Cambodia. This tendency is also reflected in the negative coefficient for being a housewife; i.e., housewives save less than other occupational groups.
However, the OLS estimates may be biased due to reverse causality (i.e., those with savings could improve their financial literacy), omitted variable biases, or measurement error in financial literacy. In order to address these endogeneity problems, we use an instrumental variable (IV). Following Fernandes et al. (2014) and Murendo and Mutsonziwa (2017), we use the mean financial literacy score at the provincial level as an instrument for individual financial literacy.9
Columns 2 and 4 in Table 6 are the first-stage estimation results for Cambodia and Viet Nam, respectively, while columns 1 and 3 are the second-stage results, respectively.10 The first-stage results indicate that the mean financial literacy at the provincial level is highly correlated with individual financial literacy. Also, the first-stage results are not qualitatively different from the estimation results presented in Table 3 where we do not control for regional financial literacy. Underidentification statistics and weak identification tests show that in both countries our IV does not suffer from underidentification or weak instrument problems. Our IV estimation results show a positive and significant impact of financial literacy on individual savings behavior in both Cambodia and Viet Nam. When we control for endogeneity of financial literacy, the coefficient estimate of financial literacy is higher for Cambodia than for Viet Nam. A one standard deviation increase in financial literacy score raises the likelihood of having a formal saving product by 16 percentage points in Cambodia (increased from 7 percentage points if endogeneity is not controlled for) and only 7 percentage points in Viet Nam (reduced from 10 percentage points).
With regards to other control variables, for the case of Cambodia, most covariates that were correlated with savings behavior in Table 5 lose their significance, except for being under 30 years old and being a housewife. The coefficients on income and education become insignificant, suggesting that the correlation of this variable with the savings decision has been captured by the financial literacy score. For the case of Viet Nam, all covariates retain their impacts in determining savings behavior. Moreover, income is positively associated with the likelihood of having a formal saving product, and salaried workers are less likely to have such products than those in the base group.
Individuals may adopt different types of savings to mitigate the risks or maximize the returns. Table 7 presents the estimation results from the multinomial probit regression, which estimates the effect of financial literacy on the savings portfolio (Panel A for Cambodia and Panel B for Viet Nam). In this estimation, respondents who do not save in any form comprise the base group. Column 1 reports the marginal effects of financial literacy on having no savings; columns 2 and 3 present the marginal effects of financial literacy on using only formal savings and using only informal savings, respectively. Column 4 presents the marginal effects on having saved in both formal and informal forms. The results show a negative relationship between financial literacy score and the probability of not saving. A one standard deviation increase in the financial literacy score reduces the likelihood of not saving by 12.4 percentage points in Cambodia and 16.8 percentage points in Viet Nam. Financial literacy is positively correlated with the probability of having informal savings, especially in Viet Nam. While the financial literacy score does not have a significant effect on having only formal savings, it has strong effects on having both formal and informal savings. If the financial literacy score increases by one standard deviation, the likelihood of having saved in both formal and informal forms increases by 7.1 percentage points in Cambodia and 10.5 percentage points in Viet Nam. Appendix C shows the results for having some form of savings (informal, formal, or both) using OLS, probit, and IV estimators.
5.3. Effect of Financial Literacy on Financial Inclusion
Table 8 reports our estimation results for the relation between financial literacy and financial inclusion in Cambodia (columns 1–3) and Viet Nam (columns 4–6). The OLS estimator is used in columns 1 and 4, while the instrumental variables estimator is used in the remaining columns. The results using the OLS estimator show that, in both countries, financial literacy is positively associated with financial inclusion, and this relationship is significant at the 1% level. A one standard deviation increase in the financial literacy score is associated with a rise in the financial inclusion score of 41.5 percentage points in Cambodia and 34.4 percentage points in Viet Nam. A higher income is also positively associated with financial inclusion in Cambodia and is also correlated with higher financial inclusion in Viet Nam, but this relationship is only significant at the 10% level. With regards to education, when financial literacy and income are controlled, higher education levels are still significantly associated with higher financial inclusion in Viet Nam, but not in Cambodia. This may be due to the fact that the association between education and financial literacy is stronger in Cambodia than in Viet Nam, as we conjectured regarding the results in Table 3. For Viet Nam, only education level has a statistically significant effect on financial inclusion. However, for Cambodia, higher financial inclusion is also significantly related to those aged 30 to 60, the self-employed, and salaried employees relative to the base group. Housewives and people living in rural areas have lower financial inclusion scores in Cambodia.
Similar to the relationship between financial literacy and the savings decision, the OLS estimates may suffer from endogeneity problems. To address this issue, we also use the mean financial literacy score at the provincial level as an instrument for individual financial literacy. Columns (3) and (6) are the first-stage estimation results for Cambodia and Viet Nam while columns (2) and (5) are the second-stage results, respectively. The test statistics indicate that our IV does not suffer from underidentification or weak instrument problems.
With regards to the impact of financial literacy on financial inclusion, the estimation results show a positive and significant impact, actually larger than that of the OLS estimates. This is consistent with all other studies that use IVs for financial literacy, regardless of instruments, to calculate financial literacy scores such as Agnew et al. (2013), and Bucher-Koenen and Lusardi (2011). According to Lusardi and Mitchell (2014), the true effect of financial literacy seems to be biased downward, although the larger magnitude of the IV coefficient may be attributed to either measurement errors or a larger response from those who are affected by the instruments.
The estimation results also indicate that, for the case of Cambodia, other covariates that are correlated with financial inclusion in the OLS estimation (column 1) lose their significance, except for the housewife variable. This suggests that the correlations of the other variables with financial inclusion was captured by the financial literacy score. For the case of Viet Nam, a lower education level is still correlated with a lower level of financial inclusion, while the coefficient for the self-employed becomes statistically significant when an instrument is used for the financial literacy. Higher income is also significantly related to financial inclusion in Viet Nam.
6. Discussion
Our study of adult financial literacy in Cambodia and Viet Nam breaks new ground in two ways: (i) It marks the first implementation of the OECD/INFE survey in the so-called CLMV countries (Cambodia, Lao PDR, Myanmar, and Viet Nam); and (ii) Cambodia and Viet Nam have considerably lower levels of per capita income than the other 30 countries in OECD/INFE (2016). Generally, our study corroborates the findings of studies of other countries but uncovers some differences as well. The overall scores of financial literacy in Cambodia (11.8) and Viet Nam (12.7) are at the low end of the range seen in the other 30 countries that have implemented the OECD/INFE survey, and near those for Poland and Belarus. However, these results are relatively good when taking into account the levels of per capita income in those two countries.
Our analysis shows that that the level of education generally is highly significant and positively correlated with financial literacy in both Cambodia and Viet Nam. This holds for both the overall measure of financial literacy and the subscores for financial knowledge, financial behavior, and for savings. However, the education level was not significant for financial attitudes. These results were consistent with the findings for the other 30 countries reported in OECD/INFE (2016). These results also consistent with those of Bucher-Koenen and Lusardi (2011), and Murendo and Mutsonziwa (2017), which use different measures of financial literacy.
Respondents aged 30–60 had significantly higher overall financial literacy scores than other age groups, but the effects of age on individual subscores were less consistent or significant. In particular, there was no significant effect of age on financial attitude. This generally is consistent with the findings for the other 30 countries where age groups 30–60 generally had higher scores for both financial knowledge and financial behavior.
Interestingly, gender was not very significant for overall financial literacy in either country. The gender coefficient was not significant for Cambodia, while for Viet Nam it was significant, but only about half the average magnitude of the other 30 countries (0.18 vs. 0.32) (OECD/INFE 2016). This result differs from some other studies. For example, Lusardi and Mitchell (2014) find that men typically have higher financial literacy scores than women. While we do not have an explanation for this difference, and cultural factors are probably significant, we conjecture that differences in education levels between men and women in Cambodia and Vietnam may capture most of the gender differences in financial literacy. This issue merits further study.
The results generally showed that self-employed workers and salaried workers had higher levels of financial literacy than other employment categories in both countries, and housewives had higher levels of financial literacy in Cambodia. These results were less strong for the various subscores, but generally pointed in the same direction, especially for financial behavior.
The finding with the most important macroeconomic implications is that both financial literacy and general education levels are positively and significantly related to formal and informal savings activity, and financial literacy has an independent effect even when the general education level is corrected for. Similar to Fernandes et al. (2014) and Murendo and Mutsonziwa (2017), our result still holds when the possible endogeneity of financial literacy is corrected for by using the regional average financial literacy level as an instrumental variable. This implies that improving general education levels is important, but additional gains can be obtained by developing policies such as financial education programs that directly raise financial literacy. Such programs could have important potential impacts in terms of increasing savings in those countries.
Similarly, both financial literacy and general education levels are found to be positively and significantly related to the measure of financial inclusion. This holds in most cases even when the possible endogeneity of financial literacy is corrected by using regional average financial literacy as an instrumental variable. Increased financial inclusion means that increased savings can be made more readily available for investment activity in those countries. Again, this underlines the importance of developing policies to raise both general education and financial literacy.
Author Contributions
Conceptualization, P.J.M. and L.Q.T.; survey management, P.J.M.; econometric analysis, L.Q.T.; writing—original draft preparation, P.J.M. and L.Q.T.; writing—review and editing, P.J.M.; supervision, P.J.M.; project administration, P.J.M.
Funding
This research received no external funding.
Acknowledgments
We thank the Organisation for Economic Co-operation and Development (OECD), the National Bank of Cambodia, the State Bank of Vietnam and the Cambodia and Viet Nam resident missions of the Asian Development Bank for their support in carrying out this study. We also thank the staff of Indochina Research Ltd. for their diligent work on implementing the survey. All errors are our own.
Conflicts of Interest
The authors declare no conflict of interest.
Appendix A

Table A1.
Sample distribution by region in Cambodia and Viet Nam (number of respondents).
| All Sample | Urban | Rural | |
|---|---|---|---|
| Cambodia | 1035 | 291 | 744 |
| Phnom Penh | 103 | 103 | 0 |
| Coastal | |||
| Kampot | 54 | 11 | 43 |
| Preah Sihanouk | 23 | 5 | 18 |
| Plain | |||
| Kampong Cham | 268 | 53 | 215 |
| Takeo | 131 | 26 | 105 |
| Plateau and Mountain | |||
| Kratie | 91 | 20 | 71 |
| Stung Treng | 34 | 8 | 26 |
| Tonle Sap | |||
| Kampong Chhnang | 240 | 47 | 193 |
| Otdar Meanchey | 91 | 18 | 73 |
| Viet Nam | 1000 | 309 | 700 |
| Red River Delta | |||
| Ha Noi | 185 | 56 | 129 |
| Vinh Phuc | 30 | 9 | 21 |
| Thai Binh | 50 | 15 | 35 |
| Northern Highland and Midland | |||
| Thai Nguyen | 30 | 8 | 22 |
| Lang Son | 20 | 6 | 14 |
| Son La | 20 | 6 | 14 |
| Northern and Coastal Central | |||
| Da Nang | 30 | 9 | 21 |
| Phu Yen | 30 | 9 | 21 |
| Nghe An | 90 | 27 | 63 |
| Highland | |||
| Lam Dong | 40 | 12 | 28 |
| Dak Lak | 50 | 15 | 35 |
| Gia Lai | 40 | 12 | 28 |
| South East | |||
| HCMC | 205 | 62 | 143 |
| Ba Ria | 30 | 9 | 21 |
| Tay Ninh | 30 | 9 | 21 |
| Mekong Delta | |||
| Can Tho | 40 | 12 | 28 |
| Ca Mau | 40 | 12 | 28 |
| Ben Tre | 40 | 12 | 28 |
Appendix B. Sample Weight Calculations
Table A2.
Share of income groups in Cambodia: our sample vs. population.
| Income | Our Sample (%) | 2017 Media Index |
|---|---|---|
| Larger than $500 | 14% | 16% |
| From $351 to $500 | 19% | 18% |
| From $201 to $350 | 35% | 28% |
| From $101 to $200 | 25% | 28% |
| Less than 100$ | 8% | 11% |
Table A3.
Share of income groups in rural and urban Viet Nam: our sample vs. population.
| Our Sample | Nielsen Monitoring | |||
|---|---|---|---|---|
| Rural | Urban | Rural | Urban | |
| VND 15 Mill. or higher | 2% | 6% | 6% | 20% |
| From VND 7.5 Mill. to VND 14.99 Mill. | 11% | 22% | 22% | 38% |
| From VND 4.5 Mill. to VND 7.49 Mill. | 32% | 32% | 38% | 32% |
| From VND 3.0 Mill. To VND 4.49 Mill. | 37% | 30% | 25% | 9% |
| Less than VND 3.0 Mill | 18% | 10% | 10% | 2% |
Table A4.
Share of rural and urban population in six regions in Viet Nam: our sample vs. population.
Table A4.
Share of rural and urban population in six regions in Viet Nam: our sample vs. population.
| Our Sample | GSO 2014 | |||
|---|---|---|---|---|
| Rural | Urban | Rural | Urban | |
| Northern Highland and Midland | 71% | 29% | 82% | 18% |
| Red River Delta | 70% | 30% | 66% | 34% |
| Northern and Costal Central | 70% | 30% | 72% | 28% |
| Highland | 70% | 30% | 69% | 31% |
| South East | 70% | 30% | 37% | 63% |
| Mekong Delta | 70% | 30% | 75% | 25% |
For the Cambodian sample, the weights are constructed based on income groups (Table A2). We calculate the weights for the Cambodian sample as follows:
where is the share of our sample in income group (5 income groups as above); and is the share of the population (2017 Media index) in income group .
For the Vietnamese sample, we construct the weights based on: (i) income group in rural and urban areas (Table A3) and (ii) the share of rural and urban population in each region (Table A4). More specially, our weights for the Vietnamese sample are calculated as follows:
where is the share of our sample in income group (5 income groups as above) and area ( is either rural or urban); is the share of the population (Nielsen Monitoring data) in income group and area ; is the share of our sample in each region (6 regions as above) and area ; and is the share of the population (following GSO) in each region and area .
Appendix C. Estimates Based on Broader Definition of Saving
Table A5 reports our estimation results for a broader definition of savings that includes not only those who hold savings products (i.e., formal savings) but also those who save in other forms such as keeping money at home, asking some family members to keep money for them, etc. (i.e., informal savings). The dependent variable takes the value one if an individual has any types of savings and zero otherwise. Columns (1)–(3) are the results using the Cambodian sample, while the remaining columns display the results using the Vietnamese sample. We use both the OLS estimator (columns (1) and (3)) and the probit estimator (columns (2) and (4)). Columns (3) and (6) are estimated using the GMM estimator with our conventional instrumental variables. For both countries, we report only the 2nd stage since the 1st stage is similar to the 1st stage reported in Table 8. The estimation results show an increase in the magnitude of the effect of the financial literacy score on the savings decision. A one standard deviation increase in the financial literacy score raises the likelihood of saving by about 12 percentage points among Cambodian respondents and 16 percentage points among Vietnamese respondents, which is twice as large as the effects on formal savings products alone. Similar patterns are also observed when we use the instrumental variable to address the endogeneity of the financial literacy score. Moreover, while the financial literacy score does not have a significant effect on formal savings behavior among Vietnamese respondents, it becomes a significant factor when informal savings are taken into account.
Table A5.
Effects of financial literacy on savings behavior (broad definition), OLS estimators and IV.
Table A5.
Effects of financial literacy on savings behavior (broad definition), OLS estimators and IV.
| Cambodia | Viet Nam | |||||
|---|---|---|---|---|---|---|
| (1) | (2) | (3) | (4) | (5) | (6) | |
| Financial literacy | 0.124 *** | 0.120 *** | 0.426 *** | 0.152 *** | 0.145 *** | 0.221 *** |
| [0.012] | [0.011] | [0.091] | [0.017] | [0.015] | [0.028] | |
| Income (in log) | −0.000 | 0.000 | −0.099 *** | 0.105 *** | 0.113 *** | 0.088 *** |
| [0.019] | [0.017] | [0.038] | [0.027] | [0.024] | [0.023] | |
| With some primary education | 0.015 | −0.000 | 0.204 ** | −0.065 | −0.107 ** | −0.059 |
| [0.048] | [0.060] | [0.095] | [0.040] | [0.043] | [0.037] | |
| With some secondary education | 0.034 | 0.025 | 0.142 * | −0.084 ** | −0.126 *** | −0.093 *** |
| [0.045] | [0.058] | [0.080] | [0.034] | [0.036] | [0.033] | |
| Aged under 30 | 0.038 | −0.001 | −0.013 | −0.063 | −0.057 | −0.049 |
| [0.042] | [0.035] | [0.052] | [0.073] | [0.066] | [0.074] | |
| Aged from 30 to 60 | 0.032 | −0.001 | −0.034 | −0.001 | −0.001 | 0.003 |
| [0.040] | [0.032] | [0.053] | [0.071] | [0.065] | [0.072] | |
| Being a male | 0.029 | 0.034 | 0.007 | −0.077 ** | −0.078 *** | −0.066 ** |
| [0.022] | [0.022] | [0.030] | [0.030] | [0.028] | [0.027] | |
| Self-employed | 0.109 *** | 0.096 *** | −0.063 | 0.030 | 0.011 | 0.029 |
| [0.040] | [0.032] | [0.058] | [0.044] | [0.039] | [0.035] | |
| Salaried employee | 0.098 ** | 0.087 ** | −0.034 | 0.068 * | 0.056 * | 0.057 * |
| [0.041] | [0.037] | [0.062] | [0.036] | [0.032] | [0.032] | |
| Housewife | 0.044 | 0.021 | −0.093 | 0.010 | 0.004 | 0.010 |
| [0.046] | [0.037] | [0.066] | [0.044] | [0.042] | [0.042] | |
| Living in rural area | 0.014 | 0.014 | 0.007 | 0.048 | 0.062 * | 0.068 ** |
| [0.027] | [0.027] | [0.032] | [0.032] | [0.031] | [0.030] | |
| Intercept | 0.734 *** | 1.301 *** | −1.127 *** | −0.639 * | ||
| [0.127] | [0.233] | [0.434] | [0.377] | |||
| Number of observations | 1035 | 1035 | 1035 | 1000 | 1000 | 1000 |
| R-squared | 0.215 | 0.2751 | 0.7807 | 0.2872 | 0.2998 | 0.8068 |
Note: Figures in brackets are standard deviations. ***, **, and * denote coefficients significant at the 1%, 5%, and 10% statistical levels, respectively. The dependent variable is whether the respondent saved or not (either in formal or informal ways). Weighted samples are used for all estimations.
Appendix D. Estimates Based on Combined Samples of Cambodia and Viet Nam
Table A6 and Table A7 present our estimation results for the combined weighted Vietnamese and Cambodian samples, using the OLS estimator and the GMM estimator, respectively. The dependent variables in Appendix D are: financial literacy score (1), financial knowledge score (2), financial behavior score (3), financial attitude score (4), financial inclusion score (5), and savings behavior (6) and (7). The estimation results show that household income, education, and occupational status are the major determinants of the financial literacy score and its components (especially financial knowledge score and financial behavior score). The financial knowledge score is positively and significantly associated with the financial behavior score, but not with the financial attitude score. Males tend to have a higher financial knowledge score but lower financial attitude score than females.
The OLS results in Table A6 show that financial literacy is positively correlated with financial inclusion and saving behavior. A standard deviation increase in the financial literacy score is associated with an increase in the financial inclusion score of 39 percentage points and in the likelihood of savings of 9 percentage points. Household income, educational level, and, to some extent, occupational statuses are also positively correlated with financial inclusion and savings behavior. While age does not show much correlation with financial literacy score and its components, individuals either under 30 years old or from 30 to 60 years old have somewhat higher financial inclusion and more savings.
Table A6.
Determinants of financial literacy and savings behavior (combined sample), OLS estimator.
| Dependent Variables | (1) | (2) | (3) | (4) | (5) | (6) | (7) |
|---|---|---|---|---|---|---|---|
| Financial Literacy Score | Financial Knowledge Score | Financial Behavior Score | Financial Attitude Score | Financial Inclusion Score | Saving Behavior (OLS) | Saving Behavior (Probit) | |
| Financial literacy | 0.387 *** | 0.085 *** | 0.089 *** | ||||
| [0.023] | [0.010] | [0.011] | |||||
| Financial knowledge | 0.164 *** | −0.012 | |||||
| [0.023] | [0.024] | ||||||
| Income (in log) | 0.294 *** | 0.116 ** | 0.258 *** | 0.105 ** | 0.133 *** | 0.046 *** | 0.050 *** |
| [0.042] | [0.047] | [0.042] | [0.046] | [0.039] | [0.017] | [0.017] | |
| With some primary education | −0.468 *** | −0.351 *** | −0.359 *** | −0.072 | −0.439 *** | −0.148 *** | −0.104 *** |
| [0.082] | [0.098] | [0.084] | [0.092] | [0.090] | [0.041] | [0.032] | |
| With some secondary education | −0.215 *** | −0.133 | −0.231 *** | −0.012 | −0.330 *** | −0.112 *** | −0.064 ** |
| [0.073] | [0.085] | [0.076] | [0.075] | [0.081] | [0.039] | [0.028] | |
| Aged under 30 | 0.147 | 0.149 | −0.016 | 0.065 | 0.037 | −0.102 *** | −0.092 ** |
| [0.096] | [0.094] | [0.103] | [0.091] | [0.082] | [0.034] | [0.036] | |
| Aged from 30 to 60 | 0.220 ** | 0.118 | 0.103 | 0.081 | 0.209 *** | −0.034 | −0.029 |
| [0.092] | [0.089] | [0.099] | [0.088] | [0.079] | [0.034] | [0.035] | |
| Male | 0.030 | 0.061 | 0.019 | −0.090 * | 0.097 ** | 0.003 | −0.003 |
| [0.044] | [0.045] | [0.044] | [0.048] | [0.044] | [0.020] | [0.018] | |
| Self-employed | 0.300 *** | 0.100 | 0.292 *** | 0.086 | 0.010 | −0.023 | −0.020 |
| [0.068] | [0.070] | [0.068] | [0.066] | [0.071] | [0.035] | [0.030] | |
| Salaried employee | 0.185 *** | 0.093 | 0.130* | 0.063 | 0.115 | −0.031 | −0.022 |
| [0.068] | [0.076] | [0.068] | [0.073] | [0.073] | [0.034] | [0.028] | |
| Housewife | 0.253 *** | −0.062 | 0.351 *** | 0.231 *** | −0.253 *** | −0.093 ** | −0.102 *** |
| [0.080] | [0.079] | [0.078] | [0.088] | [0.077] | [0.037] | [0.038] | |
| Living in rural area | −0.193 *** | −0.192 *** | −0.108* | 0.007 | −0.071 | −0.046 * | −0.038 * |
| [0.054] | [0.057] | [0.055] | [0.061] | [0.052] | [0.024] | [0.021] | |
| Viet Nam | −1.854 *** | −0.977 ** | −1.151 *** | −0.847 * | −1.135 *** | −0.469 ** | −0.438 ** |
| [0.445] | [0.490] | [0.441] | [0.481] | [0.428] | [0.188] | [0.182] | |
| Intercept | −1.991 *** | −0.417 | −2.265 *** | −0.200 | −0.666 ** | 0.067 | |
| [0.287] | [0.314] | [0.288] | [0.321] | [0.270] | [0.115] | ||
| N | 2035 | 2035 | 2035 | 2035 | 2035 | 2035 | 2015 |
| R-squared | 0.2355 | 0.1469 | 0.2573 | 0.1444 | 0.3044 | 0.155 | 0.1748 |
Note: Figures in brackets are standard deviations. ***, **, and * denote coefficients significant at the 1%, 5%, and 10% statistical level, respectively. In all estimations, province dummies are controlled for. The weighted sample is used for all estimations.
As before, we attempt to control for endogeneity of the financial literacy score by using the mean financial literacy score at the provincial level. As shown in Table A7, the financial literacy score still has a statistically significant effect on financial inclusion. While the effect of the financial literacy score on narrowly defined savings behavior (i.e., whether the respondents hold any formal savings product) loses its significance after the endogeneity is controlled, the financial literacy score still has a positive effect on our broader definition of savings (i.e., including those who have savings in informal forms). The latter relationship is significant at the 1% level.
The estimation results shown in Table A6 and Table A7 indicate that, after controlling for household income, education, age, occupational status, and other covariates, the coefficients on the “Viet Nam” dummy variable are negative and statistically significant at the 1% level for most equations. This could be attributed to the fact that the financial literacy gap between Cambodia and Viet Nam is rather small, although Viet Nam seems to have higher values in all covariates that determine financial literacy, financial inclusion, and the saving decision. The reasons for this need to be investigated further.
Table A7.
Effects of financial literacy on savings behavior and financial inclusion (combined sample), IV.
Table A7.
Effects of financial literacy on savings behavior and financial inclusion (combined sample), IV.
| (1) | (2) | (3) | (4) | |
|---|---|---|---|---|
| 2nd Stage | 1st Stage | |||
| Financial Inclusion | Formal Savings a | Savings b | ||
| Financial literacy | 0.313 *** | −0.009 | 0.316 *** | |
| [0.101] | [0.042] | [0.045] | ||
| Income (in log) | 0.154 *** | 0.076 *** | −0.007 | 0.293 *** |
| [0.045] | [0.019] | [0.020] | [0.036] | |
| With some primary education | −0.573 *** | −0.194 *** | 0.000 | −0.517 *** |
| [0.083] | [0.035] | [0.037] | [0.070] | |
| With some secondary education | −0.403 *** | −0.127 *** | −0.047 | −0.262 *** |
| [0.067] | [0.028] | [0.030] | [0.066] | |
| Aged under 30 | 0.022 | −0.098 *** | −0.012 | 0.113 |
| [0.084] | [0.035] | [0.038] | [0.088] | |
| Aged from 30 to 60 | 0.219 *** | −0.017 | 0.011 | 0.211 ** |
| [0.083] | [0.035] | [0.037] | [0.084] | |
| Male | 0.104 *** | 0.007 | −0.025 | 0.030 |
| [0.039] | [0.016] | [0.017] | [0.041] | |
| Self-employed | −0.040 | −0.000 | 0.001 | 0.289 *** |
| [0.064] | [0.027] | [0.028] | [0.060] | |
| Salaried employee | 0.089 | −0.015 | 0.029 | 0.171 *** |
| [0.062] | [0.026] | [0.028] | [0.062] | |
| Housewife | −0.264 *** | −0.069 ** | 0.004 | 0.208 *** |
| [0.071] | [0.030] | [0.032] | [0.070] | |
| Living in rural area | −0.018 | −0.038 * | 0.037 | −0.195 *** |
| [0.050] | [0.021] | [0.023] | [0.046] | |
| Viet Nam | −1.727 *** | −0.699 *** | −0.073 | −2.919 *** |
| [0.454] | [0.190] | [0.204] | [0.365] | |
| Regional literacy level (IV) | 0.919 *** | |||
| [0.098] | ||||
| Intercept | −0.504 * | −0.064 | 0.894 *** | −1.498 *** |
| [0.270] | [0.113] | [0.121] | [0.236] | |
| Underidentification test (LM statistic) | 84.111 | |||
| Weak identification test (F statistic) | 87.177 | |||
| N | 2035 | 2035 | 2035 | 2035 |
| R-squared | 0.2509 | 0.2342 | 0.8094 | |
Note: a: Savings is defined based on whether an individual holds any saving product (i.e., formal savings form); b: Savings is defined based on whether an individual has any savings (either in formal savings forms or informal savings forms). Figures in brackets are standard deviations. ***, **, and * denote coefficients significant at the 1%, 5%, and 10% statistical level, respectively. The weighted sample is used for all estimations.
References
- Agnew, Julie, Hazel Bateman, and Susan Thorp. 2013. Financial Literacy and Retirement Planning in Australia. Numeracy 6: 7. [Google Scholar] [CrossRef] [Green Version]
- Bernheim, Douglas. 1995. Do Households Appreciate Their Financial Vulnerabilities? An Analysis of Actions, Perceptions, and Public Policy. In Tax Policy and Economic Growth. Washington: American Council for Capital Formation, pp. 1–30. [Google Scholar]
- Bernheim, Douglas. 1998. Financial Literacy, Education, and Retirement Saving. In Living with Defined Contribution Pensions: Remaking Responsibility for Retirement. Edited by Olivia S. Mitchell and Sylvester J. Schieber. Philadelphia: University of Pennsylvania Press, pp. 38–68. [Google Scholar]
- Bucher-Koenen, Tabea, and Annamaria Lusardi. 2011. Financial Literacy and Retirement Planning in Germany. Journal of Pension Economics & Finance 10: 565–84. [Google Scholar]
- Campbell, John. 2006. Household Finance. Journal of Finance 61: 1553–604. [Google Scholar] [CrossRef]
- Christelis, Dimitris, Tullio Jappelli, and Mario Padula. 2010. Cognitive Abilities and Portfolio Choice. European Economic Review 54: 18–38. [Google Scholar] [CrossRef]
- de Bassa Scheresberg, Carlo. 2013. Financial Literacy and Financial Behavior among Young Adults: Evidence and Implications. Numeracy 6: 5. [Google Scholar] [CrossRef] [Green Version]
- Fernandes, Daniel, John G. Lynch Jr., and Richard G. Netemeyer. 2014. The Effect of Financial Literacy and Financial Education on Downstream Financial Behaviors. Management Science 60: 1861–83. [Google Scholar] [CrossRef]
- Group of Twenty (G20). 2012. G20 Leaders Declaration. Los Cabos, Mexico. June 19. Available online: http://www.g20.utoronto.ca/2012/2012-0619-loscabos.html (accessed on 4 October 2017).
- Hastings, Justine S., Brigitte C. Madrian, and William L. Skimmyhorn. 2013. Financial Literacy, Financial Education, and Economic Outcomes. Annual Review of Economics 2013: 347–73. [Google Scholar] [CrossRef] [PubMed]
- Hilgert, Marianne A., Jeanne M. Hogarth, and Sondra G. Beverly. 2003. Household financial management: The connection between knowledge and behavior. Federal Research Bulletin 89: 309. [Google Scholar]
- Jappelli, Tullio, and Mario Padula. 2013. Investment in Financial Literacy and Saving Decisions. Journal of Banking & Finance 37: 2779–92. [Google Scholar]
- Lusardi, Annamaria, and Olivia S. Mitchell. 2006. Financial Literacy and Planning: Implications for Retirement Wellbeing. Working Paper. Philadelphia, PA, USA: Pension Research Council, University of Pennsylvania. [Google Scholar]
- Lusardi, Annamaria, and Olivia S. Mitchell. 2011. Financial Literacy and Planning: Implications for Retirement Well-Being. In Financial Literacy: Implications for Retirement Security and the Financial Marketplace. Edited by Olivia S. Mitchell and Annamaria Lusardi. Oxford and New York: Oxford University Press, pp. 17–39. [Google Scholar]
- Lusardi, Annamaria, and Olivia S. Mitchell. 2014. The Economic Importance of Financial Literacy: Theory and Evidence. Journal of Economic Literature 52: 5–44. [Google Scholar] [CrossRef] [PubMed]
- Mahdzan, Nurul Shahnaz, and Saleh Tabiani. 2013. The Impact of Financial Literacy on Individual Saving: An Exploratory Study in the Malaysian Context. Transformations in Business and Economics 12: 41–55. [Google Scholar]
- Mandell, Lewis. 2009. The Financial Literacy of Young American Adults: Results of the 2008 National Jump$tart Coalition Survey of High School Seniors and College Students. Washington: Jump$tart Coalition. [Google Scholar]
- Moore, Danna. 2003. Survey of Financial Literacy in Washington State: Knowledge, Behavior, Attitudes, and Experiences. Washington State University Social and Economic Sciences Research Center Technical Report 03-39. Pullman: Washington State University Social and Economic Sciences Research Center. [Google Scholar]
- Murendo, Conrad, and Kingstone Mutsonziwa. 2017. Financial Literacy and Savings Decisions by Adult Financial Consumers in Zimbabwe. International Journal of Consumer Studies 41: 95–103. [Google Scholar] [CrossRef]
- OECD/INFE. 2015a. Guide to Creating Financial Literacy Scores and Financial Inclusion Indicators Using Data from the OECD/INFE 2015 Financial Literacy Survey. Paris: OECD. [Google Scholar]
- OECD/INFE. 2015b. Policy Handbook on National Strategies for Financial Education. Paris: OECD, Available online: http://www.oecd.org/g20/topics/employment-and-social-policy/National-Strategies-Financial-Education-Policy-Handbook.pdf (accessed on 4 October 2017).
- OECD/INFE. 2015c. 2015 OECD/INFE Toolkit for Measuring Financial Literacy and Financial Inclusion. Paris: OECD. [Google Scholar]
- OECD/INFE. 2016. OECD/INFE International Survey of Adult Financial Literacy Competencies. Paris: OECD. [Google Scholar]
- OECD/INFE. 2017. G20/OECD INFE Report on Adult Financial Literacy in G20 Countries. Paris: OECD, Available online: http://www.oecd.org/daf/fin/financial-education/G20-OECD-INFE-report-adult-financial-literacy-in-G20-countries.pdf (accessed on 13 February 2018).
- Stango, Victor, and Jonathan Zinman. 2009. Exponential Growth Bias and Household Finance. Journal of Finance 64: 2807–49. [Google Scholar] [CrossRef]
- van Rooij, Maarten, Annamaria Lusardi, and Rob Alessie. 2011. Financial Literacy and Stock Market Participation. Journal of Financial Economics 101: 449–72. [Google Scholar] [CrossRef]
- Walstad, William B., Ken Rebeck, and Richard A. MacDonald. 2010. The Effects of Financial Education on the Financial Knowledge of High School Students. Journal of Consumer Affairs 44: 336–57. [Google Scholar] [CrossRef]
| 1 | None of the respondents has no primary education in either country. |
| 2 | Housewives may also be viewed as nonworking people, but we still keep them as a separate group because they may play an important role in managing household finance. |
| 3 | The score for savings behavior in this section is identified through questions on whether the respondents hold any types of saving accounts or participate in saving clubs or not (the so-called “formal way to save”). Savings, however, could take many other forms, such as holding cash at home, or in a wallet, building up a balance in a bank account, giving money to a family member to save, buying gold, property, or livestock, etc. We also present the estimation results using a broader definition of savings (i.e., it takes the value of one if an individual either saves in formal ways or informal ways, and zero otherwise) in Appendix D. |
| 4 | In this section and the empirical results section, we use a weighted sample. In Viet Nam, weights are calculated based on the rural-urban population distribution and economic conditions (measured by income per capita) to correct for the underrepresentation of the top 40% income groups and slight underrepresentation of the urban population in our sample (especially in the South East region). In Cambodia, weights are calculated based on economic conditions (measured by income per capita). Please refer to Appendix B for details. |
| 5 | In this paper, we use household income as the independent variable since it is expected to be more related to household financial matters than individual income. |
| 6 | In Viet Nam, those who are aged 30 or over but under 60 tend to save slightly more than the other two age groups when those two groups are combined into the base group in our estimation. But this relationship is significant only at the 10% level (results upon request). |
| 7 | However, the magnitude is only about half of that of the average coefficient for males (0.32) in the OECD’s 30-country sample (OECD/INFE 2016). |
| 8 | As mentioned in Section 3, please refer to Appendix D for the estimation results in which a broader definition of savings is adopted. |
| 9 | We also used an IV probit estimator to address possible endogeneity of the financial literacy score. However, the Wald statistics indicate that the IV estimates are consistent but not efficient, so it is more appropriate to use the probit estimator. |
| 10 | We use GMM methods to estimate the savings behavior. |
Figure 1.
Self-assessment of overall knowledge about financial matters in Cambodia and Viet Nam. Note: A weighted sample is used to draw this figure. Source: Authors’ compilation from survey data.
Figure 1.
Self-assessment of overall knowledge about financial matters in Cambodia and Viet Nam. Note: A weighted sample is used to draw this figure. Source: Authors’ compilation from survey data.

Figure 2.
Proportion of individuals using different saving forms. Note: A weighted sample is used to draw this figure (see Appendix B). Source: Authors’ compilation from survey data.
Figure 2.
Proportion of individuals using different saving forms. Note: A weighted sample is used to draw this figure (see Appendix B). Source: Authors’ compilation from survey data.

Table 1.
Financial literacy and financial inclusion scores in Cambodia and Viet Nam.
| All | Urban Residents | Rural Residents | Women | Men | Aged under 30 | Aged from 30–60 | Aged over 60 | People with Some Tertiary Education | People with Some Secondary Education | People with Some Primary Education and Lower | Below Median | Above Median | |
|---|---|---|---|---|---|---|---|---|---|---|---|---|---|
| Cambodia | |||||||||||||
| Financial knowledge | 3.52 | 3.52 | 3.52 | 3.57 | 3.47 | 3.61 | 3.50 | 3.24 | 4.62 | 3.64 | 3.35 | 3.37 | 3.68 |
| % knowledgeable people | 17% | 23% | 15% | 19% | 16% | 18% | 18% | 13% | 57% | 21% | 11% | 13% | 22% |
| Financial “savvy” behavior | 5.49 | 5.57 | 5.45 | 5.35 | 5.61 | 5.39 | 5.66 | 5.05 | 5.50 | 5.61 | 5.40 | 5.31 | 5.67 |
| Financial attitude | 2.80 | 2.95 | 2.74 | 2.83 | 2.76 | 2.84 | 2.77 | 2.75 | 2.92 | 2.81 | 2.77 | 2.71 | 2.88 |
| Financial literacy | 11.80 | 12.03 | 11.71 | 11.74 | 11.85 | 11.84 | 11.93 | 11.03 | 13.04 | 12.06 | 11.52 | 11.40 | 12.24 |
| Financial inclusion | 1.85 | 2.05 | 1.77 | 1.88 | 1.88 | 1.78 | 2.03 | 1.26 | 2.51 | 2.04 | 1.63 | 1.63 | 2.1 |
| Vietnam | |||||||||||||
| Financial knowledge | 3.96 | 4.35 | 3.73 | 3.89 | 4.05 | 4.06 | 3.94 | 3.52 | 4.15 | 4.15 | 3.66 | 3.90 | 3.99 |
| % knowledgeable people | 36% | 47% | 29% | 35% | 36% | 39% | 34% | 26% | 43% | 40% | 27% | 34% | 36% |
| Financial “savvy” behavior | 5.70 | 6.22 | 5.38 | 5.88 | 5.50 | 5.44 | 5.83 | 5.64 | 6.39 | 5.68 | 5.27 | 4.93 | 5.96 |
| Financial attitude | 3.00 | 3.03 | 2.98 | 3.04 | 2.95 | 2.91 | 3.04 | 2.90 | 3.06 | 3.00 | 2.96 | 2.97 | 3.01 |
| Financial literacy | 12.67 | 13.60 | 12.08 | 12.80 | 12.50 | 12.42 | 12.81 | 12.06 | 13.60 | 12.82 | 11.88 | 11.80 | 12.95 |
| Financial inclusion | 2.55 | 2.82 | 2.38 | 2.42 | 2.70 | 2.50 | 2.58 | 2.41 | 3.43 | 2.45 | 2.02 | 2.21 | 2.66 |
Note: Knowledgeable refers to those answering at least 5 out of 7 questions on financial knowledge correctly. A weighted sample is used to draw this figure. Source: Authors’ compilation from survey data.
Table 2.
Descriptive statistics of explanatory variables.
| Explanatory Variable | Cambodia | Viet Nam |
|---|---|---|
| Weighted Sample | ||
| Monthly household income (in USD, mean and stand. dev.) | 311.0 (193.1) | 414.4 (264.0) |
| With some primary education | 52.8% | 34.1% |
| With some secondary education | 43.2% | 40.7% |
| With at least some tertiary education | 4.1% | 25.2% |
| Aged under 30 (%) | 40.1% | 31.0% |
| Aged from 30 to 60 (%) | 48.9% | 66.0% |
| Aged over 60 (%) | 11.1% | 3.0% |
| Being a male (%) | 52.3% | 46.3% |
| Self-employed (%) | 54.8% | 21.5% |
| Salaried employee (%) | 16.4% | 32.8% |
| Housewife (%) | 16.0% | 15.0% |
| Living in rural area | 72.0% | 61.4% |
Note: Share of total respondents except where noted. Source: Authors.
Table 3.
Determinants of financial literacy score in Cambodia and Viet Nam.
| (1) | (2) | (3) | (4) | |
|---|---|---|---|---|
| Cambodia | Viet Nam | |||
| Income | 0.333 *** | 0.224 *** | ||
| [0.055] | [0.064] | |||
| With some primary education | −0.810 *** | −0.629 *** | −0.525 *** | −0.460 *** |
| [0.179] | [0.172] | [0.100] | [0.100] | |
| With some secondary education | −0.496 *** | −0.370 ** | −0.202 ** | −0.166 ** |
| [0.168] | [0.160] | [0.083] | [0.084] | |
| Aged under 30 | 0.189 | 0.196* | −0.141 | −0.147 |
| [0.121] | [0.118] | [0.153] | [0.150] | |
| Aged from 30 to 60 | 0.254 ** | 0.269 ** | −0.017 | −0.068 |
| [0.114] | [0.110] | [0.148] | [0.144] | |
| Male | 0.085 | 0.074 | −0.043 | −0.046 |
| [0.069] | [0.068] | [0.067] | [0.066] | |
| Self-employed | 0.526 *** | 0.457 *** | 0.231 ** | 0.202 ** |
| [0.112] | [0.111] | [0.093] | [0.092] | |
| Salaried employee | 0.452 *** | 0.358 *** | 0.120 | 0.120 |
| [0.122] | [0.120] | [0.086] | [0.084] | |
| Housewife | 0.407 *** | 0.401 *** | 0.151 | 0.130 |
| [0.135] | [0.131] | [0.125] | [0.120] | |
| Living in rural area | −0.110 | −0.120 | −0.367 *** | −0.288 *** |
| [0.084] | [0.083] | [0.072] | [0.072] | |
| Intercept | 0.375 | −1.553 *** | −0.056 | −3.608 *** |
| [0.281] | [0.418] | [0.344] | [1.014] | |
| No. of observations | 1035 | 1035 | 1000 | 1000 |
| R square | 0.0979 | 0.135 | 0.3325 | 0.3466 |
Note: Figures in brackets are standard deviations. ***, **, and * denote coefficients significant at the 1%, 5%, and 10% statistical levels, respectively. The dependent variable is the financial literacy z-score. Province dummies are included in all estimates. The weighted sample is used in all estimations. Source: Authors’ estimates.
Table 4.
Determinants of financial knowledge, financial behavior and financial attitude scores in Cambodia and Viet Nam.
Table 4.
Determinants of financial knowledge, financial behavior and financial attitude scores in Cambodia and Viet Nam.
| Dependent Variable | (1) | (2) | (3) | (4) | (5) | (6) |
|---|---|---|---|---|---|---|
| Cambodia | Viet Nam | Cambodia | Viet Nam | Cambodia | Viet Nam | |
| Financial Knowledge Score | Financial Behavior Score | Financial Attitude Score | ||||
| Financial knowledge | 0.185 *** | 0.165 *** | −0.044 | 0.027 | ||
| [0.031] | [0.035] | [0.033] | [0.036] | |||
| Income | 0.204 *** | −0.038 | 0.191 *** | 0.389 *** | 0.186 *** | −0.022 |
| [0.057] | [0.075] | [0.053] | [0.061] | [0.057] | [0.073] | |
| With some primary education | −1.067 *** | −0.180 | 0.043 | −0.424 *** | 0.069 | −0.190 |
| [0.170] | [0.122] | [0.168] | [0.100] | [0.175] | [0.121] | |
| With some secondary education | −0.851 *** | 0.038 | 0.164 | −0.224 *** | 0.087 | −0.119 |
| [0.158] | [0.096] | [0.160] | [0.082] | [0.169] | [0.091] | |
| Aged under 30 | 0.075 | 0.234 | 0.134 | −0.456 ** | 0.094 | 0.018 |
| [0.113] | [0.150] | [0.112] | [0.220] | [0.108] | [0.176] | |
| Aged from 30 to 60 | 0.111 | 0.187 | 0.196 * | −0.367 * | 0.018 | 0.155 |
| [0.107] | [0.140] | [0.106] | [0.217] | [0.104] | [0.169] | |
| Being a male | −0.016 | 0.158 ** | 0.126 * | −0.237 *** | −0.098 | 0.029 |
| [0.069] | [0.071] | [0.065] | [0.066] | [0.067] | [0.079] | |
| Self-employed | 0.149 | 0.085 | 0.411 *** | 0.163 * | 0.132 | 0.115 |
| [0.116] | [0.096] | [0.105] | [0.091] | [0.098] | [0.095] | |
| Salaried employee | 0.083 | 0.122 | 0.267 ** | 0.092 | 0.265 ** | −0.046 |
| [0.135] | [0.092] | [0.117] | [0.079] | [0.113] | [0.095] | |
| Housewife | 0.019 | 0.002 | 0.514 *** | −0.049 | 0.154 | 0.448 *** |
| [0.140] | [0.113] | [0.117] | [0.113] | [0.117] | [0.151] | |
| Living in rural area | −0.053 | −0.394 *** | −0.079 | −0.086 | −0.045 | 0.047 |
| [0.079] | [0.081] | [0.083] | [0.071] | [0.093] | [0.082] | |
| Intercept | −0.014 | 0.720 | −1.591 *** | −5.482 *** | −1.095 *** | −0.369 |
| [0.443] | [1.213] | [0.407] | [0.990] | [0.421] | [1.195] | |
| N | 1035 | 1000 | 1035 | 1000 | 1035 | 1000 |
| R-squared | 0.087 | 0.2587 | 0.193 | 0.3666 | 0.0847 | 0.2372 |
Note: Figures in brackets are standard deviations. ***, ** and * denote coefficients significant at the 1%, 5%, and 10% statistical levels, respectively. The dependent variable is the financial behavior score converted to a z-score. Province dummies are included in all estimates. The weighted sample is used in all estimations. Source: Authors’ estimates.
Table 5.
Financial literacy and saving behavior in Cambodia and Viet Nam.
| (1) | (2) | (3) | (4) | (5) | (6) | |
|---|---|---|---|---|---|---|
| Cambodia | Viet Nam | |||||
| Financial literacy | 0.072 *** | 0.069 *** | 0.099 *** | 0.106 *** | ||
| [0.012] | [0.011] | [0.018] | [0.018] | |||
| Income | 0.063 *** | 0.039 ** | 0.045 ** | 0.068** | 0.046 | 0.047 |
| [0.017] | [0.017] | [0.018] | [0.033] | [0.032] | [0.031] | |
| With some primary education | −0.220 *** | −0.174 ** | −0.103 ** | −0.183 *** | −0.137 ** | −0.120 ** |
| [0.075] | [0.071] | [0.042] | [0.053] | [0.054] | [0.049] | |
| With some secondary education | −0.143 * | −0.117 * | −0.051 | −0.140 *** | −0.124 ** | −0.103 ** |
| [0.074] | [0.071] | [0.039] | [0.048] | [0.048] | [0.041] | |
| Aged under 30 | −0.056 | −0.070 ** | −0.049 | −0.264** | −0.249 *** | −0.238 *** |
| [0.035] | [0.034] | [0.037] | [0.103] | [0.095] | [0.080] | |
| Aged from 30 to 60 | 0.013 | −0.006 | 0.008 | −0.175* | −0.168 * | −0.151 ** |
| [0.032] | [0.031] | [0.034] | [0.103] | [0.095] | [0.077] | |
| Being a male | 0.043 ** | 0.038 * | 0.033 * | −0.029 | −0.025 | −0.025 |
| [0.021] | [0.021] | [0.019] | [0.039] | [0.038] | [0.035] | |
| Self-employed | −0.004 | −0.036 | −0.050 | 0.045 | 0.025 | 0.033 |
| [0.035] | [0.034] | [0.033] | [0.058] | [0.057] | [0.049] | |
| Salaried employee | 0.065 | 0.039 | 0.006 | −0.046 | −0.058 | −0.042 |
| [0.042] | [0.041] | [0.034] | [0.047] | [0.045] | [0.043] | |
| Housewife | −0.064 * | −0.093 ** | −0.111 *** | −0.103* | −0.115 * | −0.116 * |
| [0.038] | [0.038] | [0.042] | [0.062] | [0.061] | [0.064] | |
| Living in rural area | −0.039 | −0.030 | −0.035 | −0.071* | −0.042 | −0.037 |
| [0.029] | [0.029] | [0.023] | [0.038] | [0.037] | [0.034] | |
| Intercept | 0.006 | 0.118 | −0.668 | −0.310 | ||
| [0.145] | [0.146] | [0.533] | [0.509] | |||
| N | 1035 | 1035 | 1035 | 1000 | 1000 | 1000 |
| R-squared | 0.0827 | 0.1272 | 0.1831 | 0.1204 | 0.1558 | 0.1487 |
Note: Figures in brackets are standard deviations. ***, **, and * denote coefficients significant at the 1%, 5%, and 10% statistical levels, respectively. The dependent variable is whether the respondent has any types of savings. Province dummies are included in all estimates. Columns (3) and (6) display the results (marginal effects) from probit estimators, other columns show linear probability regression results. The weighted sample is used in all estimations. Source: Authors’ estimates.
Table 6.
Effects of financial literacy on decision to save in Cambodia and Viet Nam (IV).
| (1) | (2) | (3) | (4) | |
|---|---|---|---|---|
| Cambodia | Viet Nam | |||
| 2nd Stage | 1st Stage | 2nd Stage | 1st Stage | |
| Financial literacy | 0.158 ** | 0.073 ** | ||
| [0.065] | [0.029] | |||
| Income | 0.010 | 0.333 *** | 0.056 ** | 0.237 *** |
| [0.027] | [0.050] | [0.024] | [0.048] | |
| With some primary education | −0.108 | −0.576 *** | −0.152 *** | −0.416 *** |
| [0.069] | [0.164] | [0.039] | [0.073] | |
| With some secondary education | −0.073 | −0.340 ** | −0.121 *** | −0.140 ** |
| [0.058] | [0.158] | [0.034] | [0.069] | |
| Aged under 30 | −0.089 ** | 0.206 * | −0.266 *** | −0.136 |
| [0.037] | [0.107] | [0.077] | [0.158] | |
| Aged from 30 to 60 | −0.036 | 0.271 *** | −0.178 ** | −0.053 |
| [0.038] | [0.101] | [0.075] | [0.153] | |
| Being a male | 0.030 | 0.069 | −0.020 | −0.050 |
| [0.022] | [0.065] | [0.028] | [0.057] | |
| Self-employed | −0.068 | 0.438 *** | 0.021 | 0.221 *** |
| [0.042] | [0.099] | [0.037] | [0.074] | |
| Salaried employee | 0.011 | 0.342 *** | −0.060 * | 0.130 * |
| [0.045] | [0.113] | [0.033] | [0.067] | |
| Housewife | −0.121 ** | 0.382 *** | −0.111 ** | 0.134 |
| [0.048] | [0.121] | [0.043] | [0.089] | |
| Living in rural area | 0.015 | −0.084 | −0.020 | −0.299 *** |
| [0.023] | [0.068] | [0.031] | [0.058] | |
| Regional literacy level (IV) | 0.867 *** | 0.353 *** | ||
| [0.172] | [0.021] | |||
| Intercept | 0.234 | −1.961 *** | −0.302 | −7.327 *** |
| [0.168] | [0.351] | [0.392] | [0.839] | |
| Underidentification test (LM statistic) | 25.076 | 218.448 | ||
| Weak identification test (F statistic) | 25.401 | 276.152 | ||
| N | 1035 | 1035 | 1000 | 1000 |
| R-squared | 0.1611 | 0.3251 | ||
Note: Figures in brackets are standard deviations. ***, **, and * denote coefficients significant at the 1%, 5%, and 10% statistical levels, respectively. The dependent variable is whether the respondent holds any saving product. The weighted sample is used to estimated. Source: Authors’ estimates.
Table 7.
Effect of financial literacy on types of savings.
| No Saving | Formal Savings Only | Informal Savings Only | Both Formal and Informal Savings | |
|---|---|---|---|---|
| Panel A: Cambodia | ||||
| Financial literacy | −0.124 *** | −0.004 | 0.056 *** | 0.071 *** |
| [0.011] | [0.004] | [0.015] | [0.011] | |
| Income (in log) | −0.002 | 0.004 | −0.029 | 0.027 |
| [0.018] | [0.008] | [0.025] | [0.017] | |
| With some primary education | −0.000 | −0.007 | 0.096 | −0.089 ** |
| [0.064] | [0.024] | [0.077] | [0.040] | |
| With some secondary education | −0.011 | 0.009 | 0.031 | −0.030 |
| [0.063] | [0.022] | [0.073] | [0.037] | |
| Aged under 30 | −0.010 | 0.025 | 0.053 | −0.068 * |
| [0.036] | [0.023] | [0.051] | [0.036] | |
| Aged from 30 to 60 | −0.026 | 0.027 | 0.030 | −0.030 |
| [0.033] | [0.022] | [0.048] | [0.034] | |
| Being a male | −0.031 | 0.003 | −0.015 | 0.044 ** |
| [0.023] | [0.010] | [0.030] | [0.019] | |
| Self-employed | −0.028 | −0.021 | 0.056 | −0.007 |
| [0.032] | [0.014] | [0.046] | [0.034] | |
| Salaried employee | −0.061 | −0.011 | 0.001 | 0.072 ** |
| [0.039] | [0.015] | [0.052] | [0.035] | |
| Housewife | −0.003 | −0.009 | 0.043 | −0.031 |
| [0.039] | [0.018] | [0.056] | [0.043] | |
| Living in rural area | 0.034 | −0.009 | −0.061 * | 0.035 * |
| [0.026] | [0.009] | [0.032] | [0.021] | |
| Number of observations | 1035 | 1035 | 1035 | 1035 |
| Panel B: Viet Nam | ||||
| Financial literacy | −0.168 *** | −0.003 | 0.065 *** | 0.105 *** |
| [0.014] | [0.010] | [0.020] | [0.017] | |
| Income (in log) | −0.092 *** | 0.025 | 0.061 | 0.006 |
| [0.026] | [0.021] | [0.038] | [0.027] | |
| With some primary education | 0.102 ** | −0.109 *** | 0.107 * | −0.100 ** |
| [0.044] | [0.030] | [0.058] | [0.042] | |
| With some secondary education | 0.119 *** | −0.022 | −0.006 | −0.091 *** |
| [0.037] | [0.029] | [0.050] | [0.035] | |
| Aged under 30 | 0.038 | −0.245 *** | 0.265 ** | −0.059 |
| [0.071] | [0.058] | [0.115] | [0.081] | |
| Aged from 30 to 60 | −0.009 | −0.220 *** | 0.253 ** | −0.024 |
| [0.069] | [0.054] | [0.112] | [0.078] | |
| Being a male | 0.074 ** | −0.031 | −0.027 | −0.015 |
| [0.030] | [0.024] | [0.042] | [0.030] | |
| Self-employed | −0.022 | 0.055 | 0.017 | −0.050 |
| [0.041] | [0.035] | [0.057] | [0.044] | |
| Salaried employee | −0.065 ** | 0.038 | 0.091 * | −0.064 * |
| [0.033] | [0.027] | [0.048] | [0.037] | |
| Housewife | −0.015 | 0.039 | 0.008 | −0.031 |
| [0.043] | [0.044] | [0.070] | [0.054] | |
| Living in rural area | −0.052 | −0.017 | 0.079 * | −0.010 |
| [0.034] | [0.025] | [0.045] | [0.030] | |
| Number of observations | 1000 | 1000 | 1000 | 1000 |
Note: Figures in brackets are standard deviations. ***, **, and * denote coefficients significant at the 1%, 5%, and 10% statistical levels, respectively. The dependent variable is categorized as: (i) no savings; (ii) only formal savings; (iii) only informal savings; and (iv) both formal and informal savings. A multinomial probit estimator is used. The weighted sample is used in all estimations. Source: Authors’ estimates.
Table 8.
Financial literacy and financial inclusion in Cambodia and Viet Nam.
| (1) | (2) | (3) | (4) | (5) | (6) | |
|---|---|---|---|---|---|---|
| Cambodia | Viet Nam | |||||
| OLS | IV, 2nd Stage | IV, 1st Stage | OLS | IV, 2nd Stage | IV, 1st Stage | |
| Financial literacy | 0.415 *** | 0.735 *** | 0.344 *** | 0.370 *** | ||
| [0.028] | [0.187] | [0.038] | [0.065] | |||
| Income | 0.158 *** | 0.060 | 0.333 *** | 0.125 * | 0.126 ** | 0.237 *** |
| [0.048] | [0.078] | [0.050] | [0.064] | [0.054] | [0.048] | |
| With some primary education | −0.212 | −0.042 | −0.576 *** | −0.538 *** | −0.626 *** | −0.416 *** |
| [0.148] | [0.197] | [0.164] | [0.118] | [0.085] | [0.073] | |
| With some secondary education | −0.067 | 0.030 | −0.340 ** | −0.452 *** | −0.486 *** | −0.140 ** |
| [0.143] | [0.165] | [0.158] | [0.101] | [0.075] | [0.069] | |
| Aged under 30 | 0.026 | −0.042 | 0.206 * | −0.089 | −0.095 | −0.136 |
| [0.091] | [0.106] | [0.107] | [0.175] | [0.172] | [0.158] | |
| Aged from 30 to 60 | 0.245 *** | 0.165 | 0.271 *** | 0.017 | 0.023 | −0.053 |
| [0.088] | [0.109] | [0.101] | [0.168] | [0.167] | [0.153] | |
| Being a male | 0.068 | 0.029 | 0.069 | 0.193 ** | 0.185 *** | −0.050 |
| [0.058] | [0.062] | [0.065] | [0.079] | [0.062] | [0.057] | |
| Self-employed | 0.231 *** | 0.011 | 0.438 *** | −0.178 | −0.242 *** | 0.221 *** |
| [0.084] | [0.120] | [0.099] | [0.109] | [0.082] | [0.074] | |
| Salaried employee | 0.309 *** | 0.106 | 0.342 *** | 0.024 | −0.007 | 0.130 * |
| [0.101] | [0.128] | [0.113] | [0.097] | [0.073] | [0.067] | |
| Housewife | −0.198 ** | −0.329 ** | 0.382 *** | −0.114 | −0.177 * | 0.134 |
| [0.096] | [0.137] | [0.121] | [0.122] | [0.096] | [0.089] | |
| Living in rural area | −0.168 ** | −0.092 | −0.084 | −0.026 | 0.071 | −0.299 *** |
| [0.074] | [0.067] | [0.068] | [0.076] | [0.069] | [0.058] | |
| Regional literacy level (IV) | 0.867 *** | 0.353 *** | ||||
| [0.172] | [0.021] | |||||
| Intercept | −0.842 ** | −0.319 | −1.961 *** | −2.118 ** | −1.595 * | −7.327 *** |
| [0.378] | [0.480] | [0.351] | [1.044] | [0.870] | [0.839] | |
| Underidentification test (LM stat.) | 25.076 | 218.448 | ||||
| Weak identification test (F stat.) | 25.401 | 276.152 | ||||
| Number of observations | 1035 | 1035 | 1035 | 1000 | 1000 | 1000 |
Note: Figures in brackets are standard deviations. ***, **, and * denote coefficients significant at the 1%, 5%, and 10% statistical levels, respectively. The dependent variable is the financial inclusion converted z-score. OLS stands for ordinary least square estimation; IV stands for instrumental variable estimation. In OLS estimation, province dummies are included in all estimates. The weighted sample is used to estimated. Source: Authors’ estimates.
© 2019 by the authors. Licensee MDPI, Basel, Switzerland. This article is an open access article distributed under the terms and conditions of the Creative Commons Attribution (CC BY) license (http://creativecommons.org/licenses/by/4.0/).
Share and Cite
MDPI and ACS Style
Morgan, P.J.; Trinh, L.Q. Determinants and Impacts of Financial Literacy in Cambodia and Viet Nam. J. Risk Financial Manag. 2019, 12, 19. https://doi.org/10.3390/jrfm12010019
AMA Style
Morgan PJ, Trinh LQ. Determinants and Impacts of Financial Literacy in Cambodia and Viet Nam. Journal of Risk and Financial Management. 2019; 12(1):19. https://doi.org/10.3390/jrfm12010019
Chicago/Turabian StyleMorgan, Peter J., and Long Q. Trinh. 2019. "Determinants and Impacts of Financial Literacy in Cambodia and Viet Nam" Journal of Risk and Financial Management 12, no. 1: 19. https://doi.org/10.3390/jrfm12010019