Article

Diversity and Structure of Parrotfish Assemblages across the Northern Great Barrier Reef

1
Hawaii Institute of Marine Biology, University of Hawaii, Kaneohe, HI 96744, USA
2
Applied Research Laboratory, University of Hawaii, Honolulu, HI 96822, USA
3
The Australian Institute of Marine Science, Crawley, WA 6008, Australia
4
Wildlife Marine, Perth, WA 6020, Australia
5
Marine Science Program, Biodiversity and Conservation Science, Department of Biodiversity, Conservation and Attractions, Kensington, WA 6151, Australia
6
School of Molecular and Life Sciences, Curtin University, Perth, WA 6102, Australia
7
School of Life Sciences, University of Technology Sydney, Sydney, NSW 2007, Australia
8
College of Science and Engineering, James Cook University, Townsville, QLD 4811, Australia
*
Author to whom correspondence should be addressed.
Diversity 2019, 11(1), 14; https://doi.org/10.3390/d11010014
Submission received: 29 December 2018 / Revised: 16 January 2019 / Accepted: 17 January 2019 / Published: 18 January 2019

Abstract

:
The structure and dynamics of coral reef environments vary across a range of spatial scales, with patterns of associated faunal assemblages often reflecting this variability. However, delineating drivers of biological variability in such complex environments has proved challenging. Here, we investigated the assemblage structure and diversity of parrotfishes—a common and ecologically important group—across 6° of latitude on the Northern Great Barrier Reef (GBR), Australia. Parrotfish abundance and biomass were determined from stereo-video surveys across 82 sites spanning 31 reefs and assessed against geographic, biophysical, and management-related factors in a multivariate framework to determine major drivers and associated scales of assemblage structure. Large cross-shelf variation in parrotfish assemblages pervaded along the entire Northern GBR, with distinct assemblages associated with sheltered and exposed reefs. Species abundances and diversity generally decreased with decreasing latitude. The gradient of explicit predator biomass associated with management zoning had no effect on parrotfish assemblage structure, but was positively correlated with parrotfish diversity. Our results highlight the ubiquitous presence of cross-shelf variation, where the greatest differences in parrotfish community composition existed between sheltered (inner and mid shelf) and exposed (outer shelf) reef systems. Prior attempts to explain linkages between parrotfishes and fine-scale biophysical factors have demonstrated parrotfishes as habitat generalists, but recent developments in nutritional ecology suggest that their cross-shelf variation on the GBR is likely reflective of benthic resource distribution and species-specific feeding modes.

1. Introduction

Coral reef environments harbour the greatest diversity of marine teleost species on the planet, with assemblage patterns and species varying tremendously across space [1]. Such natural variation through space or time is reflective of a wide range of factors, including geographic patterns [2,3], changes in the biophysical aspects of the environment [4,5], underlying evolutionary history of reef environments [6], competitive or predatory interactions among species [7], and anthropogenic impacts to biological communities [8,9]. The diverse array of coral reef environments has led to the evolution of a wide variety of highly specialized modes of food acquisition [10], with nutritional ecology of benthic-associated fish species also influencing their assemblage structure. How these potential factors interact to drive fish assemblage structure is complex and not well defined. Prior studies have linked coral reef fish assemblage patterns to reef structural complexity [5,11], wave exposure [12,13,14], depth and water motion [15], reef area [16], and reef geomorphology [17,18]. However, spatial variation in biological patterns cannot be assessed without the consideration of scale. Interpretations of homogeneity versus heterogeneity in complex biological systems are largely dependent on the scale of interpretation [19], and coral reef environments are no exception because of extreme spatial patchiness and hydrodynamic variability occurring at many scales [20] and historical processes at geological time scales [21].
The Great Barrier Reef (GBR) along the northeast coast of Australia is the world’s largest network of contiguous coral reef structures. Biological communities across the GBR show large variation along both a latitudinal gradient—associated with changes in sea surface temperatures and proximity to catchments—and a longitudinal gradient—associated with cross-shelf differences in habitat. For example, broadscale patterns of fish assemblages demonstrate an increase in fish diversity with warmer water temperature associated with a latitudinal gradient [22]. However, cross-shelf variation on the GBR, from the mainland coast to sheltered inner and mid-shelf reef systems to exposed outer shelf reefs, represents some of the starkest examples of biological variation. Fish assemblage structure of mid- and outer-shelf reefs, separated by a distance of only tens of kilometres, have often been found to be highly dissimilar [12,16,23,24,25,26,27,28]. Furthermore, management strategies for the GBR also influence patterns of biological diversity. Contemporary management efforts on the GBR are implemented on an unrivalled scale [29,30], with the Great Barrier Reef Marine Park Authority (GBRMPA) managing anthropogenic impacts through a hierarchical network of management zones. As a result, large differences in biomass of high trophic level species reflect different levels of protection from fishing [29,31], resulting in disparate densities between nearby reefs, not associated with shelf position or latitude. Disentangling these effects requires a hierarchical sampling approach.
Parrotfishes (family Labridae) represent a highly diverse and ubiquitous group common to coral reef ecosystems. They possess the unique capability of modifying the benthic structure of coral reefs by either scraping surfaces or excavating calcareous structure (including live coral; [32]) and by re-distributing sediments within habitats [33]. Large variation in the functional impact of parrotfish assemblages has been demonstrated across the continental shelf of the GBR, associated with changes in species composition among shelf positions [28]. Intraspecific variability in parrotfish life-history traits is also linked to shelf positions [34], and cross-shelf patterns pervade across the entire Northern GBR such that shelf position is the most powerful predictor of body size [35]. Given their presumed influence on benthic substrates, many studies have focused on top-down effects of parrotfish grazing on coral reef environments. However, patterns of demographic variability and abundance patterns in response to benthic disturbance [36,37] have elicited interest in the way habitat variability influences parrotfish assemblages.
In this study we surveyed parrotfish assemblages across the Northern GBR to determine the association and influence of geographic, biophysical, and management-related factors with cross-shelf variation in assemblage structure. We then examined the relative influence of drivers of parrotfish species richness and phylogenetic diversity using a hierarchical mixed-model framework. A unique aspect of this study is the large latitudinal gradient in our survey design, which facilitated examination of the hierarchical influence of environmental factors across over 700 km.

2. Materials and Methods
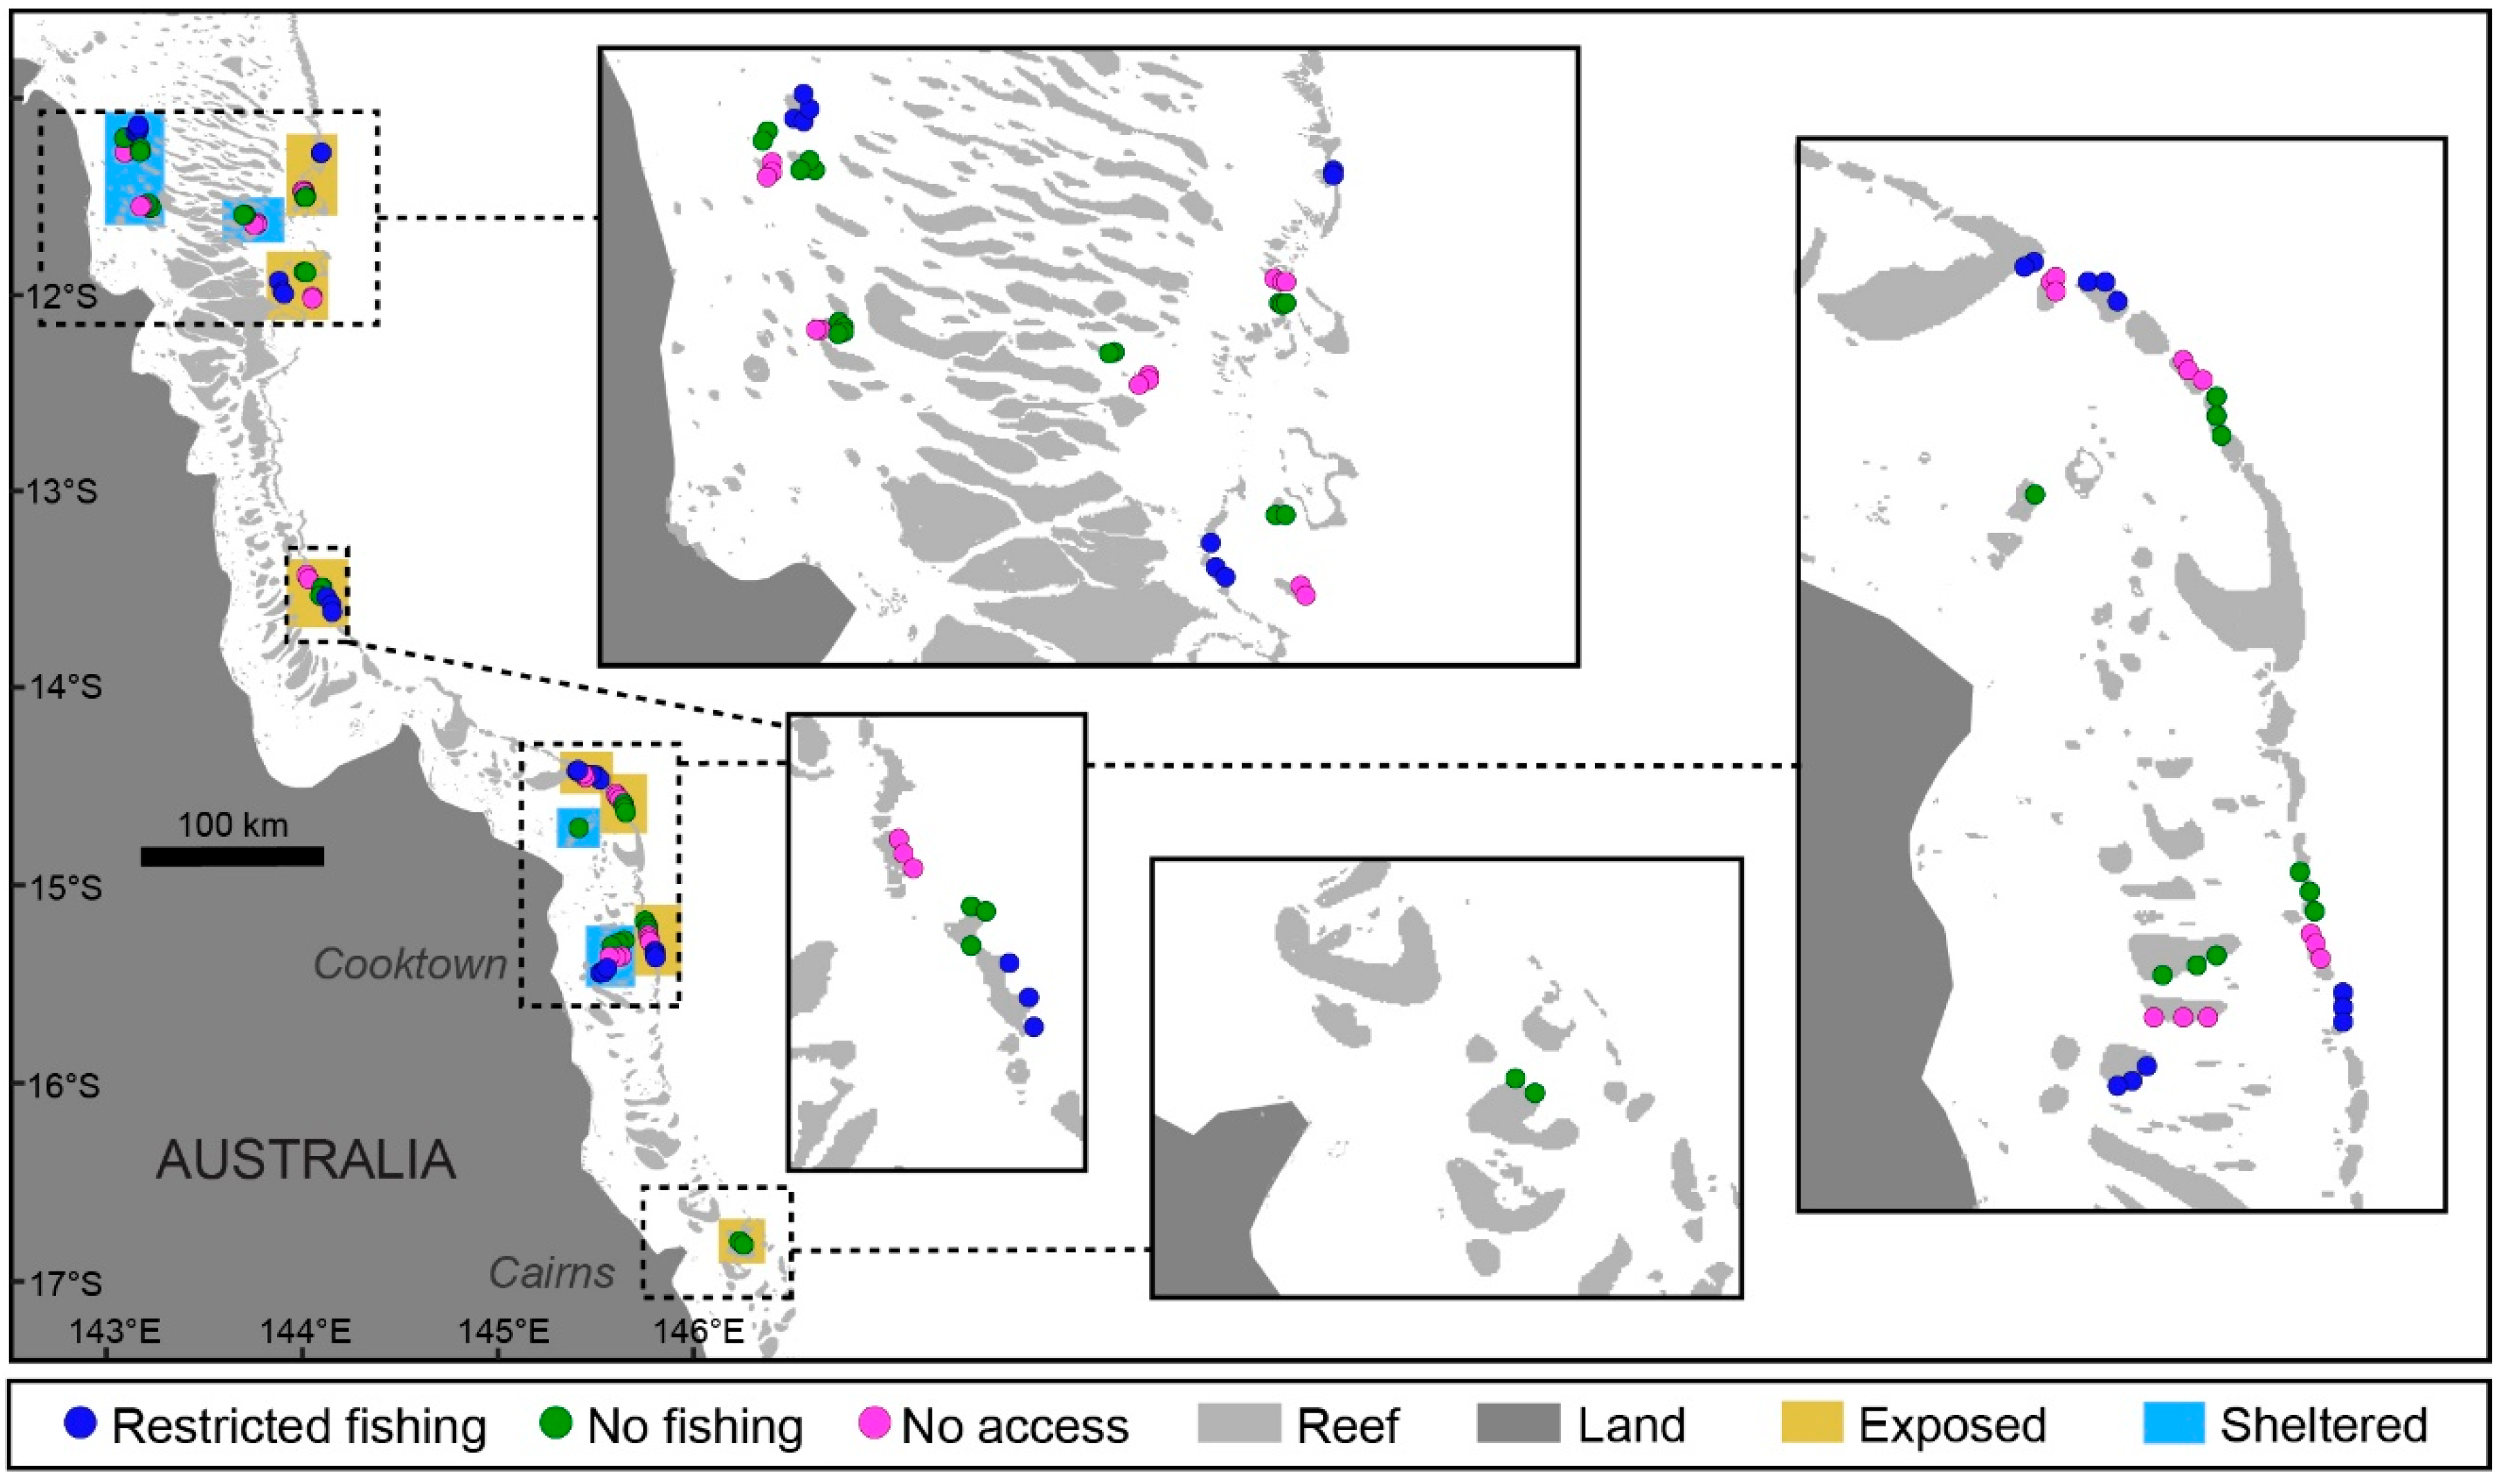
2.1. Study Location

We surveyed parrotfish assemblages, reef habitat, and predatory coral reef fishes at 82 sites across 31 reef structures on the Northern GBR in September 2014, spanning approximately 6° latitude, from adjacent to Bramwel on Cape York Peninsula south to Moore Reef near Cairns (Figure 1). Study sites encompassed a large cross-shelf gradient including 33 sheltered sites (inner and mid shelf reefs) and 49 exposed sites (outer shelf reefs) with a distance from shore ranging from 22.6–123.0 km. Sites were stratified across the GBRMPA zoning scheme, with 23 sites in blue zones (Habitat Protection Zone with limited take), 31 in green zones (Marine National Park Zone with no take), and 28 in pink zones (Preservation Zone with no entry; [38]; Table S1).

2.2. Population Surveys of Study Species

At each site, we conducted a 40-min timed swim at 6–10 m depth while surveying fish and habitat using a diver-operated stereo video system (Stereo DOV). A second diver visually surveyed all sharks, carangids, and other highly mobile predatory species on a 20 m wide transect. A handheld GPS unit, towed by divers in a water-tight buoy, enabled accurate reconstruction of survey distances, with surveys covering an average area of 0.38 hectares (3800 m2) per site. The stereo DOV used two Legria™ underwater video cameras (Canon Inc., Oita, Japan) mounted on a metal bar approximately 0.7 m apart which converged inward approximately 8 degrees. Fishes within 8 m of the front of the camera trajectory and 2.5 m either side were included in the transect for analysis. Each parrotfish within the trajectory was recorded to species and measured to the nearest mm fork length using EventMeasure® Software (SeaGIS Pty Ltd., Bacchus Marsh, Victoria, Australia). All parrotfish with a fork length less than 10 cm were excluded because broad scale visual topography precluded accurate density estimation for fish of this size. The stereo DOV system produced fish length estimates of one order of magnitude greater accuracy (mm vs. cm) than more widely used standard underwater visual census (UVC) techniques [39,40].
We recorded and measured all parrotfish species encountered. Additionally, we recorded all predatory fish species known or suspected to consume smaller-bodied parrotfishes based on an exhaustive literature search of diets and measured length-weight relationships of piscivores encountered during surveys. For each site, the number of parrotfishes surveyed was converted to densities per hectare by dividing the number of individuals per sampling unit by the area of reef surveyed. Length measurements for all individuals (parrotfish and predatory species) encountered were converted to biomass in kilograms based on known length-weight relationships for each species. Biomass of species per site was then converted to total biomass in kilograms per hectare.

2.3. Estimating Reef Structural Properties

We quantified environmental variables from video transects using ten random video frames per site. Variables included reef slope (0–90°; mean of 10 measurements per site), substrate rugosity (1–5 scale; mean of 10 estimates per site), and live coral cover (1–5 scale; mean of 10 estimates per site). For each site, reef slope was measured to the nearest degree (0–90°) using a protractor on randomly chosen still video frames. For both substrate rugosity and coral cover, random video frames were assigned a value of 1 through 5. For coral cover, 1 = 0–10%, 2 = 11–30%, 3 = 31–50%, 4 = 51–75%, and 5 > 75%. For substrate rugosity, 1 = bare habitat, 2 = mostly bare habitat with some low-relief structure, 3 = highly structured but low relief benthic substrate, 4 = highly structured with high relief benthic substrate, and 5 = highly structured high relief benthic substrate with corals/rocks extending over 1 m). Examples of coral cover and rugosity measurements are displayed in Figure S1.
Additional environmental and explanatory variables included predator biomass, geographic position (latitude and longitude), total reef area (ha), and management zone (according to GBRMPA 2003 Zoning Scheme; Supplementary material). Predator biomass represents the mean biomass of all predators (kg/ha) pooled and includes all species that may potentially prey on parrotfishes across later stages in their ontogeny. Total area in hectares of each reef was measured according to values provided from base maps in ArcGIS. Finally, we remotely sensed estimates of sea surface temperature (SST) and chlorophyll-a (Productivity) for each site. Daytime SST values from the NOAA ERDDAP data server, Aqua MODIS observing system at 0.025° resolution were subset to include monthly composite data points from February 2011 to September 2013 for the study domain. Productivity (mg Chl-a m−3) data also from the Aqua MODIS system at 4.6 km2 resolution were aggregated into means for each data point.

2.4. Statistical Analysis

We investigated changes in patterns of parrotfish community structure across the Northern GBR in relation to geographic and biophysical factors, as well as across management regimes, using redundancy analysis (RDA). RDA was performed using the “vegan” package in R version 3.5.1 (R Foundation for Statistical Computing, Vienna, Austria) [41]. Transformation-based RDA includes the ordination of study sites and species constrained by a range of environmental variables [42]. Prior to RDA, all explanatory and response variables were tested for normality, after which predator biomass was natural-log transformed to meet the assumption of normality and heterogeneity of data. Slope, coral cover, and rugosity had approximately-normal distributions thus no transformations were necessary. All numeric factors were centred and scaled to facilitate RDA. Parrotfish abundance and biomass values were Hellinger-transformed to account for the presence of rare species and zero values within the dataset.
Environmental variables were subdivided into three categories to investigate variance partitioning: (1) geographic (latitude, longitude, and shelf position) (2) biophysical (reef slope, substrate rugosity, coral cover, reef area, productivity, and sea surface temperature) and (3) management (management zone and ln [predator biomass]). Prior to RDAs, all explanatory variables were tested for multicollinearity using variance inflation factors, and all variables with values greater than 5 were removed. Latitude and longitude were highly collinear, thus longitude was excluded from all subsequent analysis. Separate RDAs were performed on the abundance and biomass datasets encompassing all 82 sites constrained by explanatory variables. To examine the influence of the three subsets of explanatory variables, we used variance partitioning to assess the shared and independent proportions of variation explained by each subset. The significance level of each subset was assessed using the anova.cca function in R [43] and significance values were corrected for multiple testing using Bonferroni corrections. Adjusted R2 was used to determine the fit of each model. We used a parsimonious forward selection procedure to identify the optimal subset of factors explaining patterns of abundance and biomass across sites. This procedure uses adjusted R2 as the stopping criteria.
Phylogenetic diversity measures for each site were computed using the phylogenetic entropy index [44] from the entropart package in R [45]. We subjected sites scores to separate abundance and biomass weighting. The parrotfish phylogeny of the GBR (Figure S2) was derived from Choat et al. [46] and pruned to reflect our observed species. We fitted linear mixed-effects models to predict the factors that best predicted parrotfish species richness, abundance-weighted and biomass-weighted phylogenetic diversity across the Northern GBR. Original models were applied with all explanatory factors as fixed, with ‘reef’ as a random factor to account for the hierarchical structure of the survey design. Model selection was performed via multi-model averaging [47].

3. Results

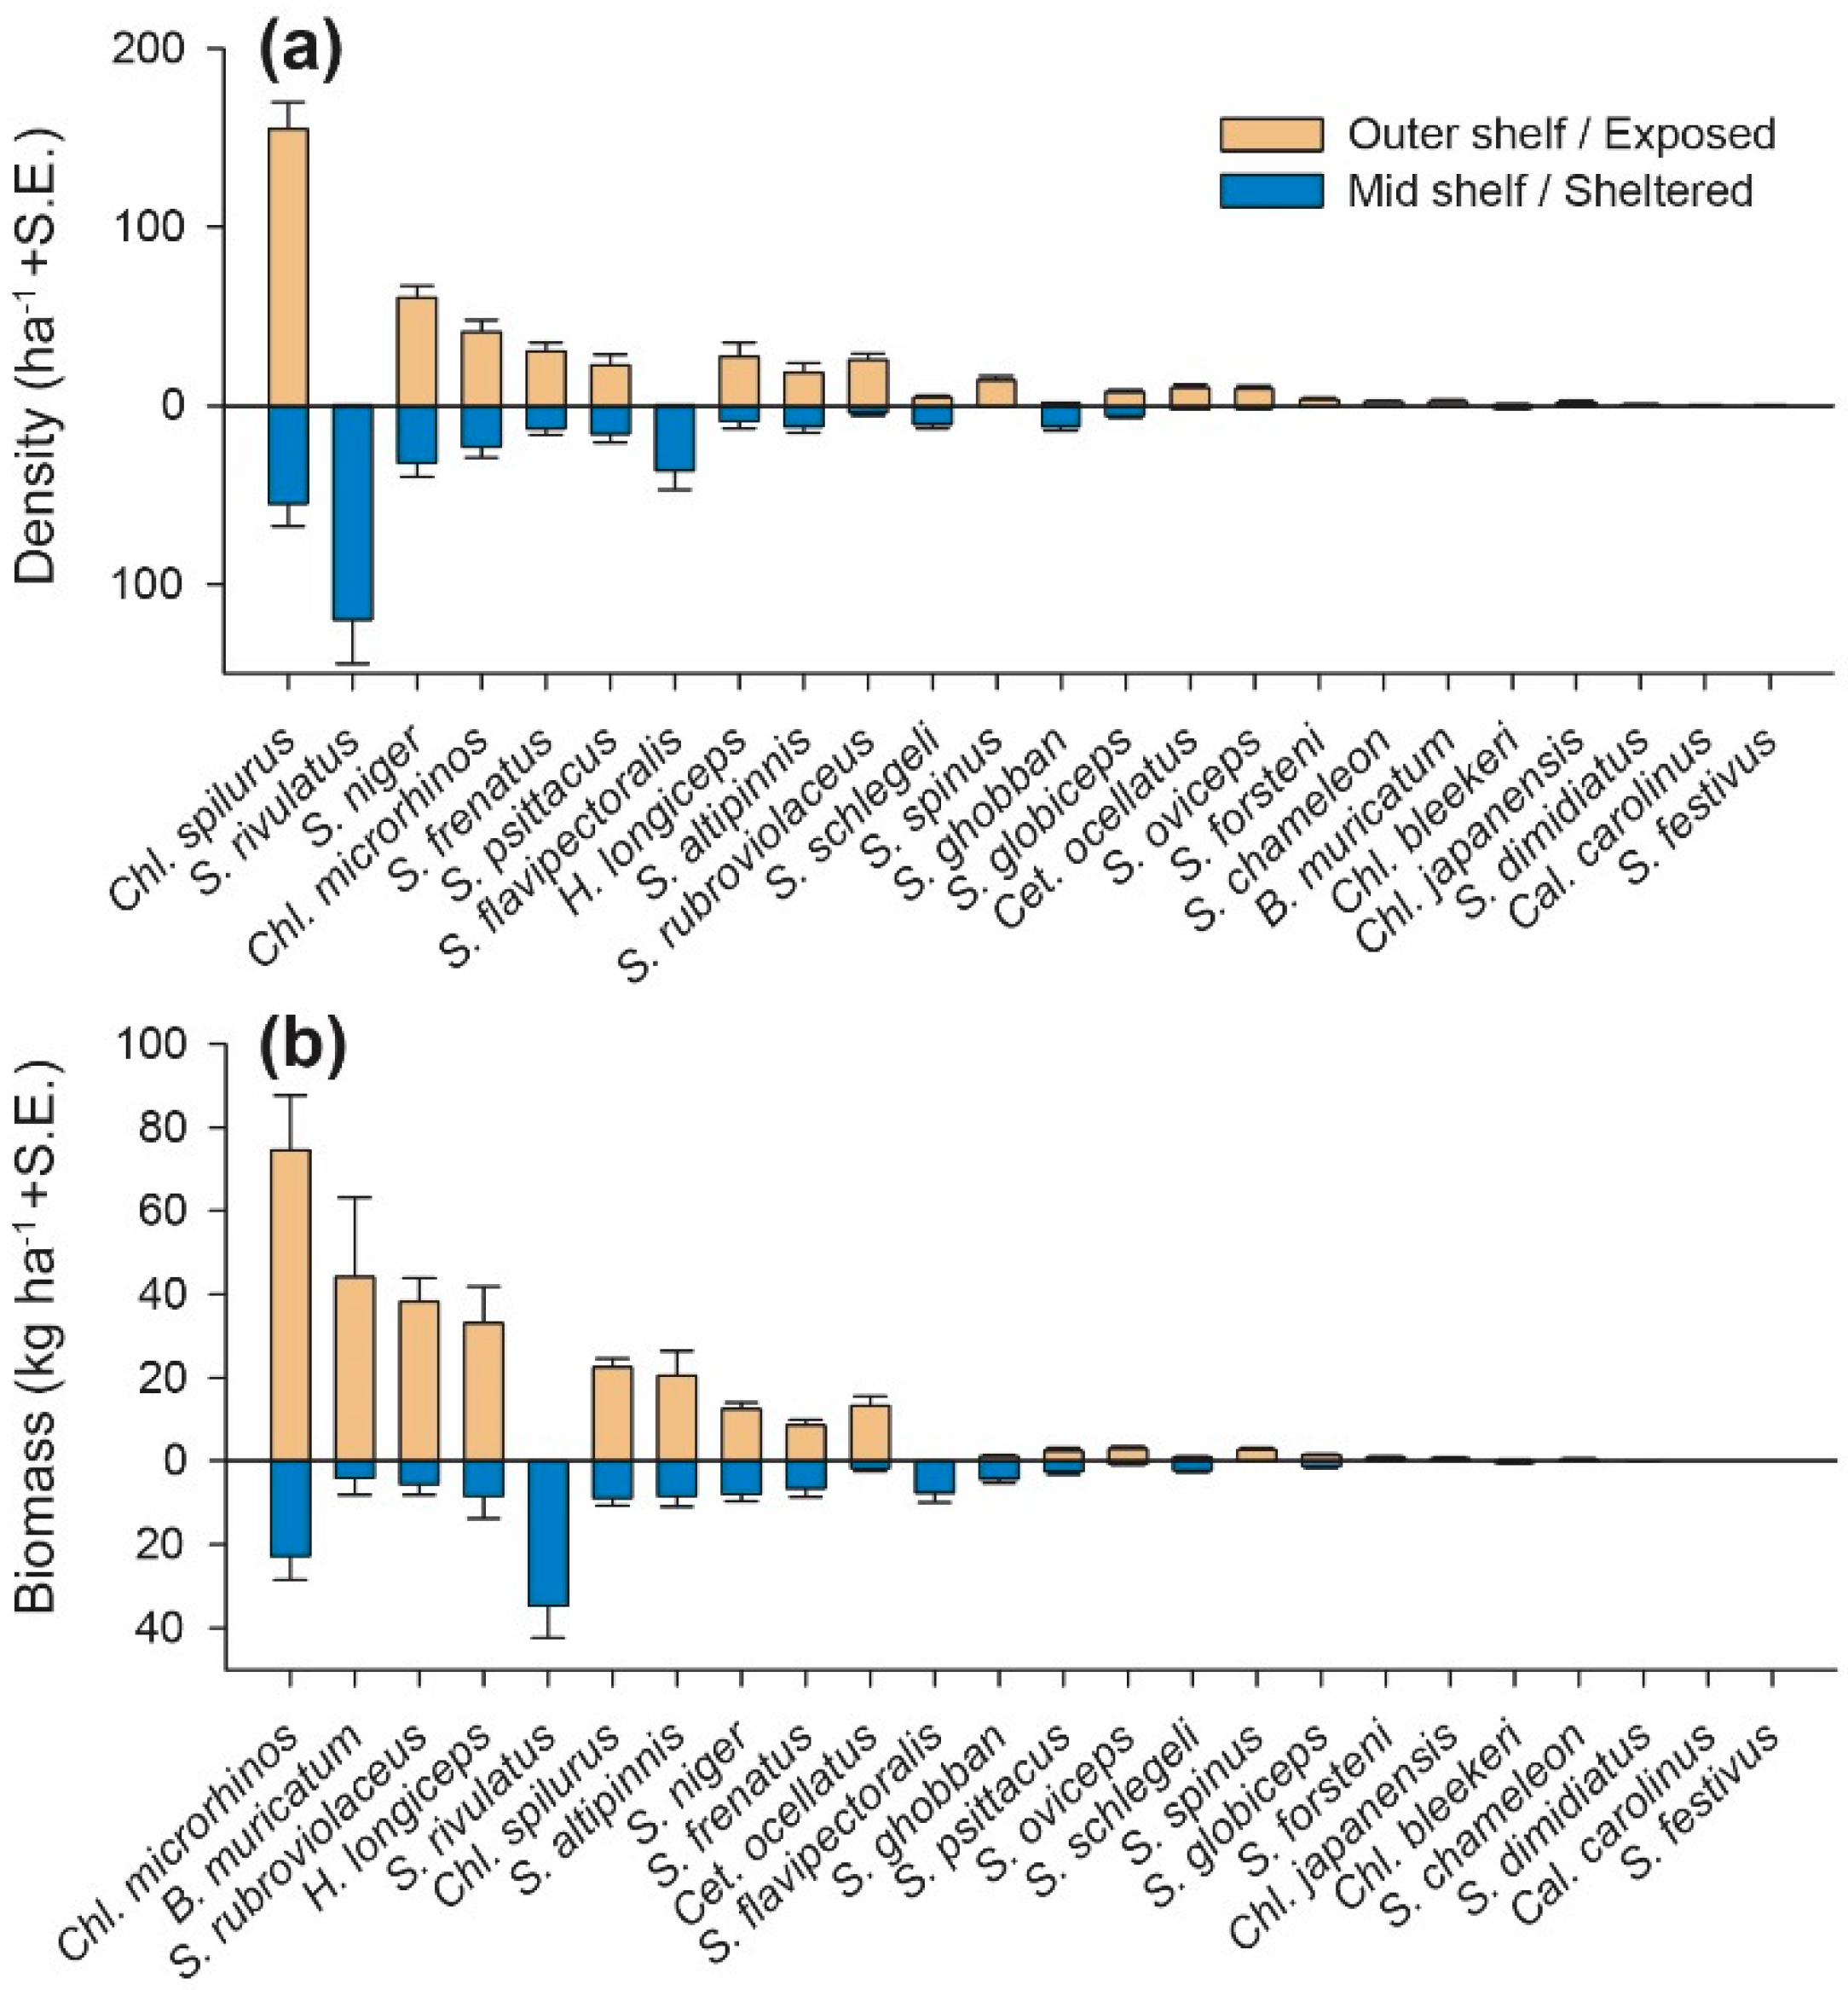
3.1. Abundance and Biomass

A total of 12,177 parrotfishes representing 24 species across six genera were observed (Figure 2). The five most common species were Chlorurus spilurus, Scarus rivulatus, S. niger, C. microrhinos, and S. frenatus. In general, Chlorurus species were more commonly observed at outer shelf reefs whereby a small suite of Scarus species achieved their greatest density at sheltered reefs (Figure 2a). The larger excavating species Bolbometopon muricatum, C. microrhinos, and Cetosarus ocellatus were most abundant at outer shelf reef systems. Large-bodied species, while numerically less abundant, were well-represented in biomass densities, whereby the top five species included C. microrhinos, B. muricatum, S. rubroviolaceus, Hipposcarus longiceps, and S. rivulatus (Figure 2b).
Clear cross-shelf patterns existed in parrotfish species comprising the highest biomass across sites, with large variation in dominant species between reefs across the continental shelf of the GBR. The four species with the highest total biomass were predominantly found on the exposed outer shelf, whereby S. rivulatus was found exclusively on sheltered reef systems. Total parrotfish biomass was more than two-fold on outer shelf reefs than on sheltered reefs, with approximately 282 kg of parrotfish per hectare (kg/ha) for outer shelf sites and approximately 128 kg/ha for sheltered sites.

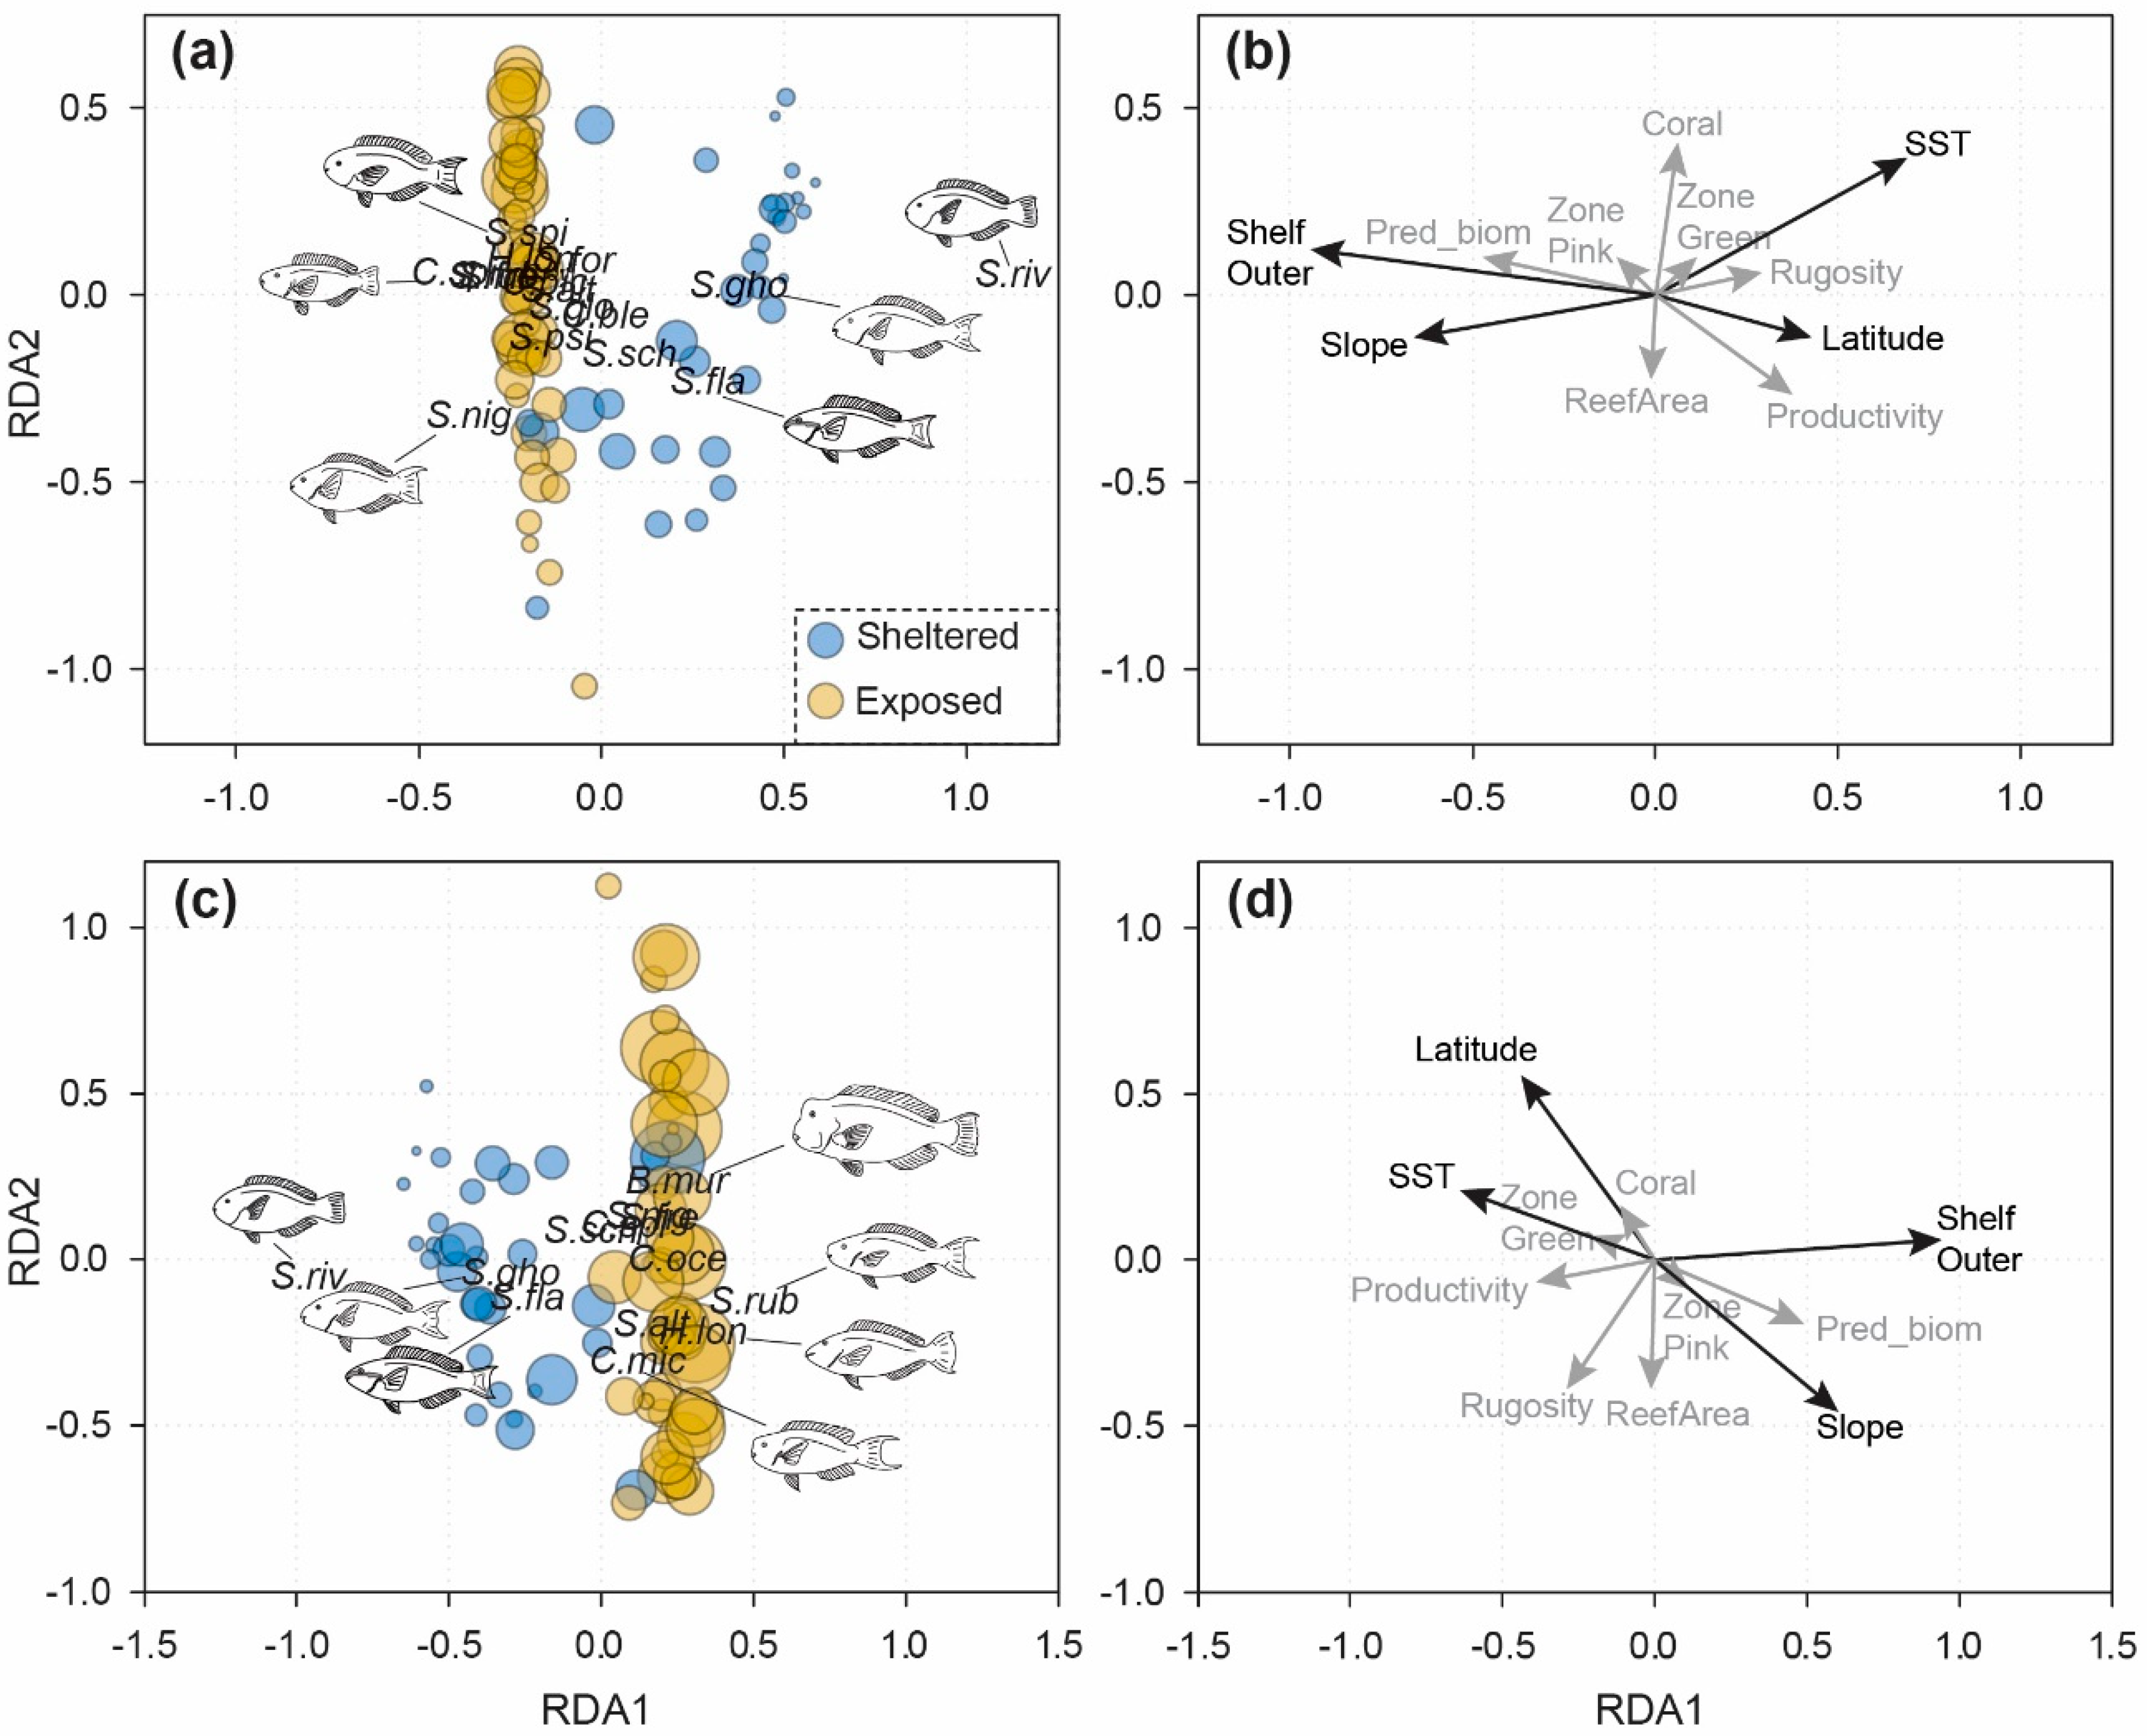
3.2. Cross-Shelf Assemblage Structure

Redundancy analysis (RDA) of parrotfish assemblages based on patterns of abundance returned three significant axes explaining 43.6% of the total variation within the dataset (adjusted R2; Table 1). The first and second axes accounted for 37.9% and 4.7% (unadjusted R2) of the total explained variation. The primary factor separating sites was cross-shelf variation (Figure 3a). Site scores for outer shelf reefs correlated with densities of C. spilurus and S. niger, the two most common species on outer shelf reefs, along the RDA 1 axis. Sites from sheltered shelf positions were most heavily influenced by S. rivulatus, S. flavipectoralis, and S. ghobban. Other factors influencing parrotfish abundance included reef slope, sea surface temperature, and latitude (Figure 3b). These factors were retained in the optimal model, whereby shelf position explained the most variance (Table S2).
Results from the species biomass RDA were similar, although with less overall variance accounted for. The biomass model explained 29.8% of variation (adjusted R2) with the first two axes accounting for 27.5% and 5.5%, respectively (unadjusted R2). Larger-bodied species such as B. muricatum, C. microrhinos, H. longiceps, and S. rubroviolaceus contributed to biomass-weighted patterns of assemblage to a greater extent compared with abundance patterns. These species were all strongly associated with outer shelf sites, whereby S. rivulatus, S. flavipectoralis, and S. ghobban continued to define the assemblages of sheltered reef systems (Figure 3c). Biomass patterns across sites were defined by the same four factors as the abundance data (Figure 3d), with shelf position explaining more than twice the total variance than SST, latitude, or reef slope (Table S2). Assemblage patterns in abundance and biomass were not significantly influenced by coral cover, rugosity, reef area, predator biomass, productivity, or management zone.
The subset of geographic explanatory factors (latitude and shelf position) accounted for the highest explained variance in abundance at 36.9% while it explained 26.0% of the biomass model (Table 1). Biophysical variables (SST, productivity, coral cover, reef area, substrate rugosity, and reef slope) also explained a large portion of variation (34.2% for abundance patterns and 23.7% for biomass patterns), approximately 60% of which was shared with geographic variables (Figure S3). For both models, the independent portions explained for both subsets were highly significant (Table 1), whereby management regimes that yield higher predator biomass apparently had no relation with parrotfish community assemblages. The majority of explained variation was shared amongst variable subsets for both abundance and biomass.

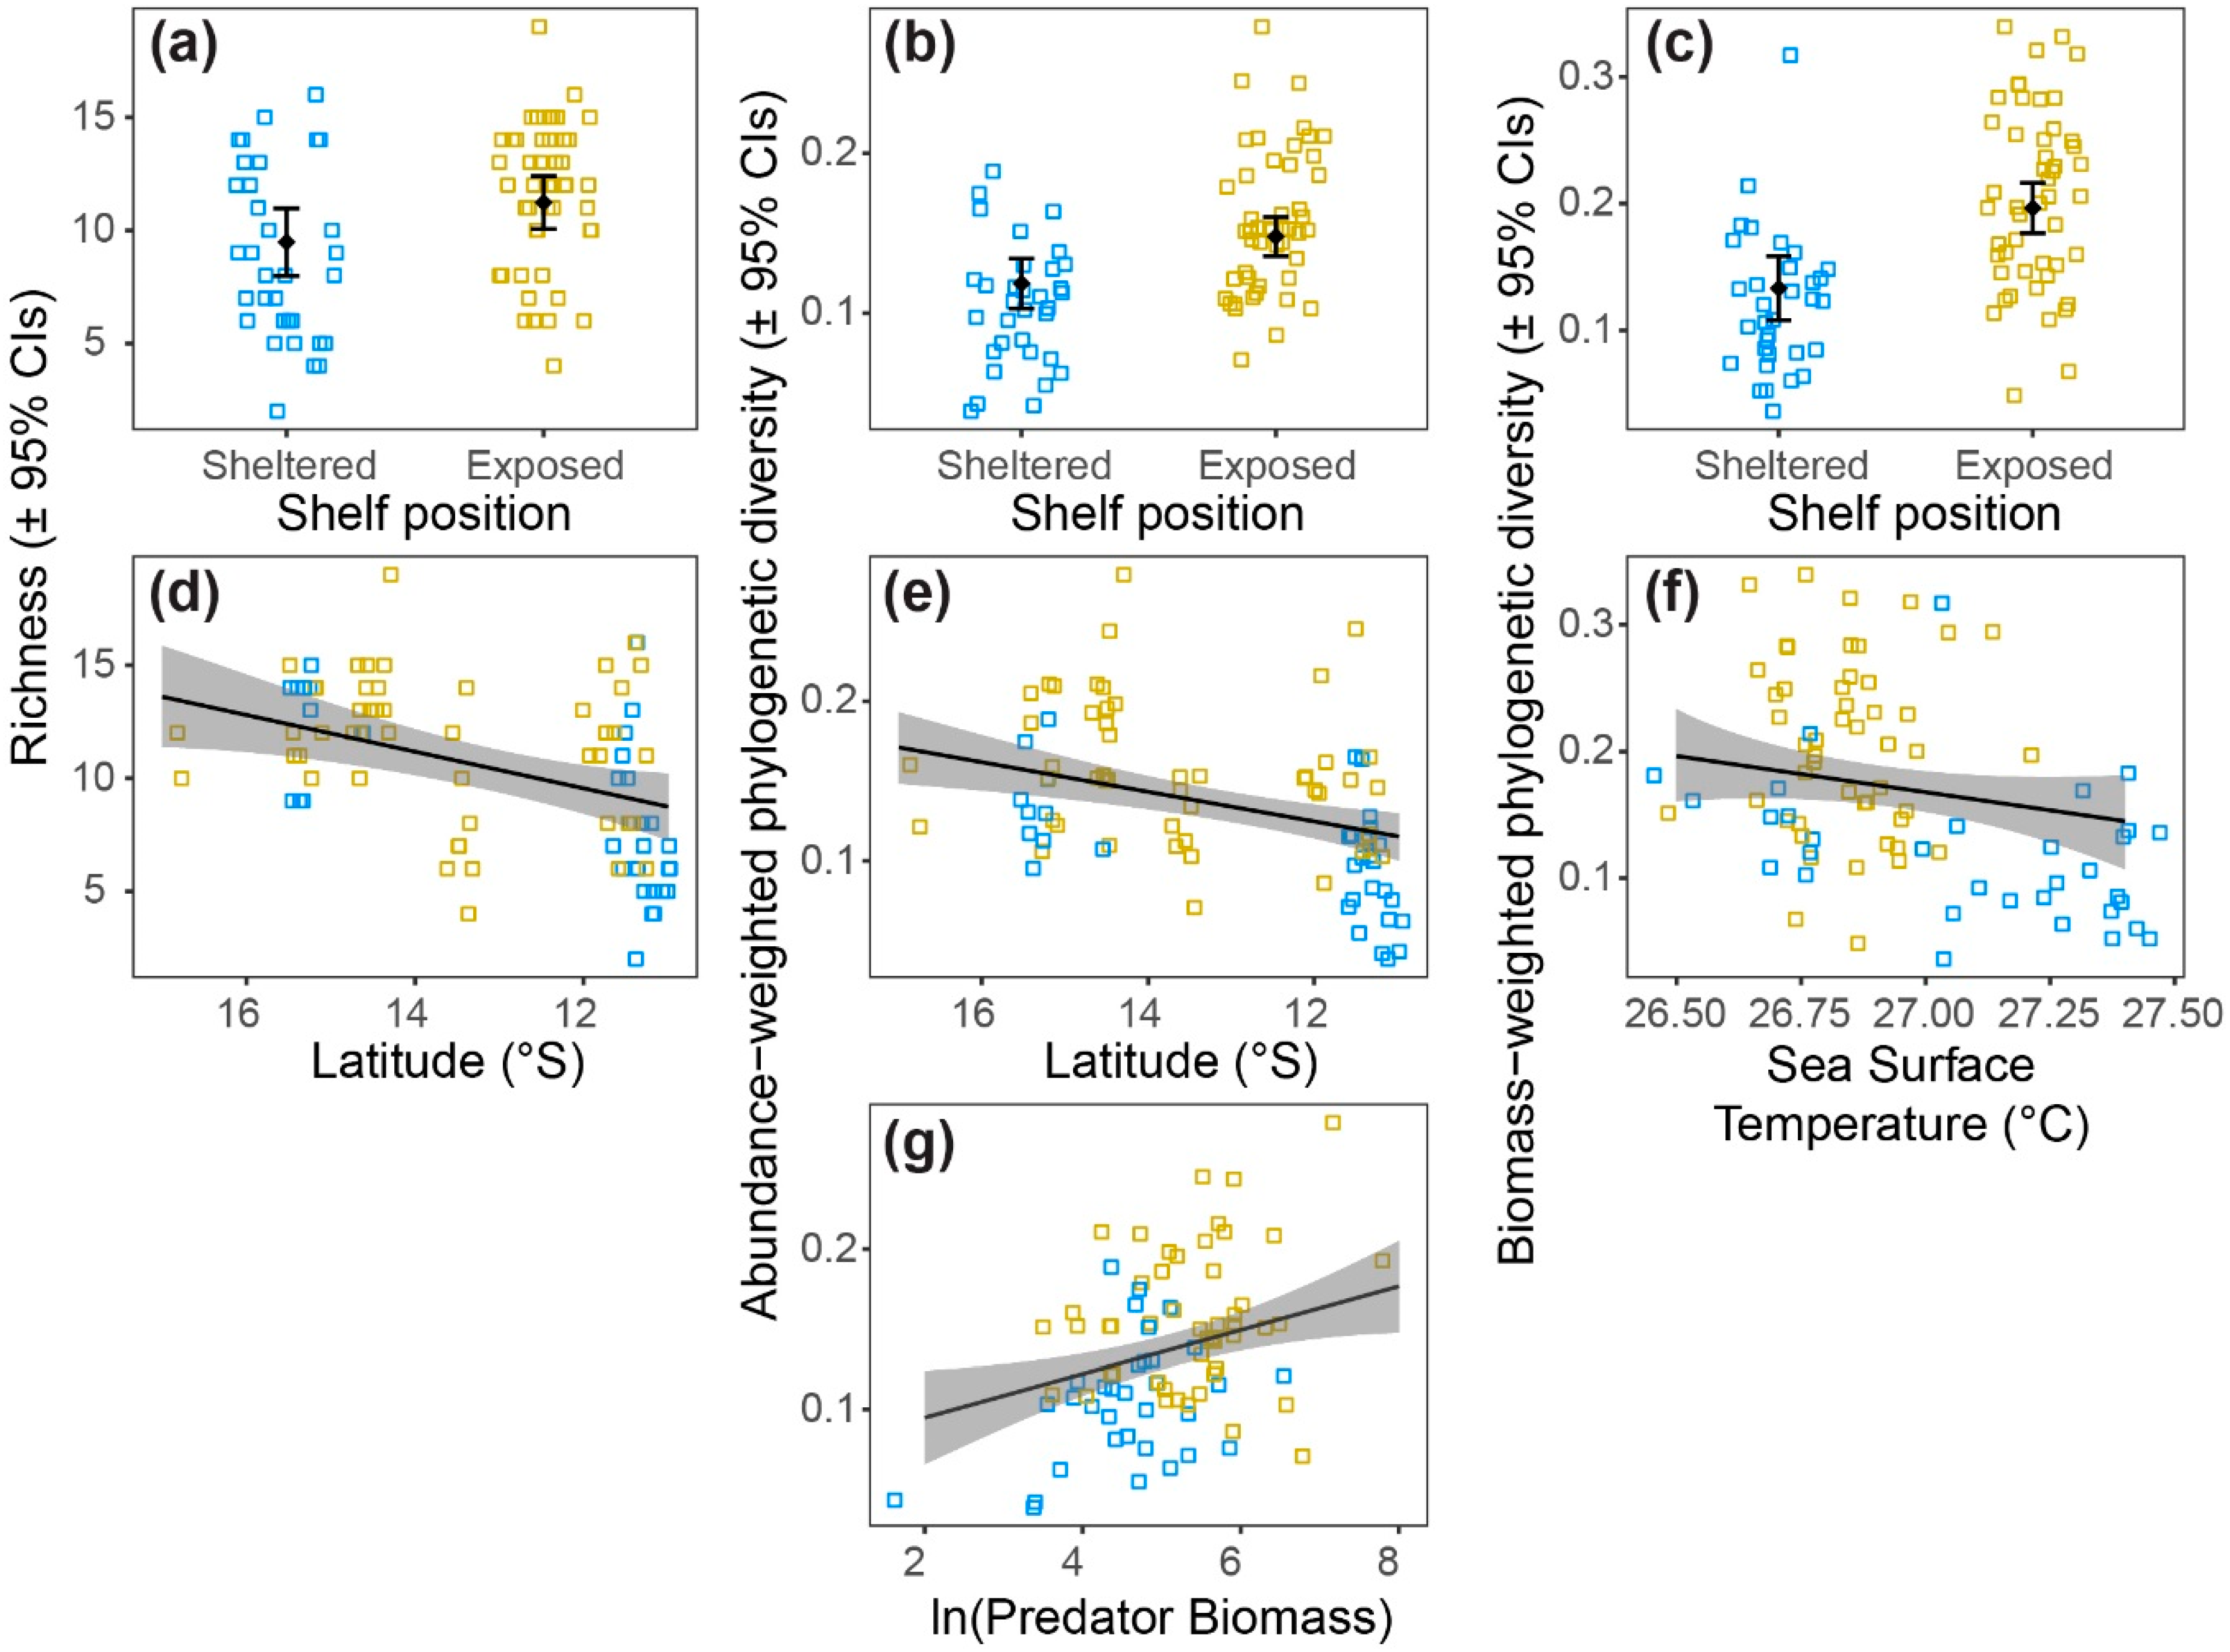
3.3. Patterns of Diversity

As previously demonstrated, patterns of diversity in parrotfish assemblages were largely associated with different shelf positions of the GBR. The optimal models explaining parrotfish species richness, abundance-weighted phylogenetic diversity, and biomass-weighted phylogenetic diversity all included the factors shelf position (Table 2). All three diversity metrics were greater at exposed outer shelf reefs by an average factor of 1.5 (Figure 4a–c). Species richness and abundance-weighted diversity were also positively affected by latitude, whereby increasing latitude yielded greater diversity values (Figure 4d,e). For biomass-weighted diversity, this relationship was best reflected through sea surface temperature (which decreases with increasing latitude; Figure 4f). Finally, predator biomass was a significant predictor of abundance-weighted diversity alone, whereby greater diversity values were associated with higher predator biomass (Figure 4g).

4. Discussion

This study demonstrates significant variation in the composition of parrotfish communities on the Northern GBR. The greatest variation in parrotfish community structure exists between sheltered and exposed reefs, although variability along the latitudinal gradient was also found to be significant. Clear separation of broad parrotfish assemblage patterns, with respect to their abundance and biomass on the continental shelf, are concordant with results of previous studies of parrotfish community structure on the GBR conducted at a variety of spatial scales [12,13,24,25,27,28,48]. This study differed from most others in spatial extent, and in doing so demonstrated that cross-shelf variation pervades along a broad latitudinal gradient, despite changes in assemblage structure and diversity associated with latitude and sea surface temperature. However, much of the explained variance was shared between these factors and smaller-scale biophysical factors. This shared variance is not surprising as neither shelf position nor latitude per se directly influence parrotfish populations. Rather, biophysical features are what define differences among shelf positions or differences along latitudinal gradients. Delineating among these proved challenging though and supports prior conclusions that parrotfishes are habitat generalists whose biomass is only weakly associated with fine-scale characteristics of the reef substrata [13].
Parrotfish densities on outer shelf reefs were 1.25 times those of sheltered reefs, but biomass densities at the exposed outer shelf were more than double. The cross-shelf variation in parrotfish assemblages was largely attributed to ten species. Sheltered reef environments were characterized by the presence of S. rivulatus, S. ghobban, and S. flavipectoralis—species that were almost exclusively found on the sheltered reef environments. Outer shelf reefs were dominated by C. spilurus, S. niger, and S. spinus, as well as a suite of large-bodied species including C. microrhinos, B. muricatum, H. longiceps, and S. rubroviolaceus. Some of these species were also common across sheltered and exposed sites. The species with the most balanced distribution between exposed and sheltered environments were S. psittacus, S. frenatus, and S. globiceps. Parrotfish richness and diversity decreased toward the equator. This reflected a general decrease in abundance and biomass with decreasing latitude for most species, rather than significant patterns of structural changes to species assemblages. Thus, defining features of shelf-specific assemblages were relatively stable along the latitudinal gradient. Cheal et al. [48], who surveyed parrotfishes along the central and southern portions of the GBR, found similar stability across a larger latitudinal gradient, save for range limits in only a few species. Together, these studies cover the full latitudinal extent of the GBR and highlight that cross-shelf differences in parrotfish assemblage composition are much greater than latitudinal differences, implying that assemblages from different shelf positions only tens of kilometres apart will likely differ more than assemblages of the same shelf position separated by >1000 km. Overall, adult populations across the continental shelf strongly reflect spatial patterns of juvenile recruitment [49] and our observations are similar to Hoey and Bellwood [28] which demonstrate that smaller scraping species of the genus Scarus dominate the sheltered reefs whereas a greater number of excavating parrotfishes (Chlorurus and large-bodied Scarus) are prevalent at outer shelf reefs. However, the suggested local relationship between recruitment and adult abundance is not retained in the largest parrotfish B. muricatum, a species for which recruitment is confined to inshore reefs [50] with serious consequences for population maintenance [51].
Finer scale examination of parrotfish assemblage structure demonstrates that patterns of species composition across the continental shelf are largely reflective of wave exposure gradients, both within and across shelf positions [27]. This points to a considerable and underappreciated role of nutritional ecology in driving assemblage diversity across wave exposure gradients. Recent studies have identified parrotfishes as microphages—species that target and ingest epi- and endolithic microbial resources associated with the reef substrata [52,53]. This is in contrast to long-held views of parrotfishes as consumers of algae, a viewpoint that has yielded research questions focused on the top-down effects of parrotfish grazing rather than the influence of habitats and associated substrates on the distribution of parrotfishes (e.g., [48]). Rapid evolutionary diversification of parrotfishes has facilitated highly-specialized morphologies (e.g., C. microrhinos teeth represent one of the hardest biominerals ever measured; [54]) to exploit protein-rich microbial communities existing within and upon calcareous substrates [52]. Previous work on the GBR demonstrates a strong cross-shelf pattern in the detrital, epi- and endolithic microbial communities associated with wave exposure gradients [55,56,57]. Highly exposed environments result in complex patterns of calcareous substratum succession at a variety of scales, punctuated by sporadic disturbance including moderate wave action [55], storm surge, cyclones [58], and coral bleaching [59]. Newly exposed calcareous surfaces on outer shelf environments provide opportunities for the development of microbial assemblages rich in endolithic autotrophs [56,57]. Excavating species, which dominate the exposed outer shelf reefs of the GBR, use their fused beaks to penetrate the hard substrate to exploit this resource. Sheltered reef substrates of the inner and mid shelf are characterized by greater amounts of detritus and epilithic algae, microbes, and cyanobacteria—resources exploited by most parrotfishes but heavily targeted by a smaller suite of scraping species which do not require the same morphological specializations. Scraping parrotfish abundance can be negatively influenced by turbidity [11]; however, this does not seem to be an issue in the sheltered reefs of the GBR. Further clarification of the nutritional ecology of individual species and fine-scale resource distribution patterns following successional changes within and across continental shelf systems will likely facilitate a greater understanding of assemblage dynamics across wave exposure gradients.
Despite a considerable change in biomass of predators across management zones (double the biomass in protected sheltered sites and 1.4 times in protected exposed sites [35]), we found no evidence of predator-driven changes in parrotfish assemblages across space. This is congruent with other studies that have shown little evidence of top-down trophic cascades [60,61] or changes in fish assemblages [62] associated with management zones of the GBR. Prevailing information suggests that predation rates on coral reef fishes are intense for juvenile stages [63], although the large size of many parrotfishes and their bright conspicuous colouration implies that predation on adult stages is low [64]. Further, while biomass of predators varies significantly and expectedly across GBR management zones, the differences are much lower than observed between remote and human-inhabited island systems where considerable patterns in prey assemblages and demography have been linked to predation pressure [8,65]. Predator biomass was, however, significantly and positively related to abundance-weighted parrotfish diversity across sites. We doubt there is any causation in this relationship, but rather may be reflective of environmental variability facilitating greater diversity and biomass of fishes across many trophic levels.

5. Conclusions

Parrotfishes represent one of the most prevalent groups of non-cryptic fishes throughout coral reefs worldwide. They are common across the entire length of the GBR, where changes in assemblages are most strongly linked to variation in environments across the continental shelf. Such cross-shelf variation is concomitant with striking patterns of life-history variation in species [34,35]. However, recent work has demonstrated that parrotfish abundance cycles are enhanced by disturbance to the substratum associated with coral bleaching and cyclones [36], as this creates bare substratum where successional microbial communities establish. Since the present surveys were conducted in 2014, the Northern GBR has experienced two catastrophic and widespread coral bleaching events with a latitudinal pattern of severity [59]. Rapidly changing climate conditions are expected to increase the frequency of bleaching events into the future, thus transforming these environments [66]. Given the scale and magnitude of the 2016/2017 bleaching events, there is little doubt that this has already altered the assemblage patterns of parrotfishes (and other species) reported in this study and others. Future monitoring of coral reef environments has never been more important.

Supplementary Materials

The following are available online at https://www.mdpi.com/1424-2818/11/1/14/s1, Table S1. Zoning regulations of the GBR, Table S2. Optimal redundancy analysis models for parrotfish assemblage structure, Figure S1. Examples of coral cover and rugosity measurements taken from video frames, Figure S2. Parrotfish phylogenetic tree for GBR, Figure S3. Venn diagram demonstrating partitioning of variance.

Author Contributions

Conceptualization: B.M.T., W.D.R., and J.H.C.; data collection: B.M.T. and W.D.R.; video analysis: G.B.J. and B.M.T.; data analysis: G.B.J., B.M.T., and E.C.F.; resources: E.C.F., R.T., and B.B.; writing—original draft preparation: G.B.J.; writing—review and editing: G.B.J., B.M.T., W.D.R., E.C.F., R.T., B.B., and J.H.C.; supervision: B.M.T., E.C.F., R.T., and B.B.; funding acquisition: W.D.R. and B.B.

Funding

This research was funded by the Khaled Bin Sultan Living Oceans Foundation. G.B.J. was supported by NSF grant OCE-15-58852 to B.B.

Acknowledgments

The authors thank P. Chops, C. Huveneers and P. Renaud for field and other assistance and three anonymous reviewers for their comments on the manuscript.

Conflicts of Interest

The authors declare no conflict of interest. The funders had no role in the design of the study; in the collection, analyses, or interpretation of data; in the writing of the manuscript; and in the decision to publish the results.

References

  1. Tittensor, D.P.; Mora, C.; Jetz, W.; Lotze, H.K.; Ricard, D.; Berghe, E.V.; Worm, B. Global patterns and predictors of marine biodiversity across taxa. Nature 2010, 466, 1098–1103. [Google Scholar] [CrossRef] [PubMed]
  2. Mora, C.; Chittaro, P.M.; Sale, P.F.; Kritzer, J.P.; Ludsin, S.A. Patterns and processes in reef fish diversity. Nature 2003, 421, 933–936. [Google Scholar] [CrossRef] [PubMed]
  3. Floeter, S.R.; Guimarães, R.Z.P.; Rocha, L.A.; Ferreira, C.E.; Rangel, C.A.; Gasparini, J.L. Geographic variation in reef-fish assemblages along the Brazilian coast. Glob. Ecol. Biogeogr. 2001, 10, 423–431. [Google Scholar] [CrossRef]
  4. Chong-Seng, K.; Mannering, T.D.; Pratchett, M.S.; Bellwood, D.R.; Graham, N.A.J. The influence of coral reef benthic condition on associated fish assemblages. PLoS ONE 2012, 7, e42167. [Google Scholar] [CrossRef] [PubMed]
  5. Graham, N.A.J.; Nash, K.L. The importance of structural complexity in coral reef ecosystems. Coral Reefs 2013, 32, 315–326. [Google Scholar] [CrossRef]
  6. Bellwood, D.R.; Wainwright, P.C. The history and biogeography of fishes on coral reefs. In Coral Reef Fishes: Dynamics and Diversity in a Complex Ecosystem; Sale, P.F., Ed.; Academic Press: San Diego, CA, USA, 2002; pp. 5–32. ISBN 0-12-615185-7. [Google Scholar]
  7. Hixon, M.A.; Beets, J.P. Predation, prey refuges, and the structure of coral-reef fish assemblages. Ecol. Monogr. 1993, 63, 77–101. [Google Scholar] [CrossRef]
  8. Friedlander, A.M.; DeMartini, E.E. Contrasts in density, size, and biomass of reef fishes between the northwestern and the main Hawaiian islands: The effects of fishing down apex predators. Mar. Ecol. Prog. Ser. 2002, 230, 253–264. [Google Scholar] [CrossRef]
  9. Fabricius, K.; De’ath, G.; McCook, L.; Turak, E.; Williams, D.M. Changes in algal, coral and fish assemblages along water quality gradients on the inshore Great Barrier Reef. Mar. Pollut. Bull. 2005, 51, 384–398. [Google Scholar] [CrossRef]
  10. Clements, K.D.; Raubenheimer, D.; Choat, J.H. Nutritional ecology of marine herbivorous fishes: Ten years on. Funct. Ecol. 2009, 23, 79–92. [Google Scholar] [CrossRef]
  11. Moustaka, M.; Langlois, T.J.; McLean, D.; Bond, T.; Fisher, R.; Fearns, P.; Dorji, P.; Evans, R.D. The effects of suspended sediment on coral reef fish assemblages and feeding guilds of north-west Australia. Coral Reefs 2018, 37, 659–673. [Google Scholar] [CrossRef]
  12. Russ, G. Distribution and abundance of herbivorous grazing fishes in the central Great Barrier Reef. I: Levels of variability across the entire continental shelf. Mar. Ecol. Prog. Ser. 1984, 20, 23–34. [Google Scholar] [CrossRef]
  13. Gust, N. Scarid biomass on the northern Great Barrier Reef: The influence of exposure, depth and substrata. Environ. Biol. Fishes 2002, 64, 353–366. [Google Scholar] [CrossRef]
  14. Taylor, B.M.; Houk, P.; Russ, G.R.; Choat, J.H. Life histories predict vulnerability to overexploitation in parrotfishes. Coral Reefs 2014, 33, 869–878. [Google Scholar] [CrossRef]
  15. McGehee, M.A. Correspondence between assemblages of coral reef fishes and gradients of water motion, depth, and substrate size off Puerto Rico. Mar. Ecol. Prog. Ser. 1994, 105, 243–255. [Google Scholar] [CrossRef]
  16. Williams, D.M.; Hatcher, A.I. Structure of fish communities on outer slopes of inshore, mid-shelf and outer shelf reefs of the Great Barrier Reef. Mar. Ecol. Prog. Ser. 1983, 10, 239–250. [Google Scholar] [CrossRef]
  17. Taylor, B.M.; Lindfield, S.J.; Choat, J.H. Hierarchical and scale-dependent effects of fishing pressure and environment on the structure and size distribution of parrotfish communities. Ecography 2015, 38, 520–530. [Google Scholar] [CrossRef]
  18. Roff, G.; Bejarano, S.; Priest, M.; Marshell, A.; Chollett, I.; Steneck, R.S.; Doropoulos, C.; Golbuu, Y.; Mumby, P.J. Seascapes as drivers of herbivore assemblages in coral reef ecosystems. Ecol. Monogr. 2018. [Google Scholar] [CrossRef]
  19. Wiens, J.A. Spatial scaling in ecology. Funct. Ecol. 1989, 3, 385–397. [Google Scholar] [CrossRef]
  20. Keith, S.A.; Baird, A.H.; Hughes, T.P.; Madin, J.S.; Connolly, S.R. Faunal breaks and species composition of Indo-Pacific corals: The role of plate tectonics, environment and habitat distribution. Proc. R. Soc. B 2013, 280, 20130818. [Google Scholar] [CrossRef]
  21. Sale, P.F. Appropriate spatial scales for studies of reef-fish ecology. Aust. J. Ecol. 1998, 23, 202–208. [Google Scholar] [CrossRef]
  22. Mellin, C.; Bradshaw, C.J.A.; Meekan, M.G.; Caley, M.J. Environmental and spatial predictors of species richness and abundance in coral reef fishes. Glob. Ecol. Biogeogr. 2010, 19, 212–222. [Google Scholar] [CrossRef]
  23. Anderson, G.R.V.; Ehrlich, A.H.; Ehrlich, P.R.; Roughgarden, J.D.; Russell, B.C.; Talbot, F.H. The community structure of coral reef fishes. Am. Nat. 1981, 117, 476–495. [Google Scholar] [CrossRef]
  24. Williams, D.M. Patterns in the distribution of fish communities across the central Great Barrier Reef. Coral Reefs 1982, 1, 35–43. [Google Scholar] [CrossRef]
  25. Russ, G. Distribution and abundance of herbivorous grazing fishes in the central Great Barrier Reef. II: Patterns of zonation of mid-shelf and outershelf reefs. Mar. Ecol. Prog. Ser. 1984, 20, 35–44. [Google Scholar] [CrossRef]
  26. Roberts, C.M.; Shepherd, A.R.D.; Ormond, R.F.G. Large-scale variation in assemblage structure of Red Sea butterflyfishes and angelfishes. J. Biogeogr. 1992, 19, 239–250. [Google Scholar] [CrossRef]
  27. Gust, N.; Choat, J.H.; McCormick, M.I. Spatial variability in reef fish distribution, abundance, size and biomass: A multi scale analysis. Mar. Ecol. Prog. Ser. 2001, 214, 237–251. [Google Scholar] [CrossRef]
  28. Hoey, A.S.; Bellwood, D.R. Cross-shelf variation in the role of parrotfishes on the Great Barrier Reef. Coral Reefs 2008, 27, 37–47. [Google Scholar] [CrossRef]
  29. Russ, G.R.; Cheal, A.J.; Dolman, A.M.; Emslie, M.J.; Evans, R.D.; Miller, I.; Sweatman, H.; Williamson, D.H. Rapid increase in fish numbers follows creation of world’s largest marine reserve network. Curr. Biol. 2008, 18, R514–R515. [Google Scholar] [CrossRef]
  30. McCook, L.J.; Ayling, T.; Cappo, M.; Choat, J.H.; Evans, R.D.; De Freitas, D.M.; Heupel, M.; Hughes, T.P.; Jones, G.P.; Mapstone, B.; et al. Adaptive management of the Great Barrier Reef: A globally significant demonstration of the benefits of networks of marine reserves. Proc. Natl. Acad. Sci. USA 2010, 107, 18278–18285. [Google Scholar] [CrossRef] [PubMed] [Green Version]
  31. Robbins, W.D.; Hisano, M.; Connolly, S.R.; Choat, J.H. Ongoing collapse of coral-reef shark populations. Curr. Biol. 2006, 16, 2314–2319. [Google Scholar] [CrossRef]
  32. Bellwood, D.R.; Choat, J.H. A functional analysis of grazing in parrotfishes (family Scaridae): The ecological implications. Environ. Biol. Fishes 1990, 28, 189–214. [Google Scholar] [CrossRef]
  33. Bellwood, D.R. Direct estimate of bioerosion by two parrotfish species, Chlorurus gibbus and C. sordidus, on the Great Barrier Reef, Australia. Mar. Biol. 1995, 121, 419–429. [Google Scholar] [CrossRef]
  34. Gust, N.; Choat, J.H.; Ackerman, J.L. Demographic plasticity in tropical reef fishes. Mar. Biol. 2002, 140, 1039–1051. [Google Scholar] [CrossRef]
  35. Taylor, B.M.; Brandl, S.J.; Kapur, M.; Robbins, W.D.; Johnson, G.; Huveneers, C.; Renaud, P.; Choat, J.H. Bottom-up processes mediated by social systems drive demographic traits of coral-reef fishes. Ecology 2018, 99, 642–651. [Google Scholar] [CrossRef] [PubMed]
  36. Russ, G.R.; Questel, S.A.; Rizzari, J.R.; Alcala, A.C. The parrotfish-coral relationship: Refuting the ubiquity of a prevailing paradigm. Mar. Biol. 2015, 162, 2029–2045. [Google Scholar] [CrossRef]
  37. Questel, S.L.; Russ, G.R. No-take marine reserve effects on parrotfish and parrotfish-benthos interactions. In The Biology and Ecology of Parrotfishes; Hoey, A.S., Bonaldo, R.M., Eds.; CRC Press: Boca Raton, FL, USA, 2018; pp. 329–354. ISBN 13:978-1-4822-2401-6. [Google Scholar]
  38. Day, J.C. Zoning—Lessons from the Great Barrier Reef Marine Park. Ocean Coast. Manag. 2002, 45, 139–156. [Google Scholar] [CrossRef]
  39. Harvey, E.S.; Goetze, J.; McLaren, B.; Langlois, T.; Shortis, M.R. Influence of range, angle of view, image resolution and image compression on underwater stereo-video measurements: High-definition and broadcast-resolution video cameras compared. Mar. Technol. Soc. J. 2010, 29, 10–22. [Google Scholar] [CrossRef]
  40. Taylor, B.M. Drivers of protogynous sex change differ across spatial scales. Proc. R. Soc. B 2014, 281, 20132423. [Google Scholar] [CrossRef]
  41. Dixon, P. VEGAN, a package of R functions for community ecology. J. Veg. Sci. 2003, 14, 927–930. [Google Scholar] [CrossRef]
  42. van den Wollenberg, A.L. Redundancy analysis: An alternative for canonical correlation analysis. Psychometria 1977, 42, 207–219. [Google Scholar] [CrossRef]
  43. R Core Team. R: A Language and Environment for Statistical Computing; R Foundation for Statistical Computing: Vienna, Austria, 2018; Available online: http://www.R-project.org/ (accessed on 28 December 2018).
  44. Allen, B.; Kon, M.; Bar-Yam, Y. A new phylogenetic diversity measure generalizing the Shannon Index and its application to Phyllostomid Bats. Am. Nat. 2009, 174, 236–243. [Google Scholar] [CrossRef] [PubMed]
  45. Marcon, E.; Hérault, B. entropart: An R package to measure and partition diversity. J. Stat. Softw. 2015, 67, 1–26. [Google Scholar] [CrossRef]
  46. Choat, J.H.; Klanten, O.S.; Van Herwerden, L.; Robertson, D.R.; Clements, K.D. Patterns and processes in the evolutionary history of parrotfishes (Family Labridae). Biol. J. Linn. Soc. 2012, 107, 529–557. [Google Scholar] [CrossRef] [Green Version]
  47. Burnham, K.P.; Anderson, D.R. Model Selection and Multimodel Inference: A Practical Information-Theoretic Approach, 2nd ed.; Springer: New York, NY, USA, 2002; pp. 149–203. ISBN 0-387-95364-7. [Google Scholar]
  48. Cheal, A.; Emslie, M.; Miller, I.; Sweatman, H. The distribution of herbivorous fishes on the Great Barrier Reef. Mar. Biol. 2012, 159, 1143–1154. [Google Scholar] [CrossRef]
  49. Bellwood, D.R.; Choat, J.H. A description of the juvenile phase colour patterns of 24 parrotfish species (family Scaridae) from the Great Barrier Reef, Australia. Rec. Aust. Mus. 1989, 41, 1–41. [Google Scholar] [CrossRef]
  50. Bellwood, D.R.; Choat, J.H. Dangerous demographics: The lack of juvenile humphead parrotfishes Bolbometopon muricatum on the Great Barrier Reef. Coral Reefs 2011, 30, 549–554. [Google Scholar] [CrossRef]
  51. Hamilton, R.J.; Almany, G.R.; Brown, C.J.; Pita, J.; Peterson, N.A.; Choat, J.H. Logging degrades nursery habitat for an iconic coral reef fish. Biol. Conserv. 2017, 210, 273–280. [Google Scholar] [CrossRef]
  52. Clements, K.D.; German, D.P.; Piché, J.; Tribollet, A.; Choat, J.H. Integrating ecological roles and trophic diversification on coral reefs: Multiple lines of evidence identify parrotfishes as microphages. Biol. J. Linn. Soc. 2017, 120, 729–751. [Google Scholar] [CrossRef]
  53. Clements, K.D.; Choat, J.H. Nutritional ecology of parrotfishes (Scarinae, Labridae). In The Biology and Ecology of Parrotfishes; Hoey, A.S., Bonaldo, R.M., Eds.; CRC Press: Boca Raton, FL, USA, 2018; pp. 43–68. ISBN 13:978-1-4822-2401-6. [Google Scholar]
  54. Marcus, M.A.; Amini, S.; Stifler, C.A.; Sun, C.; Tamura, N.; Bechtel, H.A.; Parkinson, D.Y.; Barnard, H.S.; Zhang, X.X.X.; Chua, J.Q.I.; et al. Parrotfish teeth: Stiff biominerals whose microstructure makes them tough and abrasion-resistant to bite stony corals. ACS Nano 2017, 11, 11856–11865. [Google Scholar] [CrossRef]
  55. Crossman, D.J.; Choat, J.H.; Clements, K.D.; Hardy, T.; McConochie, J. Detritus as food for grazing fishes on coral reefs. Limnol. Oceanogr. 2001, 46, 1596–1605. [Google Scholar] [CrossRef] [Green Version]
  56. Tribollet, A.; Golubic, S. Cross-shelf differences in the pattern and pace of bioerosion of experimental carbonate substrates exposed for 3 years on the northern Great Barrier Reef, Australia. Coral Reefs 2005, 24, 422–434. [Google Scholar] [CrossRef]
  57. Tribollet, A. Dissolution of dead corals by euendolithic microorganisms across the northern Great Barrier Reef. Microb. Ecol. 2008, 55, 569–580. [Google Scholar] [CrossRef]
  58. Madin, J.S.; Connolly, S.R. Ecological consequences of major hydrodynamic disturbances on coral reefs. Nature 2006, 444, 477–480. [Google Scholar] [CrossRef] [PubMed]
  59. Hughes, T.P.; Kerry, J.T.; Simpson, T. Large-scale bleaching of corals on the Great Barrier Reef. Ecology 2018, 99, 501. [Google Scholar] [CrossRef] [PubMed]
  60. Rizzari, J.R.; Bergseth, B.J.; Frisch, A.J. Impact of conservation areas on trophic interactions between apex predators and herbivores on coral reefs. Conserv. Biol. 2015, 29, 418–429. [Google Scholar] [CrossRef] [PubMed]
  61. Casey, J.M.; Baird, A.H.; Brandl, S.J.; Hoogenboom, M.O.; Rizzari, J.R.; Frisch, A.J.; Mirbach, C.E.; Connolly, S.R. A test of trophic cascade theory: Fish and benthic assemblages across a predator density gradient on coral reefs. Oecologia 2017, 183, 161–175. [Google Scholar] [CrossRef] [PubMed]
  62. Emslie, M.J.; Logan, M.; Williamson, D.H.; Ayling, A.M.; MacNeil, M.A.; Ceccarelli, D.; Cheal, A.J.; Evans, R.D.; Johns, K.A.; Jonker, M.J.; et al. Expectations and outcomes of reserve network performance following re-zoning of the Great Barrier Reef Marin Park. Curr. Biol. 2015, 25, 983–992. [Google Scholar] [CrossRef]
  63. Almany, G.R. Priority effects in coral reef fish communities of the Great Barrier Reef. Ecology 2004, 85, 2872–2880. [Google Scholar] [CrossRef]
  64. Robbins, W.D.; Renaud, P. Foraging mode of the grey reef shark, Carcharhinus amblyrhynchos, under two different scenarios. Coral Reefs 2016, 35, 253–260. [Google Scholar] [CrossRef]
  65. DeMartini, E.E.; Friedlander, A.M.; Sandin, S.A.; Sala, E. Differences in fish-assemblage structure between fished and unfished atolls in the northern Line Islands, central Pacific. Mar. Ecol. Prog. Ser. 2008, 365, 199–215. [Google Scholar] [CrossRef] [Green Version]
  66. Hughes, T.P.; Kerry, J.T.; Baird, A.H.; Connolly, S.R.; Dietzel, A.; Eakin, C.M.; Heron, S.F.; Hoey, A.S.; Hoogenboom, M.O.; Liu, G.; et al. Global warming transforms coral reef assemblages. Nature 2018, 556, 492–496. [Google Scholar] [CrossRef] [PubMed]
Figure 1. Map of 82 survey sites across the Northern Great Barrier Reef. Sites are colour-coded by management zone (described in key at bottom and Supplementary material) and shaded by exposure regime.
Diversity 11 00014 g001
Figure 2. Mean density (a) and biomass (b) of 24 parrotfish species between sheltered (inner and mid shelf) and exposed (outer shelf) reefs of the Northern Great Barrier Reef. Species are listed in order of descending density (a) and biomass (b), standardized across exposure regimes.
Diversity 11 00014 g002
Figure 3. Redundancy analysis (RDA) explaining patterns of (a) abundance and (c) biomass of parrotfish assemblages across 82 sites and 31 reefs of the Northern Great Barrier Reef, in relation to geographic, biophysical, and reef management factors. Species pictured represent highly influential species delineating assemblage structure. Panels (b) and (d) display vectors of influence for different explanatory factors for plots in (a) and (c), respectively, with bold vectors representing factors retained in optimal models. Sites are visually scaled (bubble sizes) by their abundance-weighted (a) or biomass-weighted (c) phylogenetic diversity.
Diversity 11 00014 g003
Figure 4. Standardized regression coefficients for significant factors in optimal mixed-effects linear models explaining parrotfish species richness (a,d), abundance-weighted phylogenetic diversity (b,e,g), and biomass-weighted phylogenetic diversity (c,f) across 82 sites and 31 reefs of the Northern Great Barrier Reef.
Diversity 11 00014 g004
Table 1. Summary of variance partitioning among explanatory variable subsets for (a) abundance-weighted and (b) biomass-weighted parrotfish assemblage structure across the Northern Great Barrier Reef using redundancy analysis. Significance levels are indicated (*** <0.001, ** <0.01, * <0.05, NS > 0.05).
(a) Abundance
Model or Subset Variance Explained (%)dfFSignificance Level
Global model 43.611,706.7***
Geography(total)36.92,7924.7***
(independent)9.12,706.9**
Biophysical(total)34.26,758.0***
(independent)6.56,702.5**
Management/Predatory(total)7.62,794.3*
(independent)0.53,701.1NS
(b) Biomass
Model or Subset Variance Explained (%)dfFSignificance Level
Global model 29.811,704.1***
Geography(total)26.02,7915.2***
(independent)5.82,704.0**
Biophysical(total)23.76,755.2***
(independent)3.36,701.7**
Management/Predatory(total)6.32,793.7*
(independent)0.43,701.1NS
Table 2. Analysis of variance table for the optimal linear mixed-effects models for (a) species richness, (b) abundance-weighted phylogenetic diversity, and (c) biomass-weighted phylogenetic diversity of parrotfish assemblages across the Northern Great Barrier Reef.
(a) Species richness
VariablenumDFdenDFFPResponse
Intercept150513.5<0.0001
Shelf position1297.30.0116Figure 4a
Latitude1508.80.0046Figure 4d
(b) Abundance-weighted phylogenetic diversity
VariablenumDFdenDFFPResponse
Intercept149854.9<0.0001
Shelf position1297.40.0108Figure 4b
Latitude14920.2<0.0001Figure 4e
Predator biomass14917.90.0001Figure 4g
(c) Biomass-weighted phylogenetic diversity
VariablenumDFdenDFFPResponse
Intercept150576.0<0.0001
Shelf position12917.5<0.0001Figure 4c
Sea surface temp15018.0<0.0001Figure 4f

