Article

Comparative Statistical Mechanics of Muscle and Non-Muscle Contractile Systems: Stationary States of Near-Equilibrium Systems in A Linear Regime

1
Centre de Recherche Clinique, Grand Hôpital de l’Est Francilien, 6–8 Rue Saint Fiacre, 77100 Meaux, France
2
Department of Pharmaceutical Sciences, University of Antwerp, 2610 Wilrijk, Belgium
3
Institut de Cardiologie, Groupe Hospitalier Pitié-Salpêtrière, Assistance Publique-Hôpitaux de Paris, 75004 Paris, France
4
Service de Gynécologie-Obstétrique, Grand Hôpital de l’Est Francilien, 77100 Meaux, France
5
L’Institut du Thorax, INSERM, CNRS, UNIV Nantes, Service de Pneumologie, 44093 Nantes, France
6
Laboratoire de Mathématiques et Applications, UMR CNRS 7348, Université de Poitiers, 86000 Poitiers, France
*
Author to whom correspondence should be addressed.
Entropy 2017, 19(10), 558; https://doi.org/10.3390/e19100558
Submission received: 1 August 2017 / Revised: 30 September 2017 / Accepted: 16 October 2017 / Published: 20 October 2017
(This article belongs to the Special Issue Statistical Mechanics of Complex and Disordered Systems)

Abstract

:
A. Huxley’s equations were used to determine the mechanical properties of muscle myosin II (MII) at the molecular level, as well as the probability of the occurrence of the different stages in the actin–myosin cycle. It was then possible to use the formalism of statistical mechanics with the grand canonical ensemble to calculate numerous thermodynamic parameters such as entropy, internal energy, affinity, thermodynamic flow, thermodynamic force, and entropy production rate. This allows us to compare the thermodynamic parameters of a non-muscle contractile system, such as the normal human placenta, with those of different striated skeletal muscles (soleus and extensor digitalis longus) as well as the heart muscle and smooth muscles (trachea and uterus) in the rat. In the human placental tissues, it was observed that the kinetics of the actin–myosin crossbridges were considerably slow compared with those of smooth and striated muscular systems. The entropy production rate was also particularly low in the human placental tissues, as compared with that observed in smooth and striated muscular systems. This is partly due to the low thermodynamic flow found in the human placental tissues. However, the unitary force of non-muscle myosin (NMII) generated by each crossbridge cycle in the myofibroblasts of the human placental tissues was similar in magnitude to that of MII in the myocytes of both smooth and striated muscle cells. Statistical mechanics represents a powerful tool for studying the thermodynamics of all contractile muscle and non-muscle systems.

1. Introduction

Statistical mechanics represents a powerful tool that can be applied to the study of contractile systems. There are two types of contractile systems: muscle tissues and non-muscle tissues. The first consists of sarcomeric striated muscles (slow and fast skeletal muscles and the heart muscle) and smooth muscles (trachea, uterus, etc.). Their basic contractile cell is the myocyte and the molecular motors are the muscle myosin type II (MII) [1]. The second type of contractile system consists of non-muscle structures whose contractile properties appear most often during pathological states, such as in skin after an injury, during repair and healing processes, and in fibrotic diseases. In a physiological state, the normal human placenta consists of non-muscle contractile tissues [2,3]. The non-muscle basic contractile cell is the myofibroblast [4] and the molecular motor is the non-muscle myosin type II (NMII) [5,6]. The mechanical properties of muscles have been well understood for a number of years, but muscle behavior has attracted far less attention from statistical mechanics. As for non-muscle contractile systems, there has been little study as of yet of either their mechanical properties or their statistical mechanics.
Interestingly, the two types of contractile systems share four fundamental properties: First, stimulation can be induced either by an electric field (in twitch and tetanus modes) or by potassium chloride (KCl). Second, they present the Starling phenomenon. This means that the active force developed by a contractile tissue depends on its initial length and hence on its preload. The longer the initial length, the greater the active developed force. Third, they present a hyperbolic tension–velocity (T–V) relationship. Fourth, they can relax spontaneously. They can also relax either by inhibiting myosin crossbridges (CBs) or by decreasing the intracellular calcium concentration.
Huxley’s equations [7] describe the behavior of CB molecular motors from a phenomenological point of view, in both contractile muscle and non-muscle tissues. The considerable number of CBs involved in muscle and non-muscle contractile systems provides the necessary ground for using statistical mechanics. The probabilities of several elementary steps in the actin–myosin cycle in contractile structures can thus be calculated. The combination of statistical mechanics [8,9] with Huxley’s formalism [7] makes it possible to calculate numerous thermodynamic parameters of the system under study. The grand canonical ensemble is a general methodology and is of great practical interest when statistical mechanics are applied to open complex systems such as living contractile systems that can work either near or far from equilibrium [10,11]. In this study, we compared statistical mechanics in muscle and non-muscle contractile systems. A number of studies from our laboratory on this subject have already been published [12,13,14]. However, for the first time, this study focuses on the differences in statistical mechanics observed between muscle and non-muscle structures. All of the studied contractile tissues behave in a near-equilibrium manner and in a stationary linear regime.

2. Results

The results presented are those obtained from a non-muscle contractile tissue (placenta) and seven muscular contractile tissues: two smooth muscles (uterus and trachea), a slow skeletal muscle (soleus), a rapid skeletal muscle (extensor digitalis longus, EDL), the diaphragm in twitch and tetanus modes, and the heart.

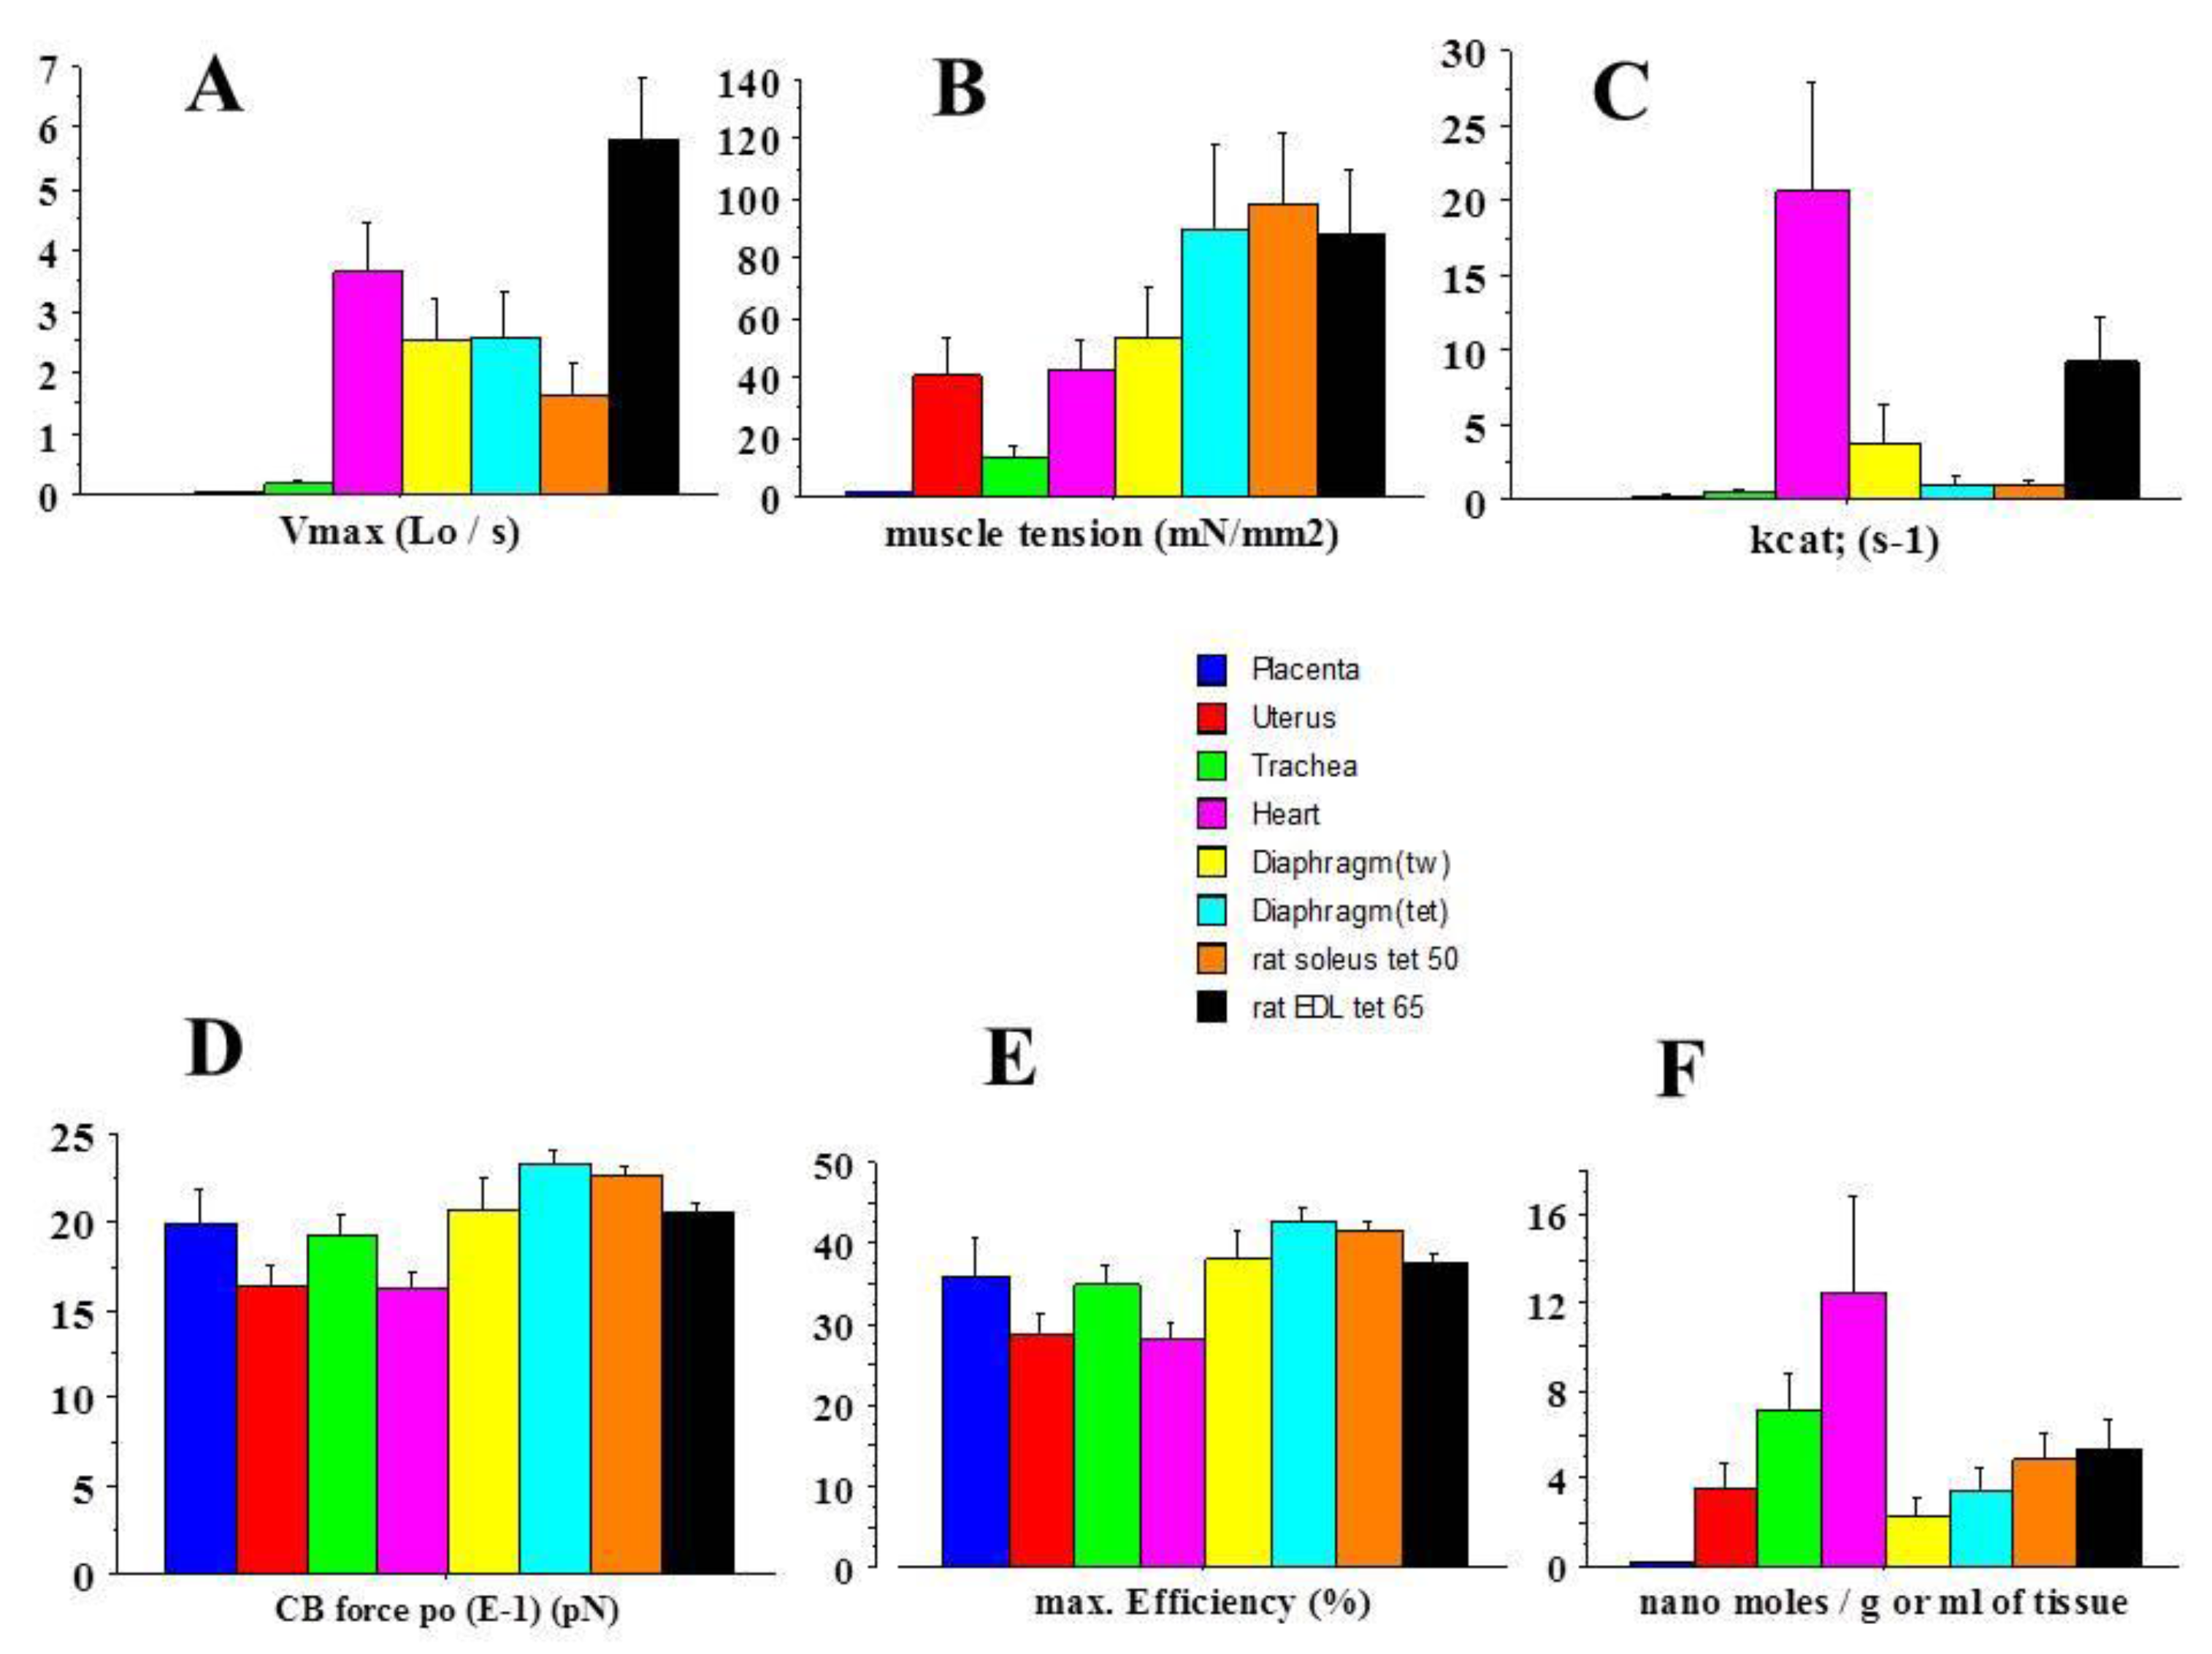
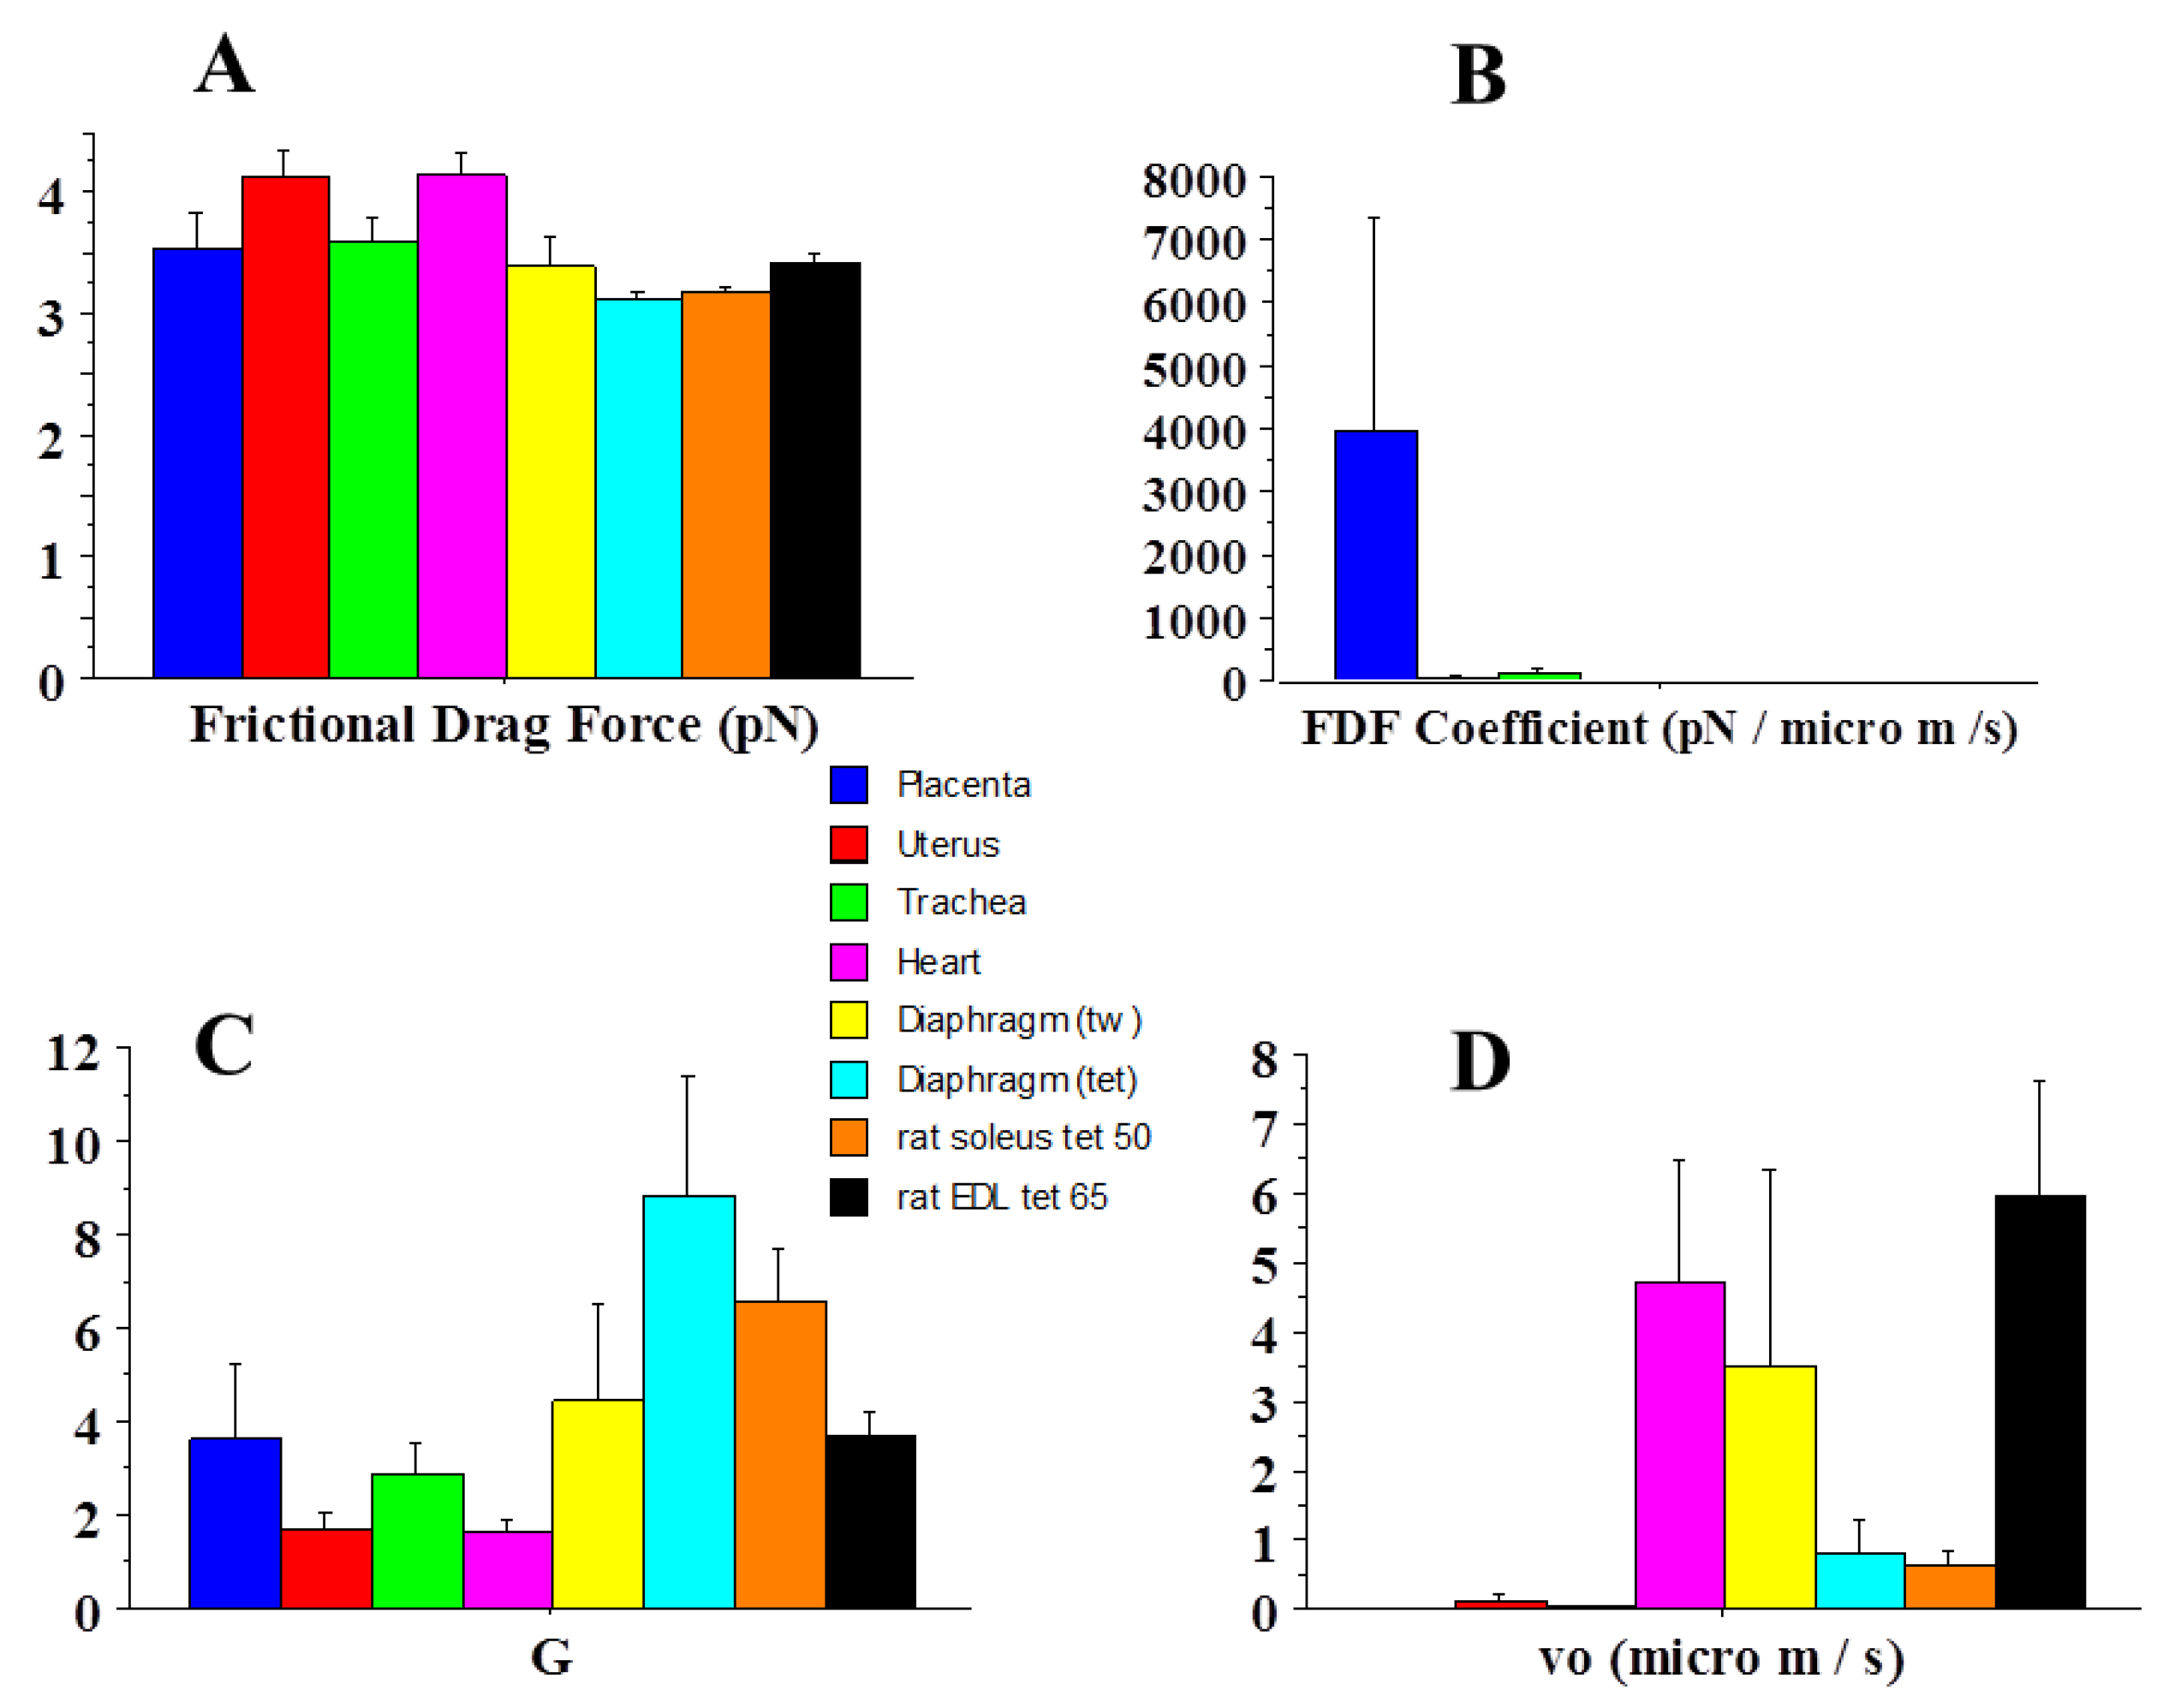
2.1. General Mechanical Parameters

Figure 1A,B shows the mean values ± standard deviation (SD) of the peak unloaded velocity of shortening (Vmax) and total isometric tension observed in the eight contractile living tissues. The lowest values were registered in the placental tissue. The average values of contractile parameters observed in both heart and placental tissues, and the heart/placenta ratio of these parameters are reported in Table 1. Thus, Vmax was almost two thousand times higher in the heart tissues than in the placental tissues, and total isometric tension was about thirty times smaller in the placental tissues than in the heart tissues. Myosin content (Figure 1F) was about 90 times higher in the heart tissues than in the placental tissues (Table 1).

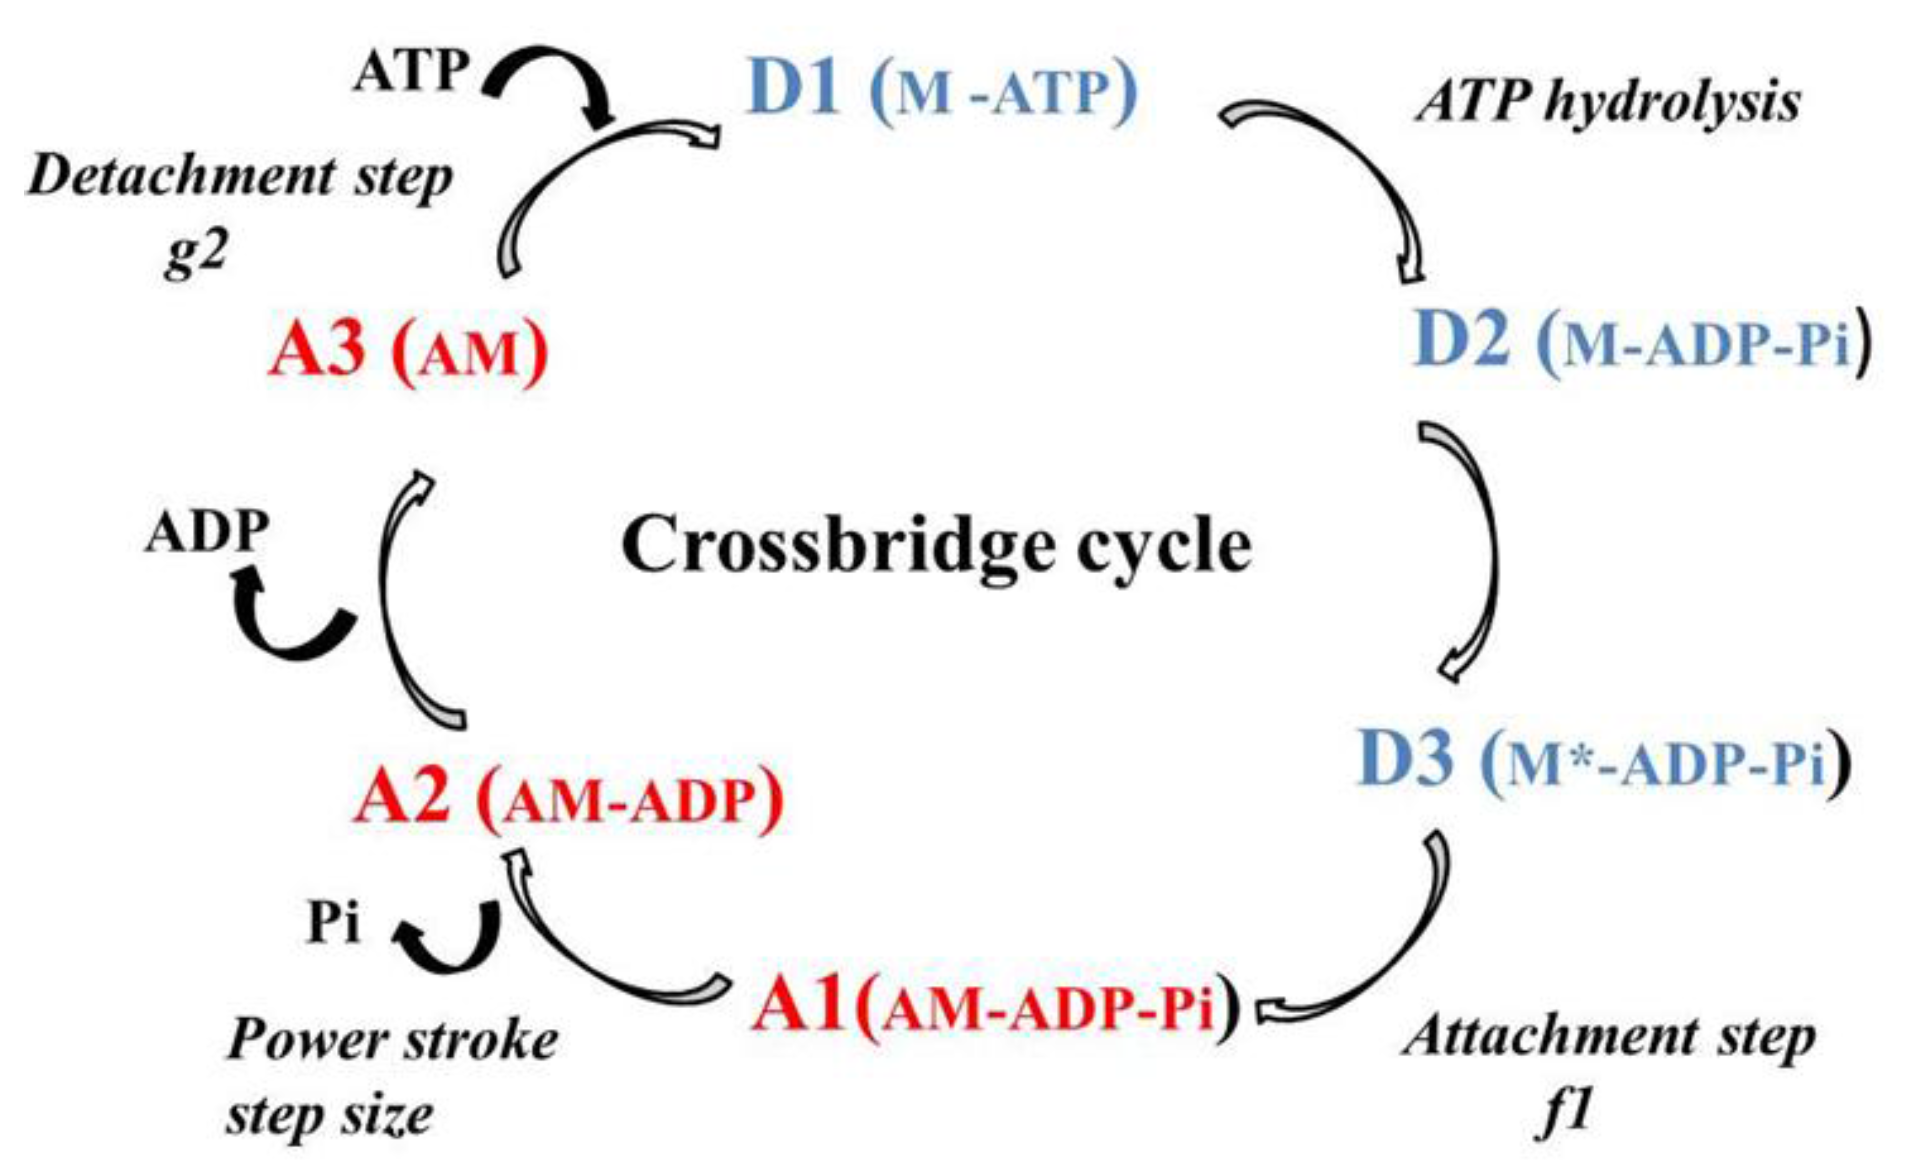
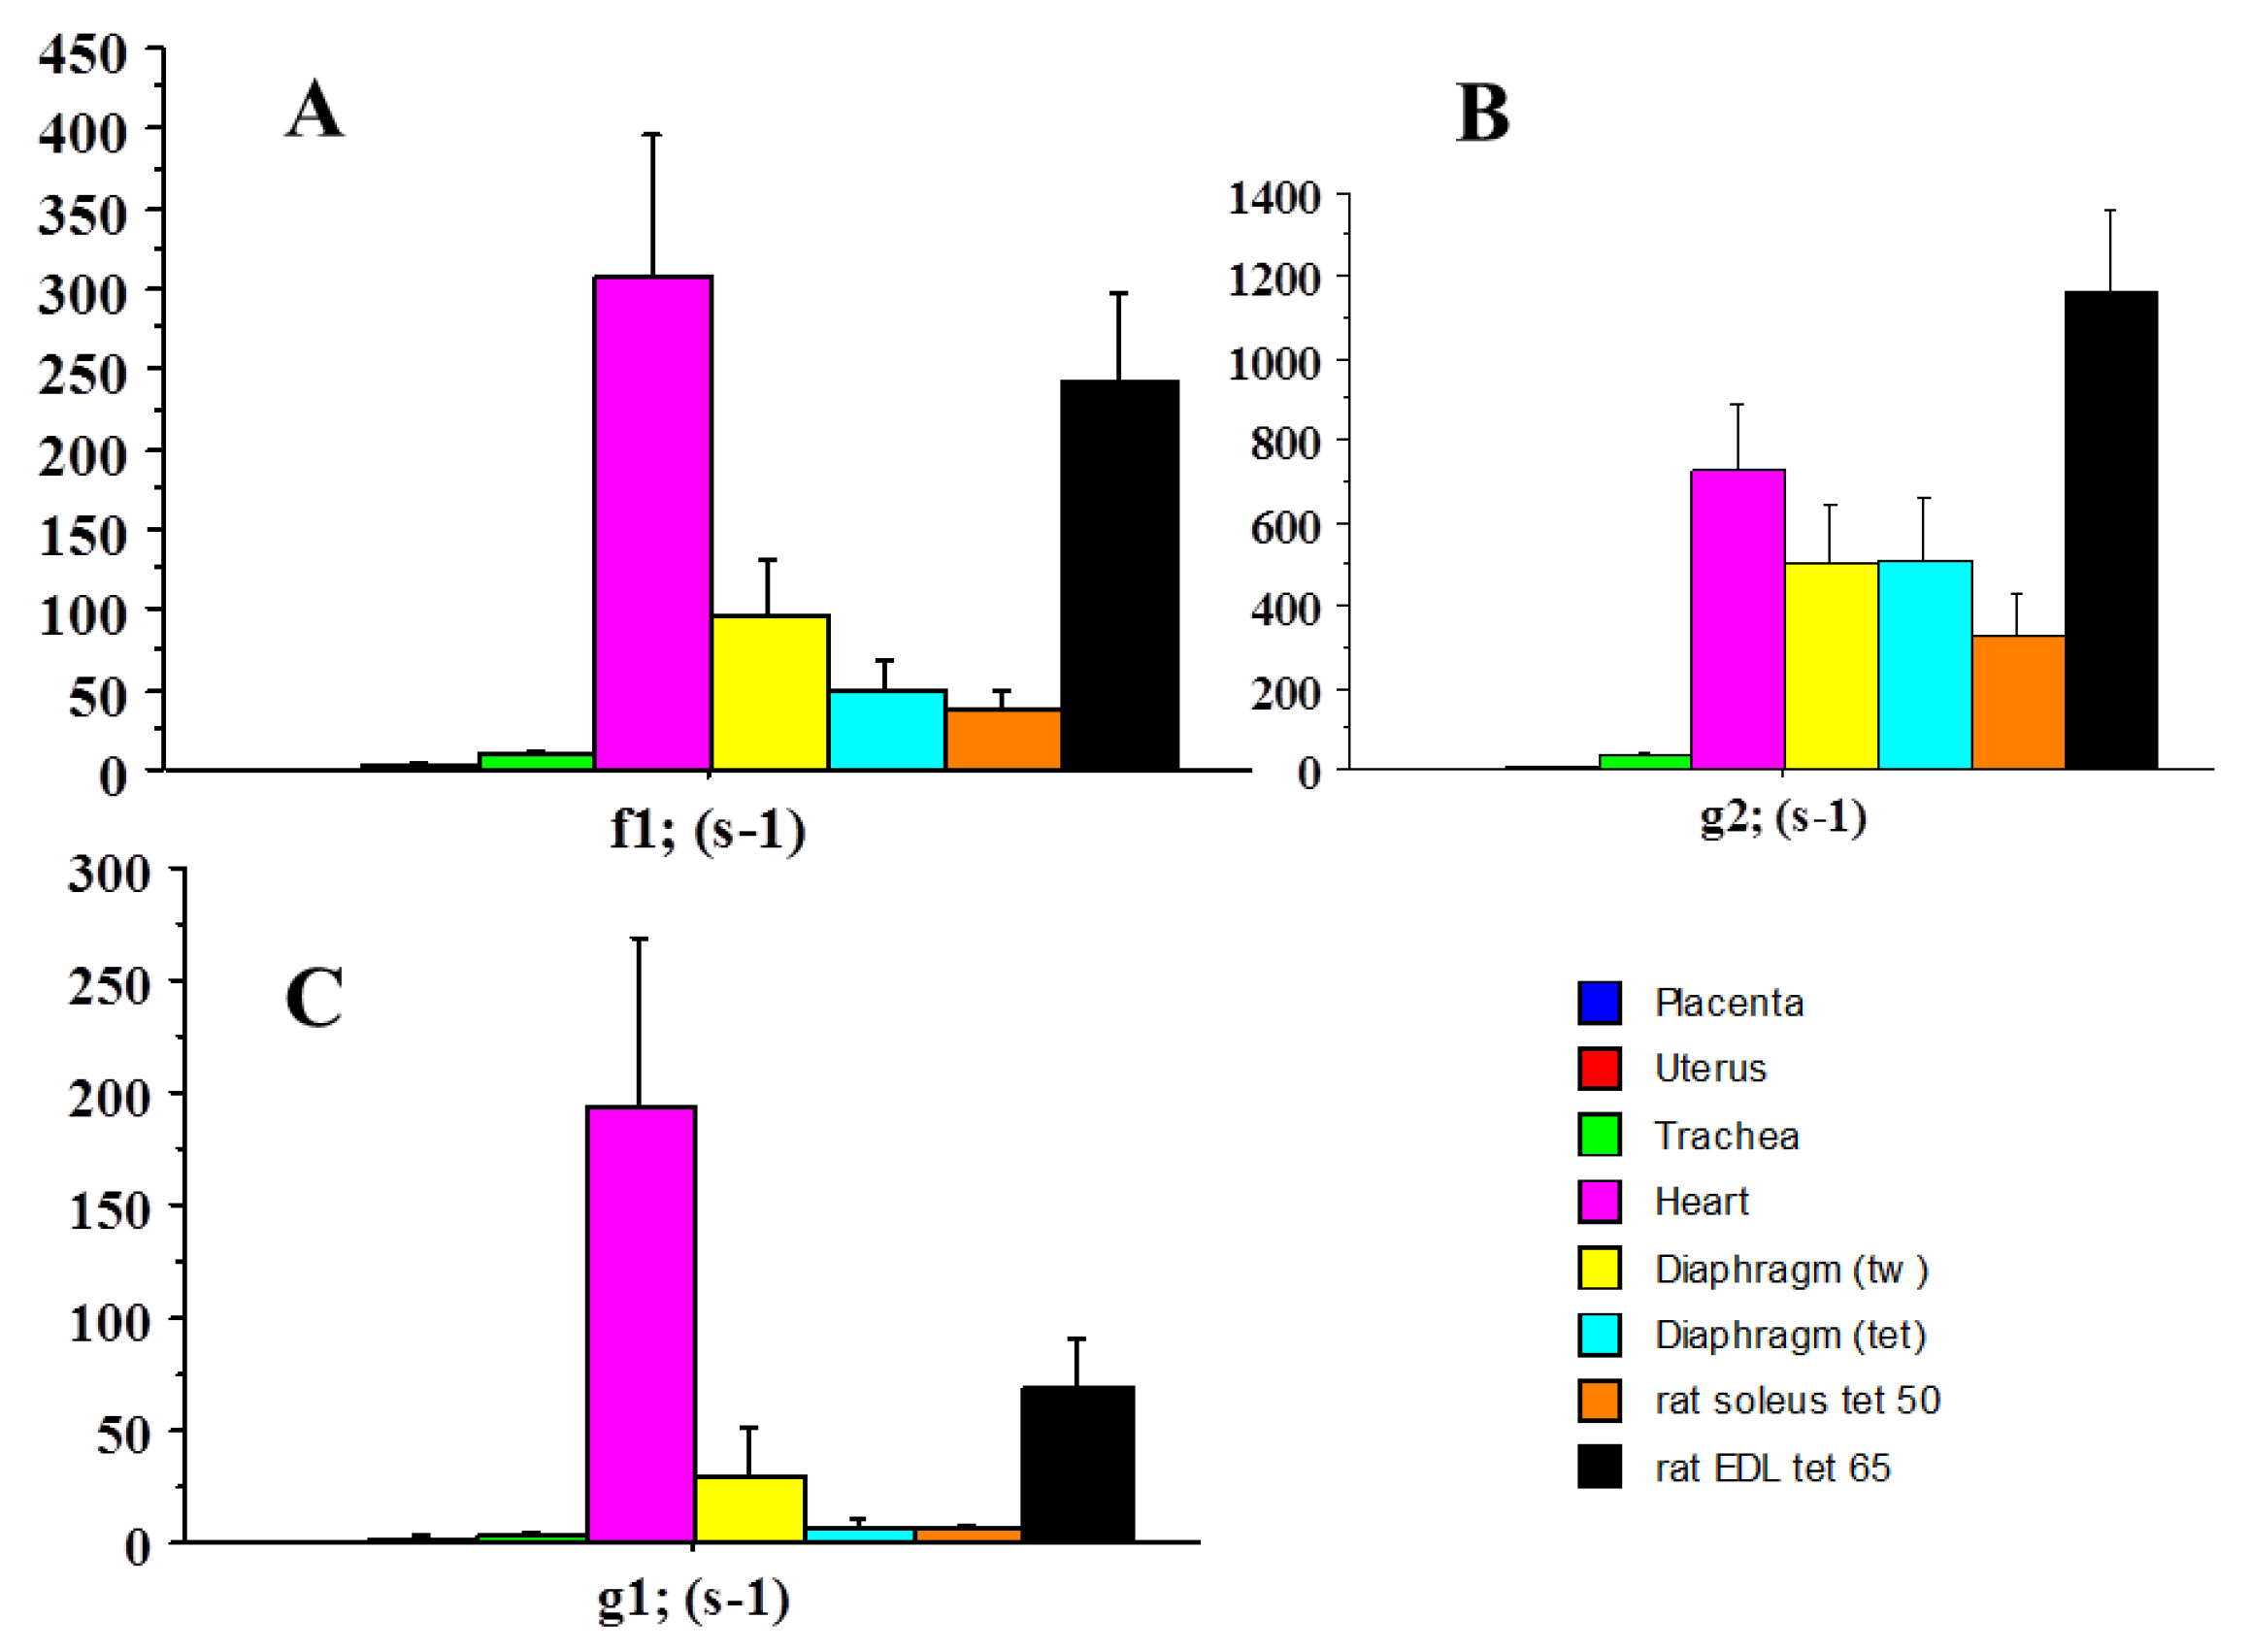
2.2. Molecular Mechanics of Actin–Myosin Molecular Motors

Figure 2 shows the cycle of actin–myosin interactions, with three detached states and three attached states. Probabilities of each of the six steps are presented in Figure 3. PD3 (see Figure 2) had the highest probability, and PA3 (see Figure 2), the lowest. Huxley’s equations were used to calculate the mean value of the unitary myosin CB force (po, in pN) (Figure 1D). The lowest value of po was observed in the heart tissues and the highest in the diaphragm tissues in tetanus mode (Figure 1D and Table 1). The unitary CB force varied in parallel with that of the maximum efficiency (Figure 1D,E). The kcat (s−1) value is 1/tc, where tc is the total duration of the actin–myosin CB cycle. Again, the highest value of kcat was observed in the heart tissues, which was about 7000 times higher than in the placental tissues (Figure 1C and Table 1).
The constants of attachment (f1) and detachment (g1 and g2) are shown in Figure 4A–C. The highest values for f1 and g1 were observed in the heart tissues and the lowest values in the placental tissues (Table 1). The heart/placenta ratio for f1 was 4000. This means that the duration of attachment of actin to myosin was much shorter in the heart tissues than in the placental tissues. As shown in Figure 5D, the average velocity of the myosin CB tilt (vo) was very high in both the heart and EDL tissues, and dramatically low in the placental tissues (the heart/placenta ratio for vo was 2350) (Table 1). Conversely, the coefficient of friction was very high in the placental tissues and very low in the heart tissues (the heart/placenta ratio for the friction coefficient was 0.0003) (Figure 5B and Table 1). This made it possible to generate a frictional drag force (FDF) that was a little higher in the heart tissues than in the placental tissues (Figure 5A and Table 1). The contraction of the heart tissues took place with a very low coefficient of friction, which minimized the degree of wear of the myosin CBs that must function throughout life. The curvature (G) of the tension–velocity relationship of the contractile structures is presented in Figure 5C.

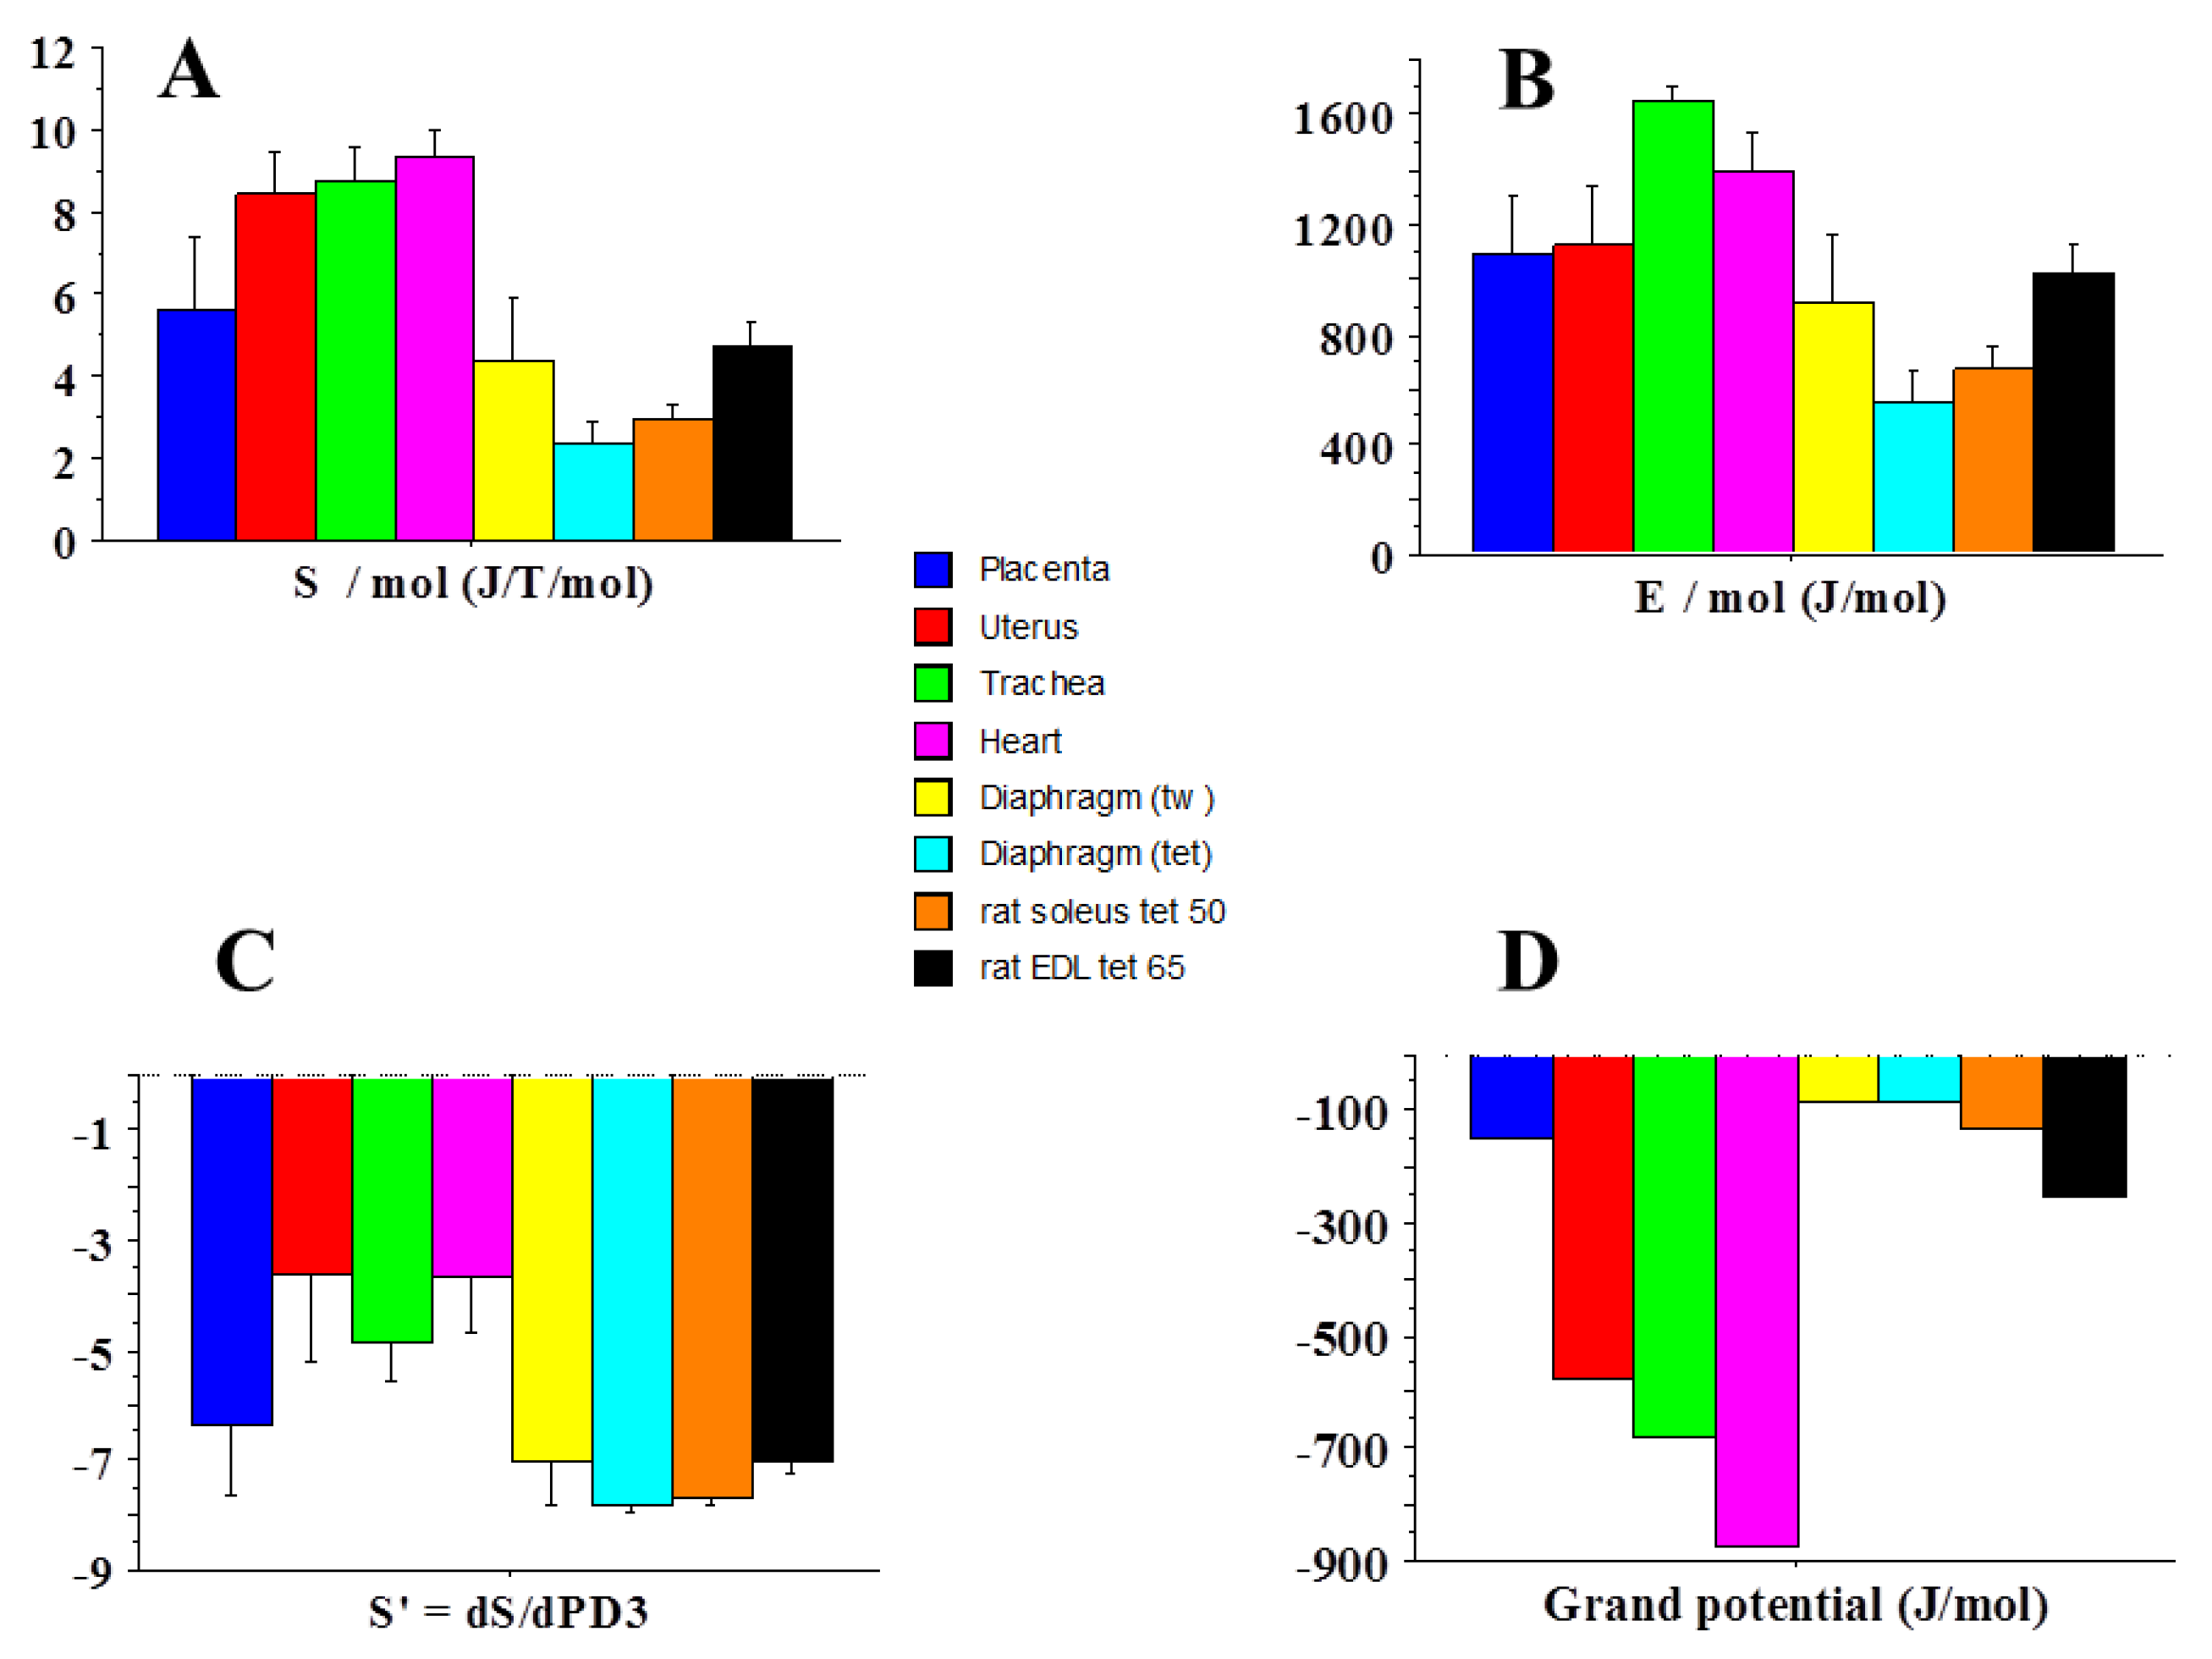
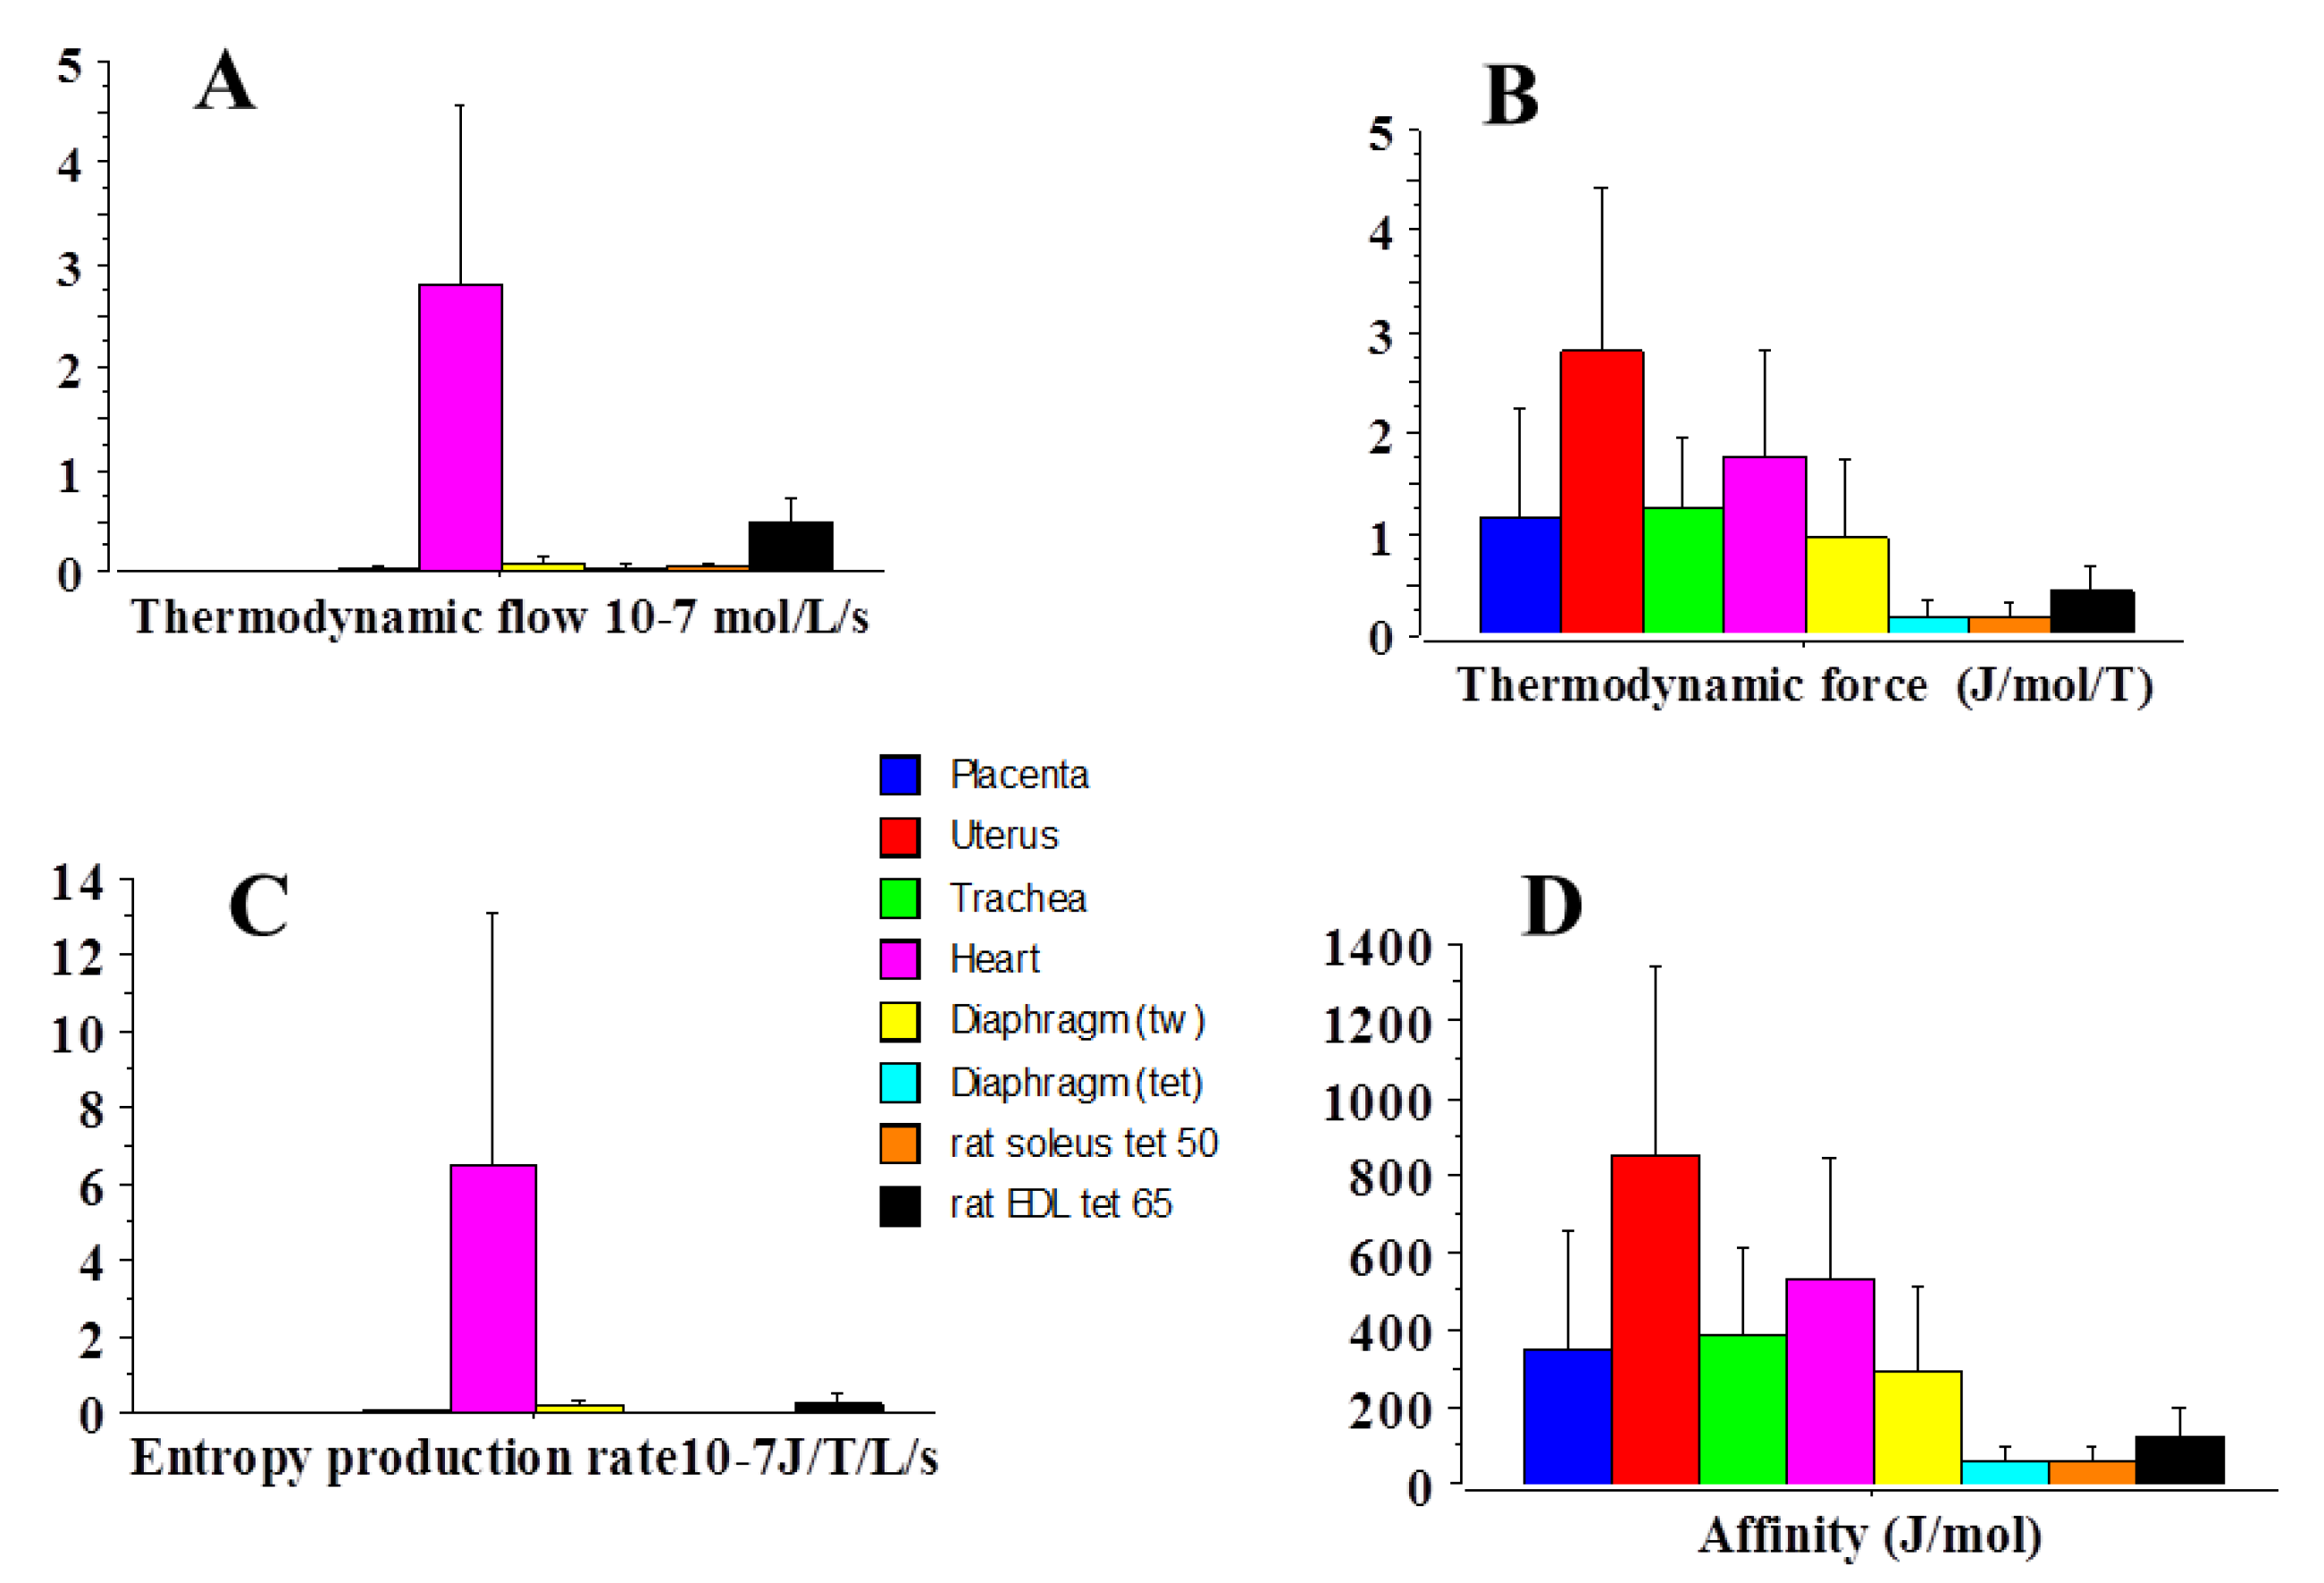
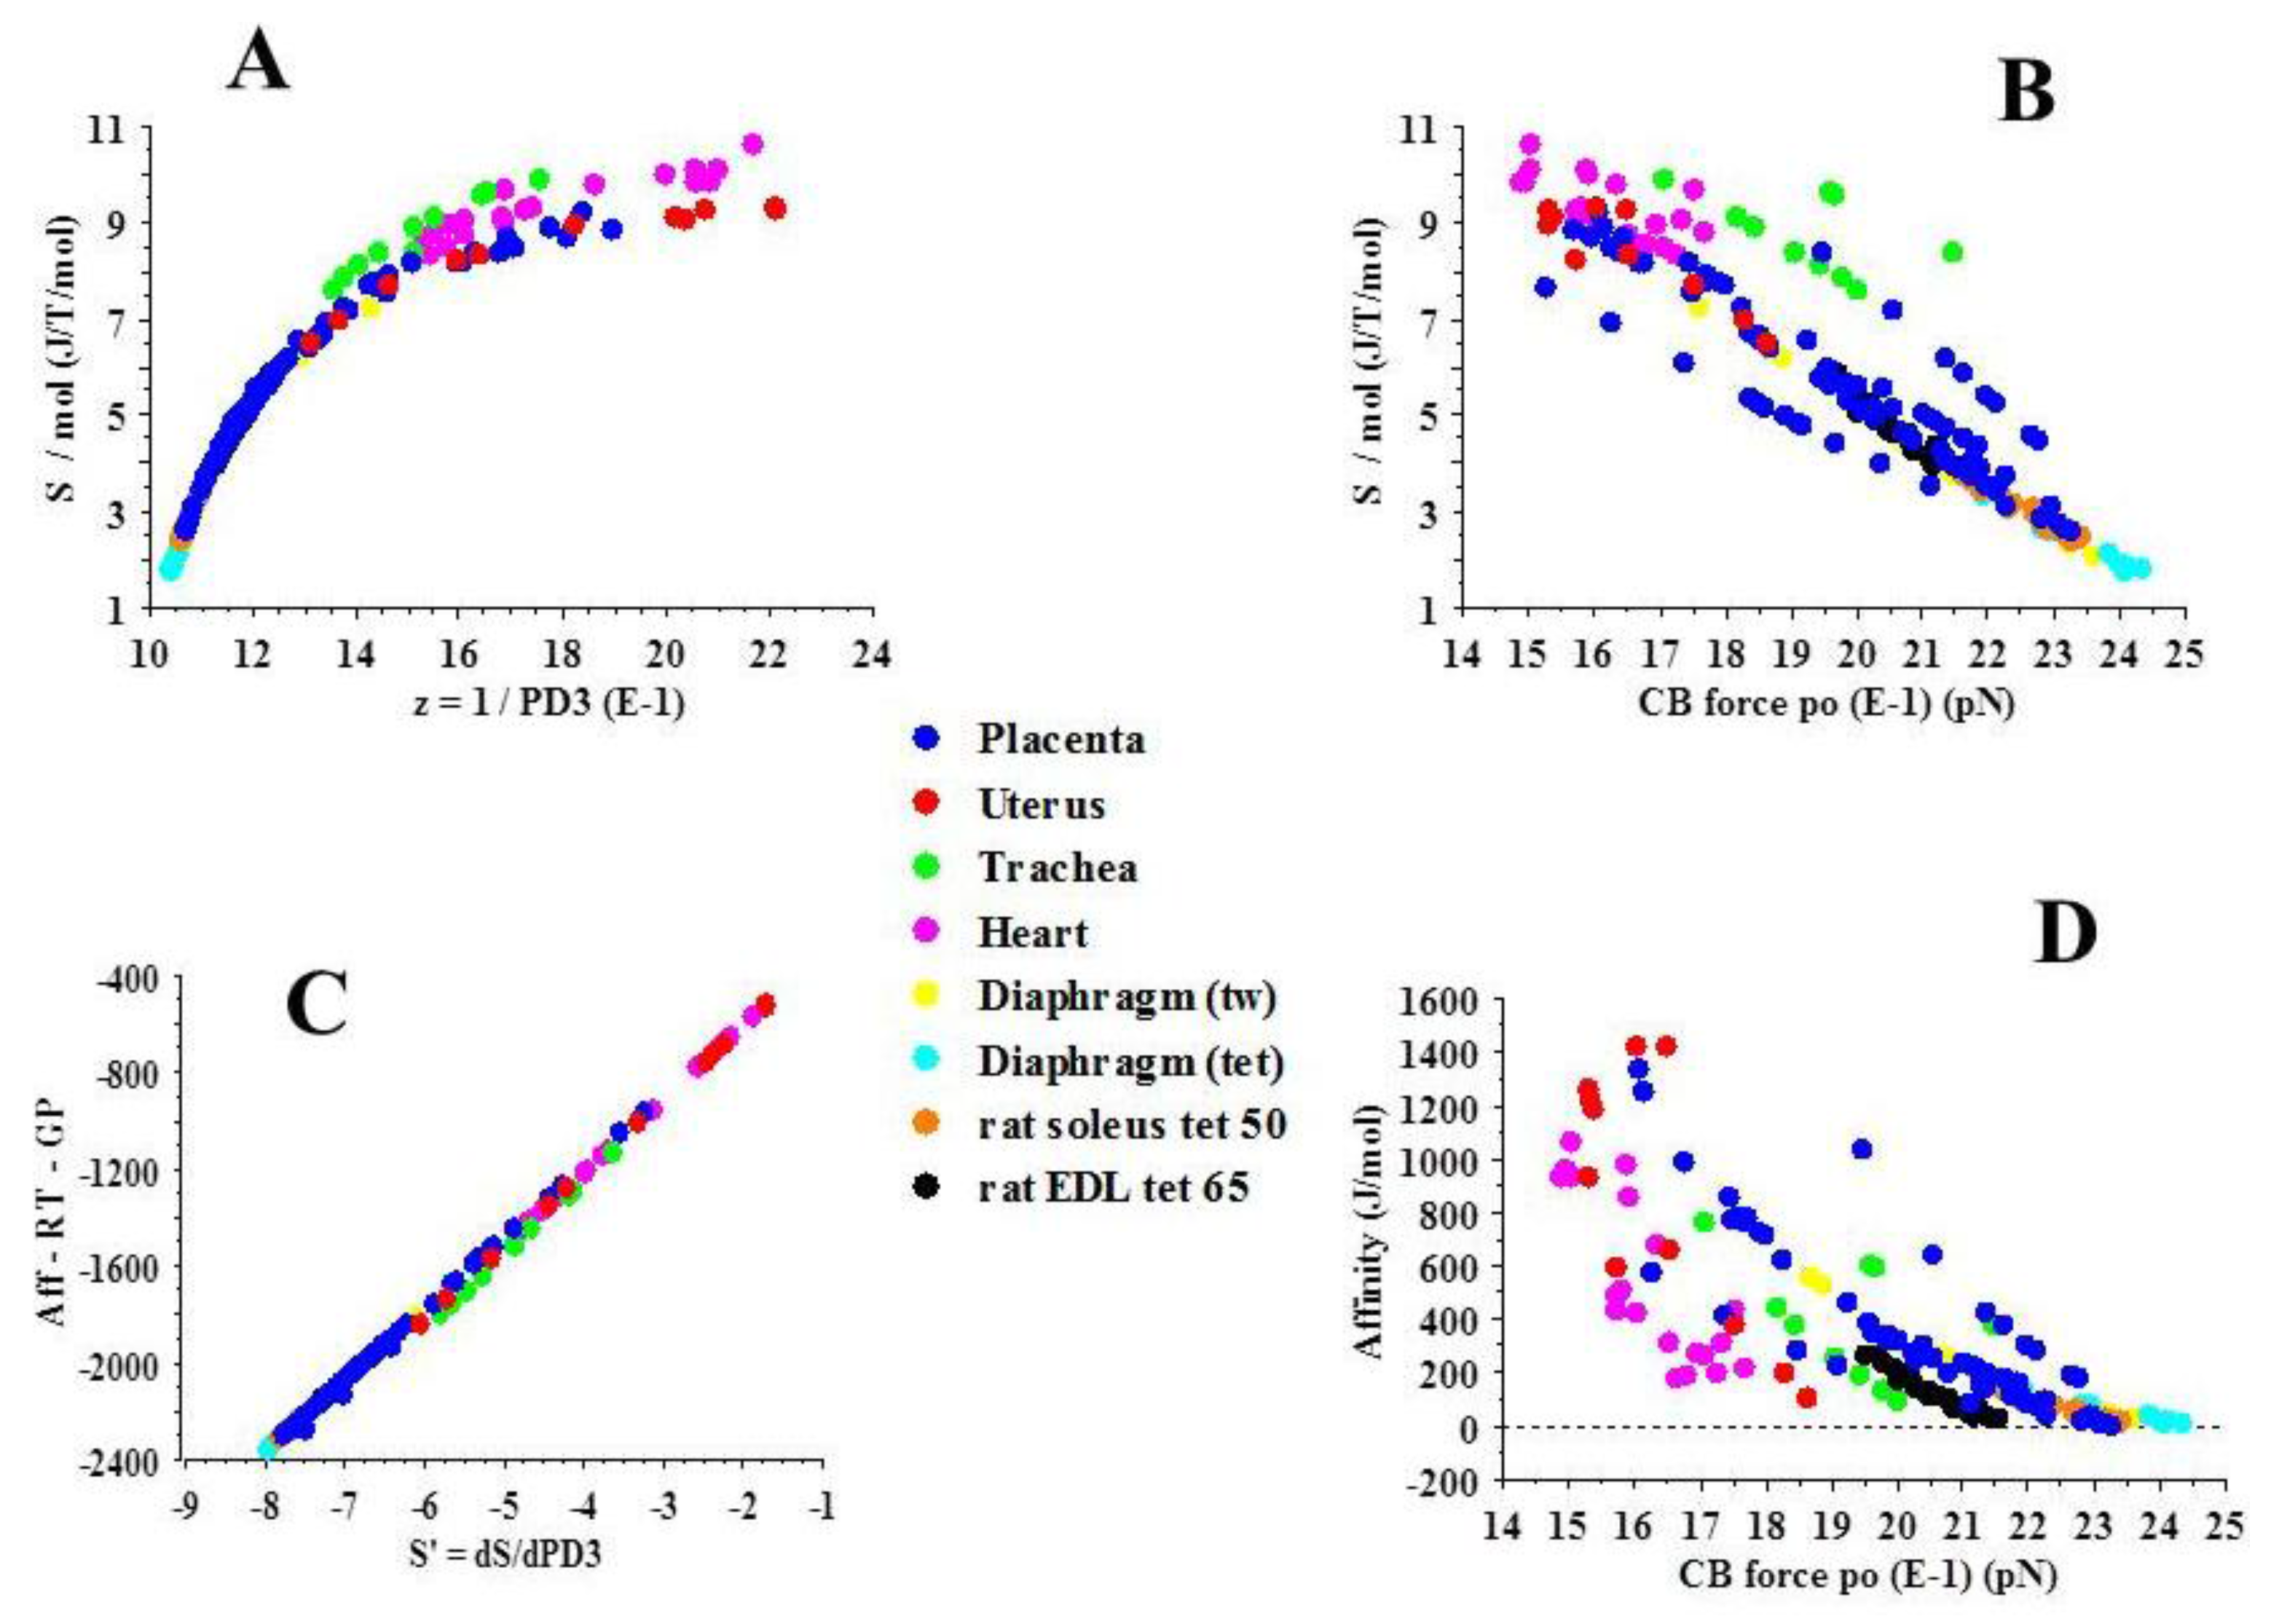
2.3. Statistical Mechanics

The parameters for statistical mechanics are presented in Figure 6 and Figure 7. Figure 6A–D show the values for the statistical entropy (S), the internal energy (E), the derivative of S with respect to PD3 (S’) and the grand potential (ψ). The lower the CB force, the higher the S value (Figure 1D and Figure 6A). Figure 7D shows the affinity values. Affinity in the heart tissues was relatively high, at around 535 J/mol. However, the highest affinity value was observed in the uterine tissues (Figure 7D). In all contractile tissues, affinity was <<2500 J/mol. This means that all the muscle or non-muscle contractile systems studied were working near equilibrium (A << 2500 J/mol). Figure 7A,B show the thermodynamic flow and the thermodynamic force. Thermodynamic flow was much higher in the heart tissues than in the other contractile tissues studied. A proportional relationship was observed between the thermodynamic force and the thermodynamic flow in all the contractile structures studied (Table 2). The highest value of the slope of proportionality was observed in the placental tissues, and the lowest in the heart tissues. This proportional relationship between the thermodynamic force and the thermodynamic flow means that all the contractile structures studied were working in a stationary linear regime. The rate of entropy production (Figure 7C) was much higher in the heart tissues than in other contractile structures mainly due to the high value of thermodynamic flow observed in the heart tissues (Table 1 and Figure 7A). Figure 8A shows a curvilinear relationship between the statistical entropy and the microcanonical partition function (z). A negative relationship was observed between S and the unitary CB force (Figure 8B). There was a perfect linear relationship observed between A-RT-GP (GP was the grand potential ψ) and S’ (Figure 8C). No clear relationship was observed between affinity and the unitary CB force (Figure 8D).

3. Discussion

The mechanical properties of muscle tissues have been established since the publication of Hill’s seminal study [15,16], showing in particular the hyperbolic relationship between tension and peak shortening velocity. By incorporating Hill’s results into his biophysical actin–myosin CB theory, Huxley [7] has established a formalism for calculating the main CB properties, namely unitary CB force, CB number per g or volume unit of muscle tissue, CB attachment and detachment constants, and so on (see Materials and Methods). The molecular motors of myocytes are the muscle myosin type II (MII). More recently, it has been found that non-muscle tissues, such as human placental tissues, possess contractile properties. The type II non-muscle myosin (NMII) represents the molecular motor of the myofibroblast cell. All the muscle and non-muscle contractile tissues studied show a hyperbolic tension–velocity relationship [13,14]. It is therefore possible to apply Huxley’s formalism to them. Huxley’s theory also allows us to calculate the probabilities of the various steps in the actin–myosin cycle.
Muscle myosin II and non-muscle myosin II are “rower” molecular motors because there is a strong likelihood that myosin motors are in a detached state at any given time (probability >50% of the time cycle) [17,18,19,20]. Moreover, the number of molecular motors operating in very large ensembles is high. The “rower” behavior for cell motion, adopted by both MII and NMII, provides a number of advantages. Protein friction is generated by myosin CBs attached with actin, especially in systems where there is a very large number of myosin heads interacting with actin [21]. Therefore, being in a detached state from actin for a large part of the CB cycle, large ensembles of MII and NMII can operate together without disturbing or operating against one another. The high probability of being in a detached state helps minimize protein friction [17] (Figure 5A,B). This may partly explain the high mechanical efficiency observed in MII and NMII [22] (Figure 1E).
Statistical mechanics makes it possible to use the grand canonical ensemble for the study of complex open systems such as living muscles. Thus, one can calculate the main thermodynamic quantities, such as entropy, internal energy, chemical affinity, thermodynamic force, thermodynamic flow and the production rate of entropy. In our study, we compared the mechanical and thermodynamic results obtained in various striated and smooth muscles, in both twitch and tetanus modes, with those observed in normal human placental tissues. Our results showed that the lower the CB force, the higher the statistical entropy (Figure 1D and Figure 6A). This suggests that a diminution in unitary CB force leads to an augmentation in entropy. A decrease in unitary CB force has previously been reported in pathophysiological states such as in heart failure [22], chronic growth hormone hypersecretion [23] and in the diaphragm muscle of peroxisome proliferator-activated receptor (PPAR) alpha knockout mice [24]. Thus, in a given muscle type, the evolution of the statistical entropy might provide information about its pathophysiological status. It appears that the human placenta breaks all the records for slowness, as compared with muscle tissues (Figure 1). The attachment and detachment constants of the actin–myosin CB were dramatically low (Figure 4A–C). The thermodynamic flow and the entropy production rate (diS/dt) were particularly low (Figure 7A,C).
Under the linear regime wherein the phenomenological laws of Onsager can be used, a near equilibrium system can tend towards a stationary state [10,11]. In such stationary states, diS/dt reaches a minimum level that represents the criterion of stability of a stationary state. The irreversibility of chemical processes is quantified by diS/dt. The higher the diS/dt, the further the system moves away from equilibrium [10]. In the human placental tissues, the low value of diS/dt indicated that this non-muscle contractile tissue produced few irreversible biochemical processes and was maintained in a very near-equilibrium state, as compared with other contractile systems. In living cells, numerous systems have been shown to operate in a near-equilibrium manner [25,26,27,28]. Certain open living systems can be maintained in a near-equilibrium state through the flow of energy and matter. Linear non-equilibrium thermodynamics has been reported in various biological fields [29], i.e., in oxidative phosphorylation [30,31], facilitated and active transports [32] and time evolution of proteins [33]. From a theoretical viewpoint, there has been much research into the thermodynamics of muscles in particular [34,35,36,37,38,39]. In all the systems studied, affinity was much less than 2500 J/mol (Figure 7D). These were systems working in a near-equilibrium state [10,11]. The relationship of proportionality between the thermodynamic force and the thermodynamic flow demonstrated that they were stationary linear systems (Table 2).

4. Materials and Methods

4.1. Experimental Procedure

Experiments on animals were conducted on heart (n = 20), trachea (n = 10), diaphragm (in tetanus mode: n = 10; in twitch mode; n = 11), soleus (SOL: n = 28), and extensor digitalis longus (EDL: n = 29) muscle tissues of adult Wistar rats. Care of the animals conformed to the declaration of Helsinski. Our study was approved by our institution (INSERM: Institut National de la Santé et de la Recherche Médicale). Experiments on both uterine and placental tissues were performed on human tissues. Samples of myometrium (n = 11) were obtained from patients undergoing a hysterectomy in the maternity department of Meaux Hospital, France, as benign gynecological surgery. Samples were collected from normal parts of the uterine corpus, provided they were free of macroscopic abnormalities. All women provided informed written consent with approval from the local ethical committee. Term human placentas (n = 62) were obtained from vaginal deliveries following uncomplicated pregnancies at the Maternity department of Meaux Hospital, France. Women provided informed consent with approval from the local ethical committee in 2011, according to the standards of ML/YP/SG-2011-206 and DGRI CCTIRS MG/CP 2012.181.

4.2. Experimental Set-Up

Muscle and non-muscle samples were carefully dissected. Each strip was rapidly mounted in a tissue chamber containing a classic Krebs–Henseleit solution, bubbled with 95% O2–5% CO2 and maintained at pH 7.4. Contractile samples were stimulated either electrically by means of two platinum electrodes or chemically by means of KCl (0.05 M). Electrical stimulus: 5 ms duration; stimulation frequency: 50–100 Hz; train duration: 250–5000 ms; train frequency: 0.17 Hz. For muscle strips, experiments were carried out at the resting length corresponding to the apex of the initial length-active tension curve (Lo). For non-muscle placental samples, the preload was the load that induced neither shortening nor lengthening. The cross-sectional area of the contractile sample (in mm2) was calculated from the weight/length ratio of the sample at Lo at the end of the experiment. The experimental protocol and the electromagnetic transducer have been described in an earlier study [40].
The peak unloaded velocity of shortening (Vmax, in Lo·s−1) was assessed by means of the zero-load clamp technique. The peak isometric tension, i.e., the peak force normalized per cross-sectional area (total isometric tension, To, in mN·mm−2) was measured from the fully isometric contraction. The Hill hyperbolic tension–velocity relationship [15] was determined from the peak velocity (V) of 8 to 10 isotonic after loaded contractions, which were plotted against the isotonic tension (T), and by successive increments of load from zero-load up to the total isometric tension [22]. The T–V relationship was fitted according to Hill’s classic equation, (T + a) (V + b) = [To + a] b where –a and –b were the asymptotes of the hyperbola. For all muscle or non-muscle samples, the T–V relationship was accurately fitted by means of a hyperbola. The G curvature of the T–V relationship was To/a = Vmax/b [15,41].

4.3. Huxley Formalism

The phenomenological formalism developed by Huxley [7] allows the calculation of various parameters which characterize the molecular properties of the myosin CBs, as well as the probabilities of occurrence of different steps in the CB cycle (Figure 2). To be able to use this formalism, contractile systems must present a hyperbolic T–V relationship. The asymptotes –a and –b, and the G curvature of the T–V relationship are part of the Huxley equations that have been previously applied to striated muscle, smooth muscle, and non-muscle contractile structures. Using this formalism, the rate of total energy release (EHux) and the isotonic tension (PHux)—as a function of the shortening velocity (V) of the contractile structure—were obtained by the following equations:
EHux = (Ne) (h/2 l) (f1/(f1 + g1)) [g1 + f1 (V/Φ) [(1 − exp (−Φ/V)]]
PHux = N (sw/2 l) (f1/(f1 + g1)) [1 − (V/Φ) [(1 − exp (−Φ/V)) (1 + (1/2) ((f1 + g1)/g2)2 (V/Φ)]
where f1 is the peak value of the rate constant for CB attachment; g1 and g2 are the peak values of the rate constants for CB detachment; w is the peak mechanical work of a unitary CB (w/e = 0.75) and e is the free energy necessary to split one ATP molecule. Only one ATP is split per CB cycle. The standard free energy, ∆G°’ATP, is roughly −60 kJ/mol. The value used for e is 10−19 J [27]. The tilt or swing of the myosin head relative to actin varies from 0 to the molecular step size (h); f1 and g1 correspond to a tilt from 0 to h; g2 corresponds to a tilt > h; Φ = (f1 + g1) h/2 = b; N is the number of cycling CBs per mm2 at peak isometric tension. The molecular step size represents the translocation distance of the actin filament per ATP hydrolysis, produced by the tilt of the myosin head. Parameter l represents the distance between two successive actin sites with which any myosin site can combine. In agreement with the Huxley condition (𝓁 >> h), the h and 𝓁 values are h = 10 nm and 𝓁 = 28.6 nm (this is close to the semi-helicoidal turn of the actin filament) [42]. The value of h was confirmed by the three-dimensional head structure of the muscle myosin II [43,44,45]. Calculations of f1, g1, and g2 were obtained from the following equations [13]:
G = f1/g1       g1 = 2wb/ehG       g2 = 2Vmax/h
kcat = (h/2𝓁) × [(f1g1)/(f1 + g1)] po = (w/𝓁) × [(f1)/(f1 + g1)]
where po is the unitary CB force. Myosin content is calculated from the CB number per g of tissue (nM·g−1) and the Avogadro number. The myosin ATPase activity is the product of the kcat and myosin content. The thermodynamic flow is v = kcat × CB mole number per liter (mol·L−1·s−1). The rate of mechanical work (WM) is equal to PHux·V [22]. At any given load level, the efficiency of the contractile tissue is defined as the ratio of WM to EHux. The peak efficiency is the peak value of efficiency.

4.4. Determination of CB Probabilities of the Six States

The methodology used to determine the probabilities of the different steps in the CB cycle has been previously published [13]. Calculations of the probabilities of occurrence of these different steps in the CB cycle are enabled by the Huxley formalism. The probability of each state r is the ratio of the duration tr of the state r (with r ranging from 0 to 5) to the overall duration of the CB cycle tc = 1/kcat. Myosin CBs spend more time in a detached state than in an attached state [17,20]. Myosin CBs are “rower” molecular motors. This means that the sum of the probabilities of the three detached states is more than 50% [17]. This means that 0.5 < (PD1 + PD2 + PD3) < 1 [17,19,20] and that the most probable state is one of the three detached states.
Let the duration of the CB transitions be tA1, tA2, tD1 and tD2, where tA1 is for the transition A1 A2, and so on (Figure 2). These values can be calculated from Huxley’s equations [13]. The probability PD1 = tD1/tc = (1/g2)/tc = kcat/g2 was low, due to the fact that tD1 << tc and g2 >> 1/tc [20]. In addition, tD2 was approximated to 10 tD1 [41]. Consequently, PD2 was approximated to 10 × PD1. The probability PA1 = tA1/tc = (1/f1)/tc = kcat/f1 was also low, due to the fact that tA1 = 1/f1 was << tc. The probability PA2 = tA2/tc = (h/vo) × kcat was low, due to the fact that tA2 was << tc [19,20]. Thus, the most probable detached state was D3.
The energy level Er of the six states increased from E0 to E5. By convention, the lowest level (E0) coincided with the ground state (gs), and was equal to zero (E0 = Egs = 0) [8]. The highest level was E5. The probability Pr of each state r diminished from P0 (the most probable state, i.e., PD3) to P5 (the least probable state). The distribution of energy was characterized by the average number Nr of cycling CBs that occupied a given state of energy level Er. The average internal energy E is the sum of their individual energies, i.e., E = r N r E r .
The ratio of probabilities of the most probable state to the least probable state was provided by the relationship: E5 − E0 = kT (ln P0/P5) = 10−19 J. As 0.5 < PD3 < 1 and E5 − E0 = kT ln (P0/P5); this means that P5 was << to PA1, PA2, PD1, and PD2. Consequently, the least probable state was A3, which implies that P5 = PA3. The highest state level E5 was EA3 = 10−19 J. In addition, PA3 + PD3 = 1 − (PA1 + PA2 + PD1 + PD2). We know the ratio PD3/PA3 and the sum PA3 + PD3. Thus, we can deduce PA3 and PD3.

4.5. Statistical Mechanics

Open, living contractile systems have the possibility to exchange energy and matter with their surroundings, extract energy from nutrients and O2, and produce ATP that drives the chemo-mechanical processes. In CB myosin molecular motors, there is a one-to-one chemo-mechanical coupling. This means that only one ATP is consumed per CB cycle [7]. The number of independent and distinguishable cycling CBs is equal to the number of ATPs that are consumed during contractile processes. In statistical mechanics, the grand canonical ensemble can be applied to complex open systems such as muscle and non-muscle contractile tissues. In our study, the open contractile system (CS) was in a container (C). The following molecules made up the system and the container: myosin CBs, actin, and small soluble molecules such as ATP, ADP and inorganic phosphate Pi. These molecules could be exchanged between CS and C. CBs were either attached to or detached from actin, and bound or not with ATP, ADP or Pi. Moreover, the number of cycling CBs could fluctuate slightly with the number of non-cycling CBs, which became cycling CBs and vice versa. CS was composed of all the active cycling CBs which were each in one of the six states. C was composed of all the non-cycling CBs, all the non-cycling actin molecules, and all the ATP, ADP and Pi that were not attached to the cycling CBs.
In the grand canonical ensemble, the average number of independent, non-interacting cycling CBs within CS was calculated from the Huxley equations [7] and was expressed in nM·L−1 of contractile tissue. Let A be the chemical affinity of the CB cycle, S the statistical entropy, E the internal energy, and T (Kelvin) the temperature of S. The grand potential is linked to E, S, A and T according to the classic relationship ψ = E − TS − A. Statistical entropy S = R r P r ln P r characterizes the dispersal of energy and makes it possible to calculate the degree of disorder in the system. The molecular partition function is z = 1/Pmax (where Pmax was the highest probability PD3). The Boltzmann distribution is given by the equation:
P r = e β E r / r e β E r
and the molecular partition function (z) is equal to
z = r e β E r
thus, P r = e β E r / z , where β is equal to 1/kT.
Since Eo = 0, then Po = PD3 = 1/z.
We also have the thermodynamic equation: E − TS = − RT ln z.
Thus, E − TS = ψ − A = − RT ln z = RT ln Pmax = RT ln PD3.
Consequently, E = RT ln Pmax + TS. The CB cycle stopped when the thermodynamic flow v of the system CS tended towards zero. Under these conditions, A also tended towards zero. Thus, E − TS tended towards ψ. The extrapolation at v = 0 of the E − TS versus v relationship (i.e., the ordinate of this relationship) was equal to ψ. The affinity A was calculated by the equation:
A = ψ − RT ln PD3 and the thermodynamic force were equal to A/T.
S’ = dS/dPD3 = −R (1 + lnPD3). Thus, A − RT − ψ was linearly related to S’ (Figure 8C).
If A is <<2500 J/mol, the chemical system works in a near-equilibrium state. A near-equilibrium chemical system under a linear regime tends to a stationary state. This is the case if the thermodynamic force A/T varies linearly with the thermodynamic flow v [10,46] (Table 2). In open systems in a stationary state, the rate of entropy production (diS/dt) due to chemical reactions is the product of the thermodynamic force (A/T) and the thermodynamic flow:
diS/dt = (A/T) v; (v = kcat × mole number per liter) [10,47].

5. Statistical Analysis

Data were expressed as means ± standard deviation (SD). Student’s unpaired t-test was used for comparisons of parameters between contractile muscle and non-muscle groups. A p value of less than 0.05 was considered statistically significant. Linear regressions were performed by means of the least squares method.

6. Conclusions

From a thermodynamic point of view, this study brings together two dramatically different contractile systems, namely muscle contractile systems and non-muscle contractile systems. These two contractile systems operate with distinct CB molecular motors, but they both share the well-established contractile properties of muscle systems. Statistical mechanics, combined with the Huxley formalism, provided a powerful method for demonstrating the link between the chemo-mechanical characteristics of muscle MII and non-muscle NMII CB molecular motors, and their thermodynamic properties. In contractile human placental tissues, CB kinetics of NMII appeared to be dramatically slow compared with those reported in MII in striated and smooth muscles. The high rate of entropy production observed in heart tissues was mainly due to the high value of its thermodynamic flow. The non-muscle contractile placental tissues presented dramatically low values of CB kinetics which explain its low entropy production rate. Despite a large range in CB kinetics and rate of entropy production observed in both muscle and non-muscle contractile tissues, the unitary CB force observed in all the muscle and non-muscle tissues studied was of a comparable order of magnitude. All the studied contractile tissues behaved near equilibrium and in a stationary linear regime.

Acknowledgments

We would like to thank Christophe Locher, President of the “Fédération de la Recherche Clinique du Grand Hôpital de l’Est Francilien”, and Vincent Gobert, Administrative Manager of the Clinical Research Center, Meaux Hospital, Meaux, France, for their valuable support in making the necessary research facilities available for this study. The manuscript has been revised by Brian Keogh.

Author Contributions

Y.L. conceived and designed the protocol. X.K. and Y.L. developed the formalism of statistical mechanics. Y.L., J.-L.H., F.-X.B. and A.V. carried out the experiments, made the calculations and analyzed the data. F.M. and O.T. are the obstetric surgeons who provided the fragments of placenta and uterus. V.C. designed and built the electronic device. All authors participated in the writing of the article and approved the final version of the manuscript.

Conflicts of Interest

The authors declare no conflict of interest.

References

  1. Cooke, R. Actomyosin interaction in striated muscle. Physiol. Rev. 1997, 77, 671–697. [Google Scholar] [PubMed]
  2. Krantz, E.K.; Parker, J.C. Contractile properties of the smooth muscle in the human placenta. Clin. Obstet. Gynecol. 1963, 6, 26–38. [Google Scholar] [CrossRef]
  3. Farley, A.E.; Graham, C.H.; Smith, G.N. Contractile properties of human placental anchoring villi. Am. J. Physiol. Regul. Integr. Comp. Physiol. 2004, 287, R680–R685. [Google Scholar] [CrossRef] [PubMed]
  4. Hinz, B. Formation and function of the myofibroblast during tissue repair. J. Investig. Dermatol. 2007, 127, 526–537. [Google Scholar] [CrossRef] [PubMed]
  5. Conti, M.A.; Adelstein, R.S. Nonmuscle myosin II moves in new directions. J. Cell Sci. 2008, 121, 11–18. [Google Scholar] [CrossRef] [PubMed]
  6. Matsumura, S.; Sakurai, K.; Shinomiya, T.; Fujitani, N.; Key, K.; Ohashi, M. Biochemical and immunohistochemical characterization of the isoforms of myosin and actin in human placenta. Placenta 2011, 32, 347–355. [Google Scholar] [CrossRef] [PubMed]
  7. Huxley, A.F. Muscle structure and theories of contraction. Prog. Biophys. Biophys. Chem. 1957, 7, 255–318. [Google Scholar] [PubMed]
  8. Atkins, P.W. Physical Chemistry, 5th ed.; Oxford University Press: Oxford, UK; Melbourne, Australia; Tokio, Japan, 1990. [Google Scholar]
  9. Levine, I.N. Physical Chemistry, 5th ed.; McGraw-Hill International Edition: New York, NY, USA, 2003. [Google Scholar]
  10. Prigogine, I. Introduction to Thermodynamics of Irreversible Processes; Interscience Publishers: New York, NY, USA, 1967. [Google Scholar]
  11. Kondepudi, D.; Prigogine, I. Modern Thermodynamics from Heat Engines to Dissipative Structures; Wiley & Sons: New York, NY, USA, 1999. [Google Scholar]
  12. Lecarpentier, Y.; Claes, V.; Lecarpentier, E.; Blanc, F.X.; Joseph, T.; Geraets, B.; Krokidis, X.; Hebert, J.L. Comparative statistical mechanics of myosin molecular motors in rat heart, diaphragm and tracheal smooth muscle. Comptes Rendus Biol. 2011, 334, 725–736. [Google Scholar] [CrossRef] [PubMed]
  13. Lecarpentier, Y.; Blanc, F.X.; Quillard, J.; Hebert, J.L.; Krokidis, X.; Coirault, C. Statistical mechanics of myosin molecular motors in skeletal muscles. J. Theor. Biol. 2005, 235, 381–392. [Google Scholar] [CrossRef] [PubMed]
  14. Lecarpentier, Y.; Claes, V.; Hebert, J.L.; Krokidis, X.; Blanc, F.X.; Michel, F.; Timbely, O. Statistical Mechanics of the Human Placenta: A Stationary State of a Near-Equilibrium System in a Linear Regime. PLoS ONE 2015, 10, e0142471. [Google Scholar] [CrossRef] [PubMed]
  15. Hill, A.V. The heat of shortening and the dynamic constants of muscle. Proc. R. Soc. Lond. Biol. Sci. 1938, 126, 136–195. [Google Scholar] [CrossRef]
  16. Hill, A.V. Thermodynamics of muscle. Nature 1951, 167, 377–380. [Google Scholar] [CrossRef] [PubMed]
  17. Leibler, S.; Huse, D.A. Porters versus rowers: A unified stochastic model of motor proteins. J. Cell Biol. 1993, 121, 1357–1368. [Google Scholar] [CrossRef] [PubMed]
  18. Howard, J. Molecular motors: Structural adaptations to cellular functions. Nature 1997, 389, 561–567. [Google Scholar] [CrossRef] [PubMed]
  19. Spudich, J.A. How molecular motors work. Nature 1994, 372, 515–518. [Google Scholar] [CrossRef] [PubMed]
  20. Lecarpentier, Y.; Chemla, D.; Pourny, J.C.; Blanc, F.X.; Coirault, C. Myosin cross bridges in skeletal muscles: “Rower” molecular motors. J. Appl. Physiol. 2001, 91, 2479–2486. [Google Scholar] [PubMed]
  21. Tawada, K.; Sekimoto, K. A physical model of ATP-induced actin-myosin movement in vitro. Biophys. J. 1991, 59, 343–356. [Google Scholar] [CrossRef]
  22. Lecarpentier, Y.; Chemla, D.; Blanc, F.X.; Pourny, J.C.; Joseph, T.; Riou, B.; Coirault, C. Mechanics, energetics, and crossbridge kinetics of rabbit diaphragm during congestive heart failure. FASEB J. 1998, 12, 981–989. [Google Scholar] [PubMed]
  23. Lecarpentier, Y.; Coirault, C.; Riou, B.; Chemla, D.; Mercadier, J.J. Diaphragm strength and cross-bridge properties during chronic growth hormone hypersecretion. Eur. Respir. J. 1999, 13, 1070–1077. [Google Scholar] [CrossRef] [PubMed]
  24. Lecarpentier, Y.; Krokidis, X.; Martin, P.; Pineau, T.; Hebert, J.L.; Quillard, J.; Cortes-Morichetti, M.; Coirault, C. Increased entropy production in diaphragm muscle of PPAR alpha knockout mice. J. Theor. Biol. 2008, 250, 92–102. [Google Scholar] [CrossRef] [PubMed]
  25. Marshall, W.E.; Omachi, A. Measured and calculated NAD+-NADH ratios in human erythrocytes. Biochim. Biophys. Acta 1974, 354, 1–10. [Google Scholar] [CrossRef]
  26. Veech, R.L.; Kashiwaya, Y.; Gates, D.N.; King, M.T.; Clarke, K. The energetics of ion distribution: The origin of the resting electric potential of cells. IUBMB Life 2002, 54, 241–252. [Google Scholar] [CrossRef] [PubMed]
  27. Veech, R.L.; Lawson, J.W.; Cornell, N.W.; Krebs, H.A. Cytosolic phosphorylation potential. J. Biol. Chem. 1979, 254, 6538–6547. [Google Scholar] [PubMed]
  28. Masuda, T.; Dobson, G.P.; Veech, R.L. The Gibbs-Donnan near-equilibrium system of heart. J. Biol. Chem. 1990, 265, 20321–20334. [Google Scholar] [PubMed]
  29. Demirel, Y.; Sandler, S.I. Thermodynamics and bioenergetics. Biophys. Chem. 2002, 97, 87–111. [Google Scholar] [CrossRef]
  30. Rigoulet, M.; Guerin, B.; Denis, M. Modification of flow-force relationships by external ATP in yeast mitochondria. Eur. J. Biochem. 1987, 168, 275–279. [Google Scholar] [CrossRef] [PubMed]
  31. Stucki, J.W. The optimal efficiency and the economic degrees of coupling of oxidative phosphorylation. Eur. J. Biochem. 1980, 109, 269–283. [Google Scholar] [CrossRef] [PubMed]
  32. Kedem, O.; Katchalsky, A. Thermodynamic analysis of the permeability of biological membranes to non-electrolytes. Biochim. Biophys. Acta 1958, 1000, 413–430. [Google Scholar] [CrossRef]
  33. Dewey, T.G.; Delle Donne, M. Non-equilibrium thermodynamics of molecular evolution. J. Theor. Biol. 1998, 193, 593–599. [Google Scholar] [CrossRef] [PubMed]
  34. Hill, T.L.; Eisenberg, E.; Chen, Y.D.; Podolsky, R.J. Some self-consistent two-state sliding filament models of muscle contraction. Biophys. J. 1975, 15, 335–372. [Google Scholar] [CrossRef]
  35. Chen, Y.D.; Hill, T.L. Analysis of a simple prototypal muscle model near to and far from equilibrium. Proc. Natl. Acad. Sci. USA 1974, 71, 1982–1986. [Google Scholar] [CrossRef] [PubMed]
  36. Hill, T.L.; Chen, Y.D. Further analysis of a simple prototypal muscle model near to and far from equilibrium. Proc. Natl. Acad. Sci. USA 1974, 71, 2478–2481. [Google Scholar] [CrossRef] [PubMed]
  37. Hill, T.L. Studies in irreversible thermodynamics, vii. Proc. Natl. Acad. Sci. USA 1966, 56, 840–844. [Google Scholar] [CrossRef] [PubMed]
  38. Hill, T.L. Studies in irreversible thermodynamics, IV. Diagrammatic representation of steady state fluxes for unimolecular systems. J. Theor. Biol. 1966, 10, 442–459. [Google Scholar] [CrossRef]
  39. Hill, T.L.; Simmons, R.M. Free energy levels and entropy production in muscle contraction and in related solution systems. Proc. Natl. Acad. Sci. USA 1976, 73, 336–340. [Google Scholar] [CrossRef] [PubMed]
  40. Lecarpentier, E.; Claes, V.; Timbely, O.; Hebert, J.L.; Arsalane, A.; Moumen, A.; Guerin, C.; Guizard, M.; Michel, F.; Lecarpentier, Y. Role of both actin-myosin cross bridges and NO-cGMP pathway modulators in the contraction and relaxation of human placental stem villi. Placenta 2013, 34, 1163–1169. [Google Scholar] [CrossRef] [PubMed]
  41. Woledge, R.C.; Curtin, A.N.; Homsher, E. Energetic Aspects of Muscle Contraction; Academic Press: London, UK, 1985; Volume 41. [Google Scholar]
  42. Sheterline, P.; Clayton, J.; Sparrow, J. Protein Profile, 3rd ed.; Academic Press: London, UK, 1996. [Google Scholar]
  43. Huxley, A.F.; Simmons, R.M. Mechanical properties of the cross-bridges of frog striated muscle. J. Physiol. 1971, 218, 59P–60P. [Google Scholar] [PubMed]
  44. Rayment, I.; Holden, H.M.; Whittaker, M.; Yohn, C.B.; Lorenz, M.; Holmes, K.C.; Milligan, R.A. Structure of the actin-myosin complex and its implications for muscle contraction. Science 1993, 261, 58–65. [Google Scholar] [CrossRef] [PubMed]
  45. Dominguez, R.; Freyzon, Y.; Trybus, K.M.; Cohen, C. Crystal structure of a vertebrate smooth muscle myosin motor domain and its complex with the essential light chain: Visualization of the pre-power stroke state. Cell 1998, 94, 559–571. [Google Scholar] [CrossRef]
  46. Onsager, L. Reciprocal relations in irreversible processes II. Phys. Rev. 1931, 38, 405–426. [Google Scholar] [CrossRef]
  47. De Donder, T. L’Affinité; Gauthiers-Villars: Paris, France, 1927. [Google Scholar]
Figure 1. Mechanical parameters of contractile tissues and crossbridge (CB) properties: (A) maximum unloaded shortening velocity (Vmax); (B) total isometric tension; (C) kcat, the inverse of the total CB time cycle; (D) unitary CB force (po); (E) maximum efficiency; and (F) myosin content.
Entropy 19 00558 g001
Figure 2. The ATP-ADP-Pi actin–myosin CB cycle with six different conformational steps, i.e., three detached steps (D1, D2 and D3) and three attached steps (A1, A2 and A3). Transition A3 D1 is the ATP binding step which induces the CB detachment after the ATP binding with the actin (Act)-myosin (M) complex (AM). The rate constant for detachment is g2: AM → Act + M. Transition D1 → D2 is the ATP hydrolysis: M-ATP M-ADP-Pi. Transition D2 D3 is M-ADP-Pi M*-ADP-Pi. D3 is the step with the highest probability. Transition D3 → A1 is the attachment state: the myosin head (M*-ADP-Pi) binds with Act and the rate constant for attachment is f1: M-ADP-Pi + Act AM-ADP-Pi. Transition A1 → A2 is the power stroke which is triggered by the Pi release: AM-ADP-Pi AM-ADP + Pi. The power stroke is characterized by the generation of a unitary CB force ( picoN) and an elementary CB step ( nm). Transition A2 A3 is the release of ADP: AM-ADP AM + ADP.
Entropy 19 00558 g002
Figure 3. Probabilities of the six steps of the CB cycle (see paragraph 4.4). (A) PD1 probability; (B) PD2 probability; (C) PD3 probability; (D) PA1 probability; (E) PA2 probability; (F) PA3 probability.
Entropy 19 00558 g003
Figure 4. Attachment (f1) and detachment (g1 and g2) constants of crossbridges: (A) Attachment (f1) constant of crossbridges; (B) detachment (g2) constant of crossbridges; and (C) detachment (g1) constant of crossbridges.
Entropy 19 00558 g004
Figure 5. Crossbridge properties and curvature (G) of the tension–velocity relationship: (A) Frictional drag force (FDF) of CBs; (B) coefficient of frictional drag force; (C) G curvature of the tension-velocity relationship; (D) mean velocity of the CB tilt.
Entropy 19 00558 g005
Figure 6. Thermodynamic parameters: (A) statistical entropy (S); (B) internal energy (E); (C) S’ = dS/dPD3: derivative of S according to PD3; (D) grand potential.
Entropy 19 00558 g006
Figure 7. Thermodynamic parameters: (A) thermodynamic flow; (B) thermodynamic force; (C) entropy production rate; (D) affinity.
Entropy 19 00558 g007
Figure 8. Relationships between thermodynamics parameters and the unitary CB force: (A) relationship between the statistical entropy and the microcanonical partition function; (B) relationship between the statistical entropy and the unitary CB force; (C): relationship between A–RT–GP (grand potential GP is ψ) and the derivative of S with respect to PD3, i.e., S’; (D) relationship between affinity and the CB force.
Entropy 19 00558 g008
Table 1. Mean values of contractile parameters, myosin CB properties, and statistical mechanics for the heart and the placental tissues. The last column presents the ratio of the mean in the heart tissues and the mean in the placental tissues.
Placenta (Mean)Heart (Mean)Heart/Placenta Ratio
Vmax0.0023.71850
Tension1.54228
Kcat0.00320.66866
Unitary CB force2.01.60.80
max Efficiency (%)36280.78
Myosin content0.1412.589
Frictional drag force (FDF)3.54.11.2
FDF coefficient394310.0003
Vo0.0024.72350
G3.71.60.43
f10.0753064080
g10.0281946928
g20.3417312143
Statistical entropy5.69.31.7
Internal energy109714011.3
Affinity3545351.5
Thermodynamic force1.21.81.5
Thermodynamic flow4.8 × 10−62.80.58 × 106
Entropy Production Rate8.2 × 10−136.5 × 10−70.8 × 106
Table 2. There was a relationship of proportionality between the thermodynamic force and the thermodynamic flow. The second column represents the slope of this relationship.
SlopeRP
PLACENTA2.4 × 10130.850.001
UTERUS1.6 × 10100.610.04
TRACHEA4.9 × 1090.760.01
HEART5.2 × 1070.890.0001
DIAPHRAGM (tw)1.1 × 1090.910.0001
DIAPHRAGM (TET)4.2 × 1080.850.002
SOLEUS3.5 × 1080.600.0001
EDL7.9 × 1070.710.0001

