Article

Changes in Phylogenetic Community Structure of the Seedling Layer Following Hurricane Disturbance in a Human-Impacted Tropical Forest

1
Yale School of Forestry and Environmental Studies, New Haven, CT 06511, USA
2
Smithsonian Tropical Research Institute, P.O. Box 0843-03092, Balboa Ancón, Panama
3
Department of Ecology, Evolution and Environmental Biology, Columbia University, New York, NY 10027, USA
4
Department of Environmental Sciences, University of Puerto Rico, Rio Piedras Campus, P.O. Box 70377, San Juan, PR 009325-8377, USA
5
Department of Botany, National Museum of Natural History, Smithsonian Institution, P.O. Box 37012, Washington, DC 20013-7012, USA
6
Department of Biology, University of Maryland, College Park, MD 20742, USA
7
Centre for Ecology & Hydrology, Bush Estate, Penicuik, Midlothian EH26 0QB, UK
*
Author to whom correspondence should be addressed.
Forests 2018, 9(9), 556; https://doi.org/10.3390/f9090556
Submission received: 25 July 2018 / Revised: 1 September 2018 / Accepted: 6 September 2018 / Published: 11 September 2018
(This article belongs to the Special Issue Forest Responses to Large-Scale Wind Disturbance)

Abstract

:
Disturbance plays a key role in shaping forest composition and diversity. We used a community phylogeny and long-term forest dynamics data to investigate biotic and abiotic factors shaping tropical forest regeneration following both human and natural disturbance. Specifically, we examined shifts in seedling phylogenetic and functional (i.e., seed mass) community structure over a decade following a major hurricane in a human-impacted forest in Puerto Rico. Phylogenetic relatedness of the seedling community decreased in the first five years post-hurricane and then increased, largely driven by changes in the abundance of a common palm species. Functional structure (based on seed mass) became increasingly clustered through time, due to canopy closure causing small-seeded, light-demanding species to decline in abundance. Seedling neighbor density and phylogenetic relatedness negatively affected seedling survival, which likely acted to reduce phylogenetic relatedness within seedling plots. Across the study site, areas impacted in the past by high-intensity land use had lower or similar phylogenetic relatedness of seedling communities than low-intensity past land use areas, reflecting interactive effects of human and natural disturbance. Our study demonstrates how phylogenetic and functional information offer insights into the role of biotic and abiotic factors structuring forest recovery following disturbance.

1. Introduction

Disturbance plays a key role in shaping ecological communities by increasing spatial and temporal variation in resource availability and providing opportunities for recruitment [1,2]. Species often differ in their responses to disturbance, employing divergent strategies that allow them to take advantage of heterogeneous environmental conditions [3,4]. This variation in life history strategy is hypothesized to permit species coexistence and foster species richness [5,6,7]. If there is phylogenetic signal in the traits that underlie species life history strategies in response to disturbance (e.g., related species have more similar strategies than expected by chance), disturbance will leave a signature not only on species composition, but also on the phylogenetic structure of the community [8]. Thus, examining the phylogenetic structure of plant communities following disturbance can offer insights into the processes driving succession.
Natural disturbance has been shown to influence phylogenetic patterns on both ecological and evolutionary time scales [9,10]. For example, Verdú & Pausas [10] found that phylogenetic community structure differed in Mediterranean woody plant communities that have contrasting fire frequencies. Similarly, a number of studies have investigated effects of anthropogenic disturbance on phylogenetic patterns of plant community composition (e.g., [11,12,13,14,15,16]). In temperate and tropical forests, such studies have typically found that phylogenetic relatedness is higher in more recently disturbed sites (e.g., young secondary forest) compared to sites that were undisturbed or had been recovering for longer (e.g., [14,17]). In addition, Norden et al. [18] reported that light-demanding pioneer and secondary forest species that colonize disturbed areas in Costa Rica tend to be more closely related to each other than expected by chance. Thus, previous studies suggest that human disturbance often results in increased phylogenetic relatedness (i.e., decreased phylogenetic diversity) in forest communities.
Following both human and natural disturbance, species’ responses to changing abiotic conditions are governed, in large part, by their life history strategy. In forests, disturbance typically results in significantly altered patterns of understory light availability. Thus, one key axis of species’ life history strategy governing responses to disturbance in forest systems is shade tolerance. Light-demanding species germinate and grow rapidly under high light conditions, while shade-tolerant species can establish and persist beneath closed canopies [19]. If traits that underlie shade tolerance are phylogenetically conserved, then differential species’ responses to light availability may drive changes in phylogenetic community structure over time after disturbance [18]. Multiple structural and physiological traits contribute to shade tolerance. One such trait is seed mass, which has been shown to be significantly phylogenetically conserved in tropical tree communities [20,21,22] and to be correlated with seedling recruitment and survival [23]. Seed size tends to trade-off with seed number, such that plant species are able to produce either few large seeds that provide more resources to aid in seedling establishment and survival in shaded conditions, or many small seeds that allow the species to disperse further to reach high resource environments, such as light gaps [24,25,26]. Although a number of species depart from the expected relationship (e.g., [27,28]), seed mass is generally considered a good proxy for shade tolerance specifically [25] and stress tolerance of seedlings in general [26]. Thus, changes in mean seed mass of the seedling community can reveal how species life history interacts with changing abiotic conditions to shape post-disturbance forest communities.
While most studies of forest recovery following disturbance focus on the role of the abiotic environment (i.e., light, moisture, etc.), biotic interactions are also likely to change following disturbance. For example, disturbance can cause increased light levels in the forest understory, leading to higher densities of seedlings and saplings and potentially resulting in stronger competition for resources or increased pathogen or herbivore attack [29]. At the local neighborhood scale, in particular, such species interactions are likely to influence phylogenetic community structure [30]. Neighboring plants that are closely related phylogenetically are expected to compete strongly for the same resources or be susceptible to the same herbivores and pathogens [31,32] (although this is not always the case [33]). Thus, phylogenetic structure may influence patterns of survival and recruitment on local scales [34,35,36], resulting in a decrease in phylogenetic relatedness over time.
In the present study, we examined shifts in phylogenetic community structure over time following natural disturbance in a subtropical wet forest, for which a highly resolved DNA barcode-based community phylogeny has been assembled [37]. Specifically, we analyzed how the phylogenetic structure of the seedling bank within the 16-ha Luquillo Forest Dynamics Plot (LFDP) in Northeastern Puerto Rico changed over the decade following a major hurricane (Hurricane Georges in 1998). To better understand the abiotic and biotic interactions driving changes in phylogenetic community structure, we also examined community-wide shifts in seed mass values, as well as effects of local neighborhood composition on individual seedling survival. In addition, we took advantage of spatial variation in the intensity of past human activity within the LFDP to examine the signature of land use history on phylogenetic community structure. We focused on the seedling stage because this life stage responds strongly and rapidly to disturbance [29,38] and because processes occurring during early life stages ultimately shape community composition and play a key role in maintaining diversity in species-rich plant communities [3]. During hurricanes, tree mortality is often low [39,40], but damage to large trees can be extensive (i.e., defoliation, broken branches), altering conditions beneath the canopy and resulting in significant effects on seedlings growing in the understory [29,41,42]. In addition, in forests recovering from past human disturbance, studies of the seedling layer can offer insights into the successional trajectory of forest recovery [43].
In this study, we examined changes in seedling phylogenetic community structure during forest recovery from disturbance and test several hypotheses. After the hurricane, as the canopy recovered and understory light levels dropped, we expected a decrease over time in the abundance of small-seeded, shade-intolerant species in the seedling layer resulting in increasing phylogenetic and functional clustering. However, at the same time, we predicted an initial decrease in phylogenetic clustering as seedling densities thinned out due to non-random mortality with respect to the phylogenetic relatedness of neighbors (i.e., phylogenetic negative density dependence). Finally, since human disturbance generally results in more homogenous areas dominated by closely related, disturbance-adapted species, we predicted that areas with a history of high-intensity land use would exhibit higher phylogenetic clustering compared to adjacent areas that had been less disturbed by past human activity.

2. Materials and Methods

2.1. Study Site

The study was conducted in the 16 ha Luquillo Forest Dynamics Plot (LFDP) in Northeastern Puerto Rico (18°20′ N, 65°49′ W). Annual rainfall at the site averages 3500 mm, with all months receiving >200 mm of rain, and daily average maximum and minimum air temperatures are 25.2 °C and 20.5 °C, respectively [44]. All freestanding woody stems ≥1 cm dbh (diameter at 1.3 m above ground) in the LFDP have been tagged, mapped, identified to species, and measured at ~five-year intervals since 1990.
The Luquillo forest has a well-documented history of hurricane disturbance. In the two decades before our study, two major storms struck the forest, Hurricane Hugo (category 4) in September 1989 [39] and Hurricane Georges (category 3) in September 1998 [45]. In this study we focused on regeneration following Georges, which caused significant damage to trees in the Luquillo forest, altering understory conditions. Specifically, the mean and heterogeneity of light levels on the forest floor were elevated for 1–3 years following Georges, resulting in high seedling densities that persisted for 4–6 years [29].
In addition to the natural disturbance, the LFDP forest has experienced anthropogenic disturbance in the form of clear-cut logging and agriculture that occurred before 1934 when the USDA Forest Service purchased the land. Selective logging occurred in the LFDP until 1953 [46]. This past land-use history has significantly altered the species composition of the forest [47,48,49]. For this study, we divided the LFDP into two areas based on past land use, using information from aerial photographs taken in 1936. The northern portion of the plot (~2/3 rds of the LFDP) was categorized as high land use history and the southern area was categorized as low land use history (see [29,46] for more details).

2.2. Seedling Census

To monitor seedling dynamics following Hurricane Georges, 150 permanent 1 × 2 m plots were established at ~20 m intervals along six north-south running transects spaced 60 m apart [29,50]. A census was conducted in March–April 2000, during which all tree and shrub seedlings ≥10 cm tall and <1 cm dbh within the seedling plots were tagged, measured for height and root collar diameter, and identified (99.99% of individuals were positively identified to species). Palm seedlings were included if ≥10 cm tall and their newest frond arose <1.3 m from the ground. Recensuses of the seedling plots took place in April–June 2002, August–October 2004, February–March 2007, and January–February 2008. Mean daily rainfall in mm (±sd) in the four census intervals was 9.03 (±17.17), 10.80 (±18.28), 11.03 (±8.60), 9.98 (±15.27), respectively. From 2000 to 2008, 13,957 individuals of 78 tree, palm, and shrub species were measured and identified in the 150 seedling plots.

2.3. Analysis of Phylogenetic Community Structure

An ultrametric community phylogeny at the species-level was generated for the LFDP using a multi-locus DNA barcode library of three plastid markers, shown in Figure S1: rbcL, matK, and trnH-psbA. The molecular phylogeny contained 141 species and was constructed using a super matrix approach and constraint tree at the level of order. A detailed description of the construction of the phylogeny can be found in [37,51]. We calculated phylogenetic community structure of the seedling layer (all tree, shrub, and palm seedlings ≥10 and <130 cm tall) for each of the five seedling censuses. We excluded seedlings of four species (Casearia decandra, Lasianthus lanceolatus, Phytolacca rivinoides, and Psychotria maleolens) because they either do not grow to be ≥1cm dbh or because individuals ≥1 cm dbh were not found when tissue was collected to construct the phylogeny. Together these excluded species contributed only 0.3% of individuals to the seedling census, and are therefore unlikely to influence the results.
Various metrics for assessing phylogenetic community structure have been proposed [52]. We chose two of the most commonly utilized: Net Relatedness Index (NRI) and Nearest Taxon Index (NTI) [53]. NRI and NTI are calculated based on the standardized effect size of mean pairwise distances (MPD) separating taxa and mean nearest taxon distances (MNTD) in communities, respectively. NRI is more sensitive to tree-wide patterns of phylogenetic clustering and evenness, whereas NTI is more strongly influenced by patterns closer to the tips of the phylogeny (i.e., within families or genera). We calculated NRI and NTI for each individual 2 × 1 m seedling plot containing at least two species (n = 136–146 plots, depending on census year), using abundance data to assess phylogenetic relatedness among individuals within each plot. We used random draws from the pool of species occurring in the community phylogeny as our null model (i.e., all species ≥1 cm dbh in the 16 ha LFDP), which maintains the observed species richness but does not constrain species occurrence frequencies [54]. This null model is appropriate for examining changes in phylogenetic structure in our system, over the spatial and temporal scales of interest, since seedlings were expected to be a subset of the adult trees present in the 16 ha LFDP. Given that the phylogenetic signal in species abundance can influence the patterns of phylogenetic structure [55], we tested for, and found no evidence of, a phylogenetic signal in species abundance in any census (all values of Blomberg’s K < 0.61 and not significant based on randomization tests with α = 0.05). Phylogenetic analyses were carried out using the ‘picante’ package for R [56].
To examine temporal shifts in phylogenetic structure of the seedling community over the decade following Hurricane Georges, we used non-parametric Kruskal-Wallis rank sum tests to determine if values of NRI and NTI varied significantly among census years. When significant variation among years was found, we then tested for significant differences between individual pairs of years using paired Wilcoxon signed rank tests with p-values adjusted for multiple comparisons using the False Discovery Rate (FDR) method [57].
To examine the effect of land use history on phylogenetic community structure, we compared the NTI and NRI values for seedling plots in the high-intensity land use portion of LFDP versus seedling plots in the low-intensity land use portion of LFDP. We analyzed each census year separately, using Wilcoxon signed rank tests with p-values adjusted for multiple comparisons using the FDR method.
The most dominant species in the Luquillo forest is the palm Prestoea acuminata. The other palm species in the LFDP, Roystonia borinquena, is also relatively common. As palms, they are distantly related to most other species in the forest, and may therefore have a disproportionately large impact on patterns of phylogenetic community structure. Therefore, we recalculated all NRI and NTI values and repeated the above analyses after dropping palm species from the data set.

2.4. Phylogenetic Neighborhood Effects on Seedling Survival

To examine whether the phylogenetic structure of local neighborhoods influenced seedling dynamics, we used generalized linear mixed models (GLMMs) with binomial errors to model individual seedling survival as a function of the density and phylogenetic relatedness of seedlings within the same 2 × 1 m seedling plot for each census interval. The phylogenetic neighborhood of each individual was quantified as i = 1 S ( N i · P i j d ) , where S is the number of species present in the same seedling plot as the focal individual, N is the number of individuals of species i in that plot, and P is the phylogenetic relatedness of species i to the focal species j. P was calculated by computing the cophenetic distances between species and then scaling values from 0 to 1, with 1 indicating a conspecific. Therefore, the effect of a neighbor was strongest if it was the same species as the focal individual, and declined with decreasing phylogenetic relatedness as a function of the exponent d. We initially ran models using several different values of d (0.5, 1, 2, 3, 4), but found that these values all gave qualitatively similar results. Therefore, we only present results from models with d = 1 (i.e., a linear decrease with relatedness). In addition to the phylogenetic neighborhood, seedling height was included as a fixed effect. Species and seedling plot were included as random effects to account for species-specific variation in mortality rates and spatial variation in survival unrelated to neighbor density (i.e., spatial autocorrelation), respectively. We also ran the model including canopy openness (light) as a random effect that varied among species; however, it did not alter the effect of phylogenetic neighborhood on survival (data not shown). In order to determine whether significant effects of phylogenetic neighborhood on survival were predominantly due to effects of conspecific neighbors or total neighbor density, we used Akaike information criterion (AIC) to compare the phylogenetic neighborhood models to models that substituted the density of either conspecific seedling neighbors or all seedlings neighbors in the 2 × 1 m plot in place of the phylogenetic neighborhood. GLMMs were fit using the ‘lme4’ package for R [58].

2.5. Temporal Variation in Community Mean Seed Mass

We used data on species’ mean seed mass to examine whether effects of disturbance on phylogenetic community structure were likely driven by species’ differential life history strategies. As previously reported [22], closely related species in the Luquillo forest have significantly more similar values of seed mass than expected by chance (i.e., significant phylogenetic signal in seed mass). For each species, between 20 and 200 seeds (depending on seed size and species abundance) were collected from a network of 120 seed traps located throughout the 16 ha LFDP and taken back to the lab where they were dried at 60 °C for several hours before weighing. Seed mass varied over several orders of magnitude among species and was highly skewed, therefore values were log-transformed before use in analysis. Each individual seedling was assigned the mean seed mass of its species. We then calculated the mean and variance of seed mass across all seedlings in the 150 seedlings plots in each census to assess community-wide changes over time in response to post-hurricane canopy dynamics. In addition, we constructed a trait dendrogram, analogous to a phylogenetic tree, and calculated abundance-weighted NRI and NTI values for each seedling plot in each census to determine whether patterns of seed mass structure mirrored patterns of phylogenetic structure. The trait dendrogram was constructed by first transforming the seed mass trait data, then using hierarchical clustering (UPGMA) on the trait distance matrix. We tested for significant variation among years in seed mass NRI/NTI values using Kruskal-Wallis tests. When significant variation among years was detected, differences between individual years were then tested using paired Wilcoxon-signed rank tests with p-values adjusted for multiple comparisons (see above). Seed mass analyses were performed using the ‘picante’ package in R [58]. All analyses were run using the R statistical package [59].

3. Results

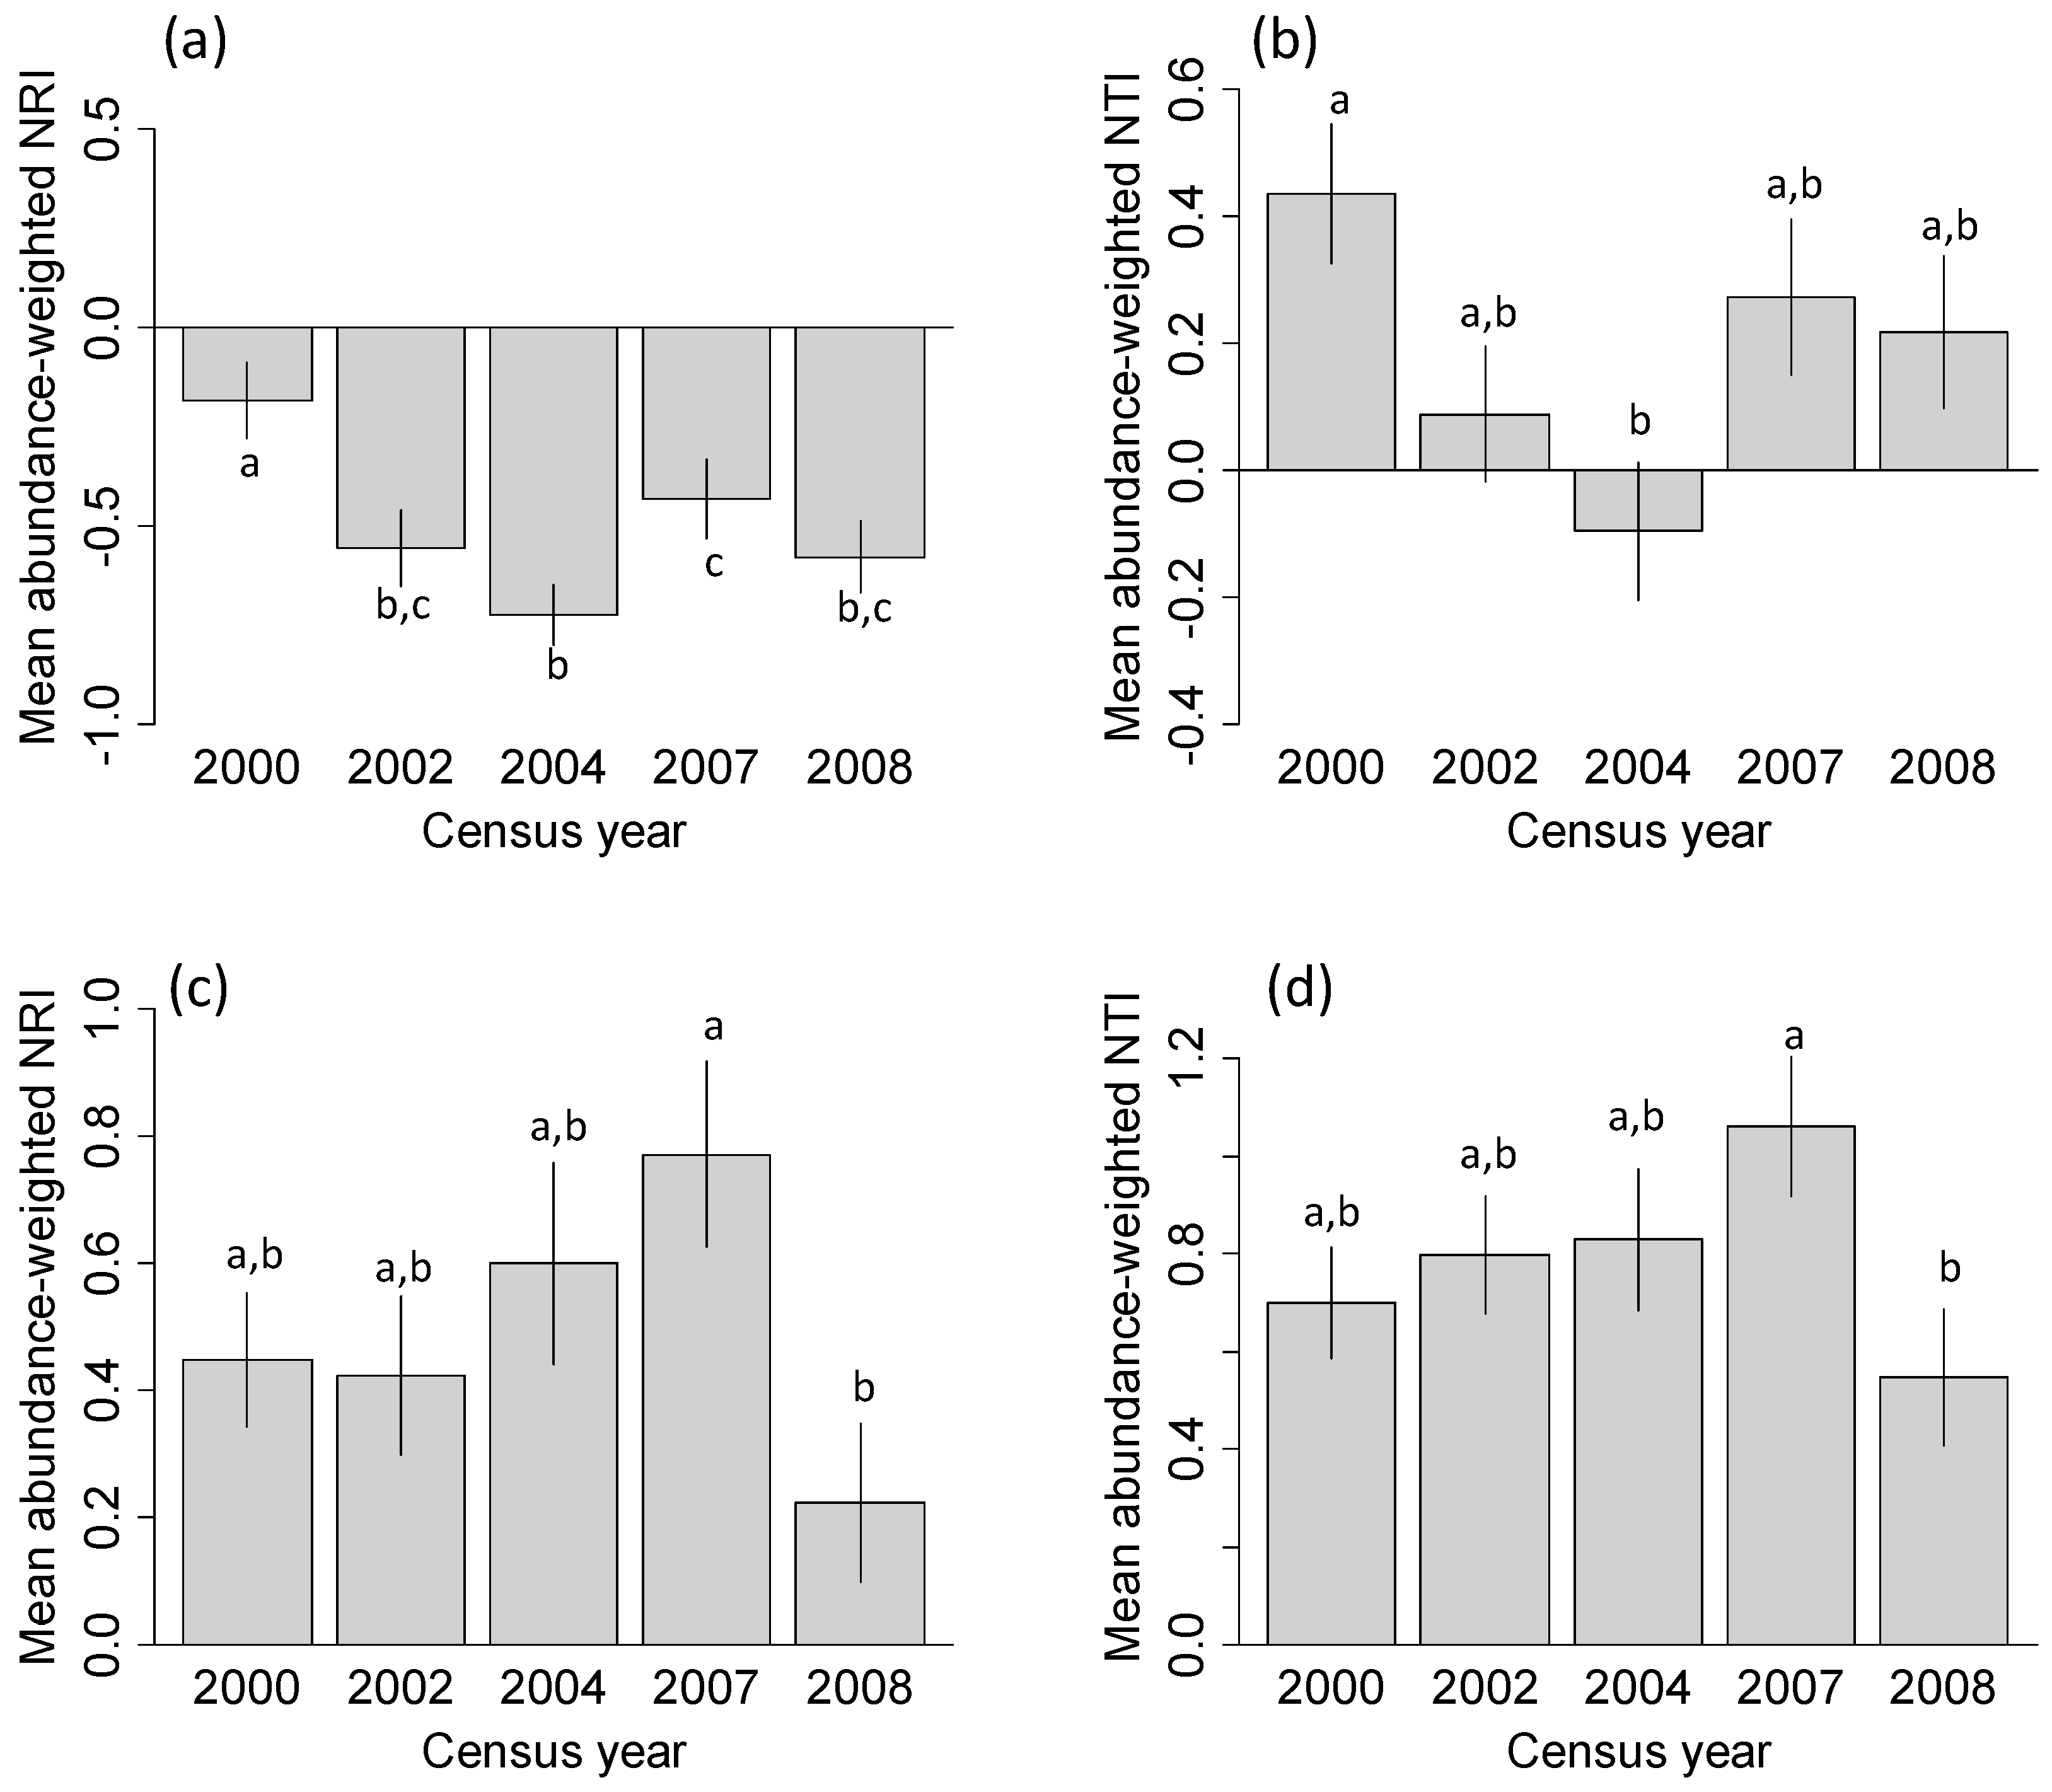
3.1. Phylogenetic Community Structure Following Hurricane Disturbance

We found significant variation in phylogenetic structure among years, as seen in Figure 1, for both indices (For NRI, Kruskal-Wallis chi-squared = 26.7238, df = 4, p-value < 0.001; for NTI Kruskal-Wallis chi-squared = 15.8741, df = 4, p-value = 0.003). Values of NRI tended to be negative in all years, while values of NTI tended to be positive. However, both indices showed the same pattern over time: Mean abundance-weighted NRI and NTI values were highest in the 2000 census, decreased from 2000 to 2004, and then increased between 2004 and 2008, as seen in Figure 1a,b. Thus, over the study period, individuals within seedling plots tended to be most closely related in the first census following hurricane disturbance and least related ~five years after the hurricane.
However, when palm species were dropped from the data set, this pattern changed substantially. Specifically, values of both NRI and NTI tended to increase slightly over time when palms were excluded, up until the final census when values dropped significantly, shown in Figure 1c,d.

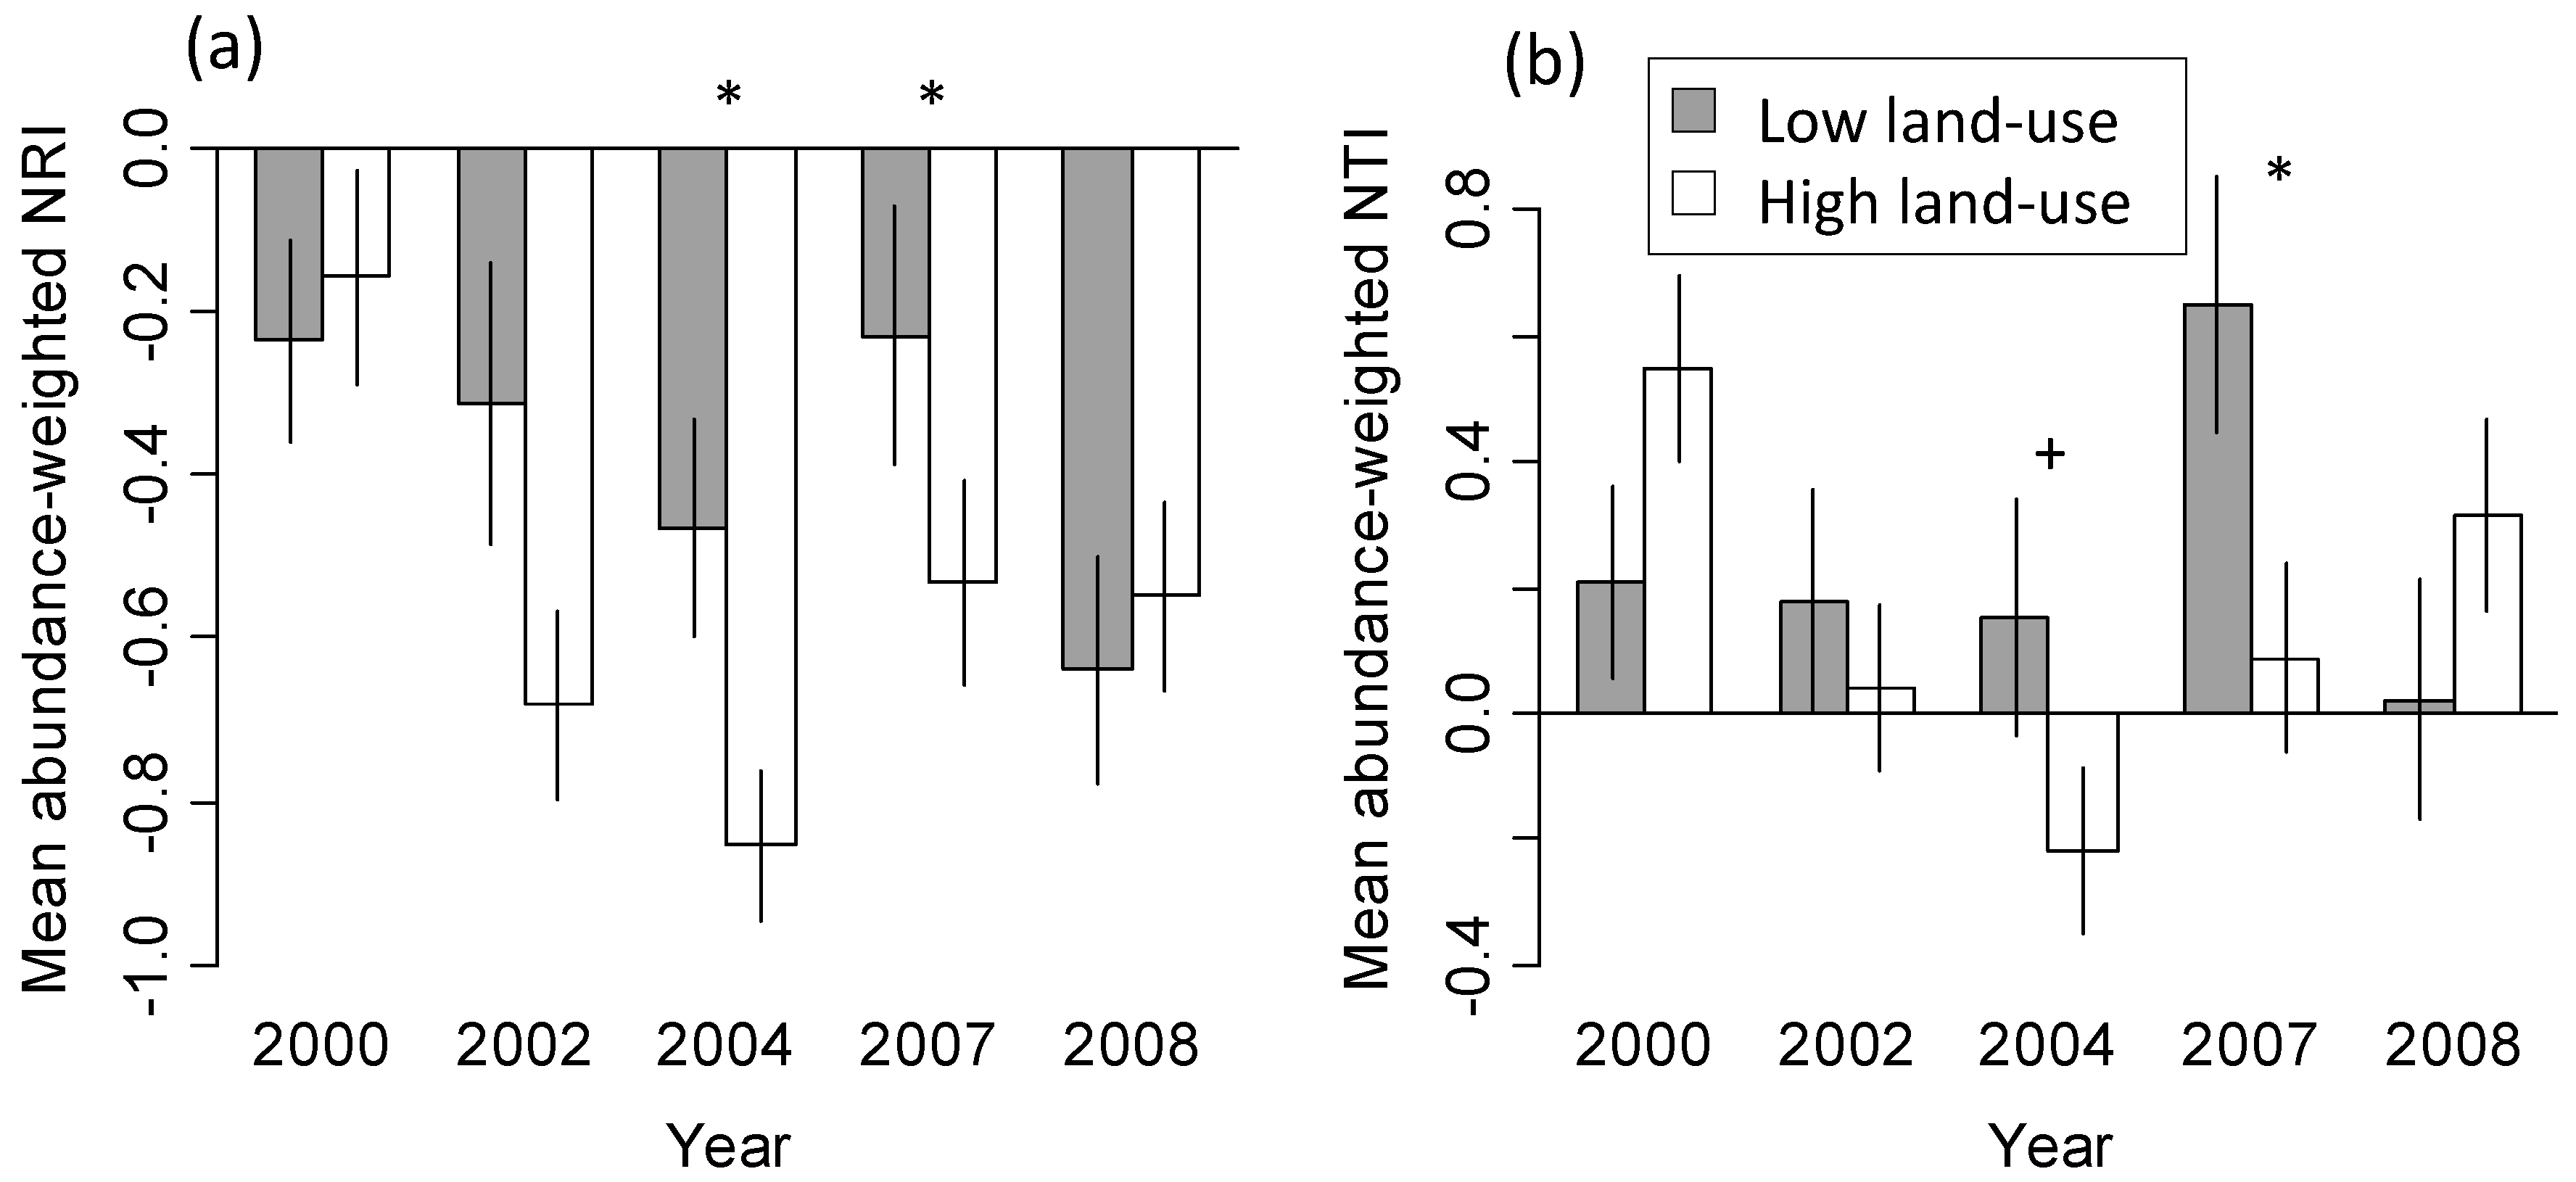
3.2. Phylogenetic Community Structure and Land-Use History

Mean values of NRI and NTI within seedling plots differed significantly between the high-intensity and low-intensity land-use categories for two of the five census years (2004 and 2007; Figure 2). In those years, both indices indicated that seedlings were more closely related to each other in plots in the low-intensity land-use history area than in the area that had experienced high-intensity land-use prior to 1934. When palm species were excluded, significant differences between land-use history categories in NRI and NTI values were detected not only in 2004 and 2007, but also in 2002, as seen in Figure S2, again with higher phylogenetic clustering in the low-intensity land-use history area compared to the high-intensity land-use area.

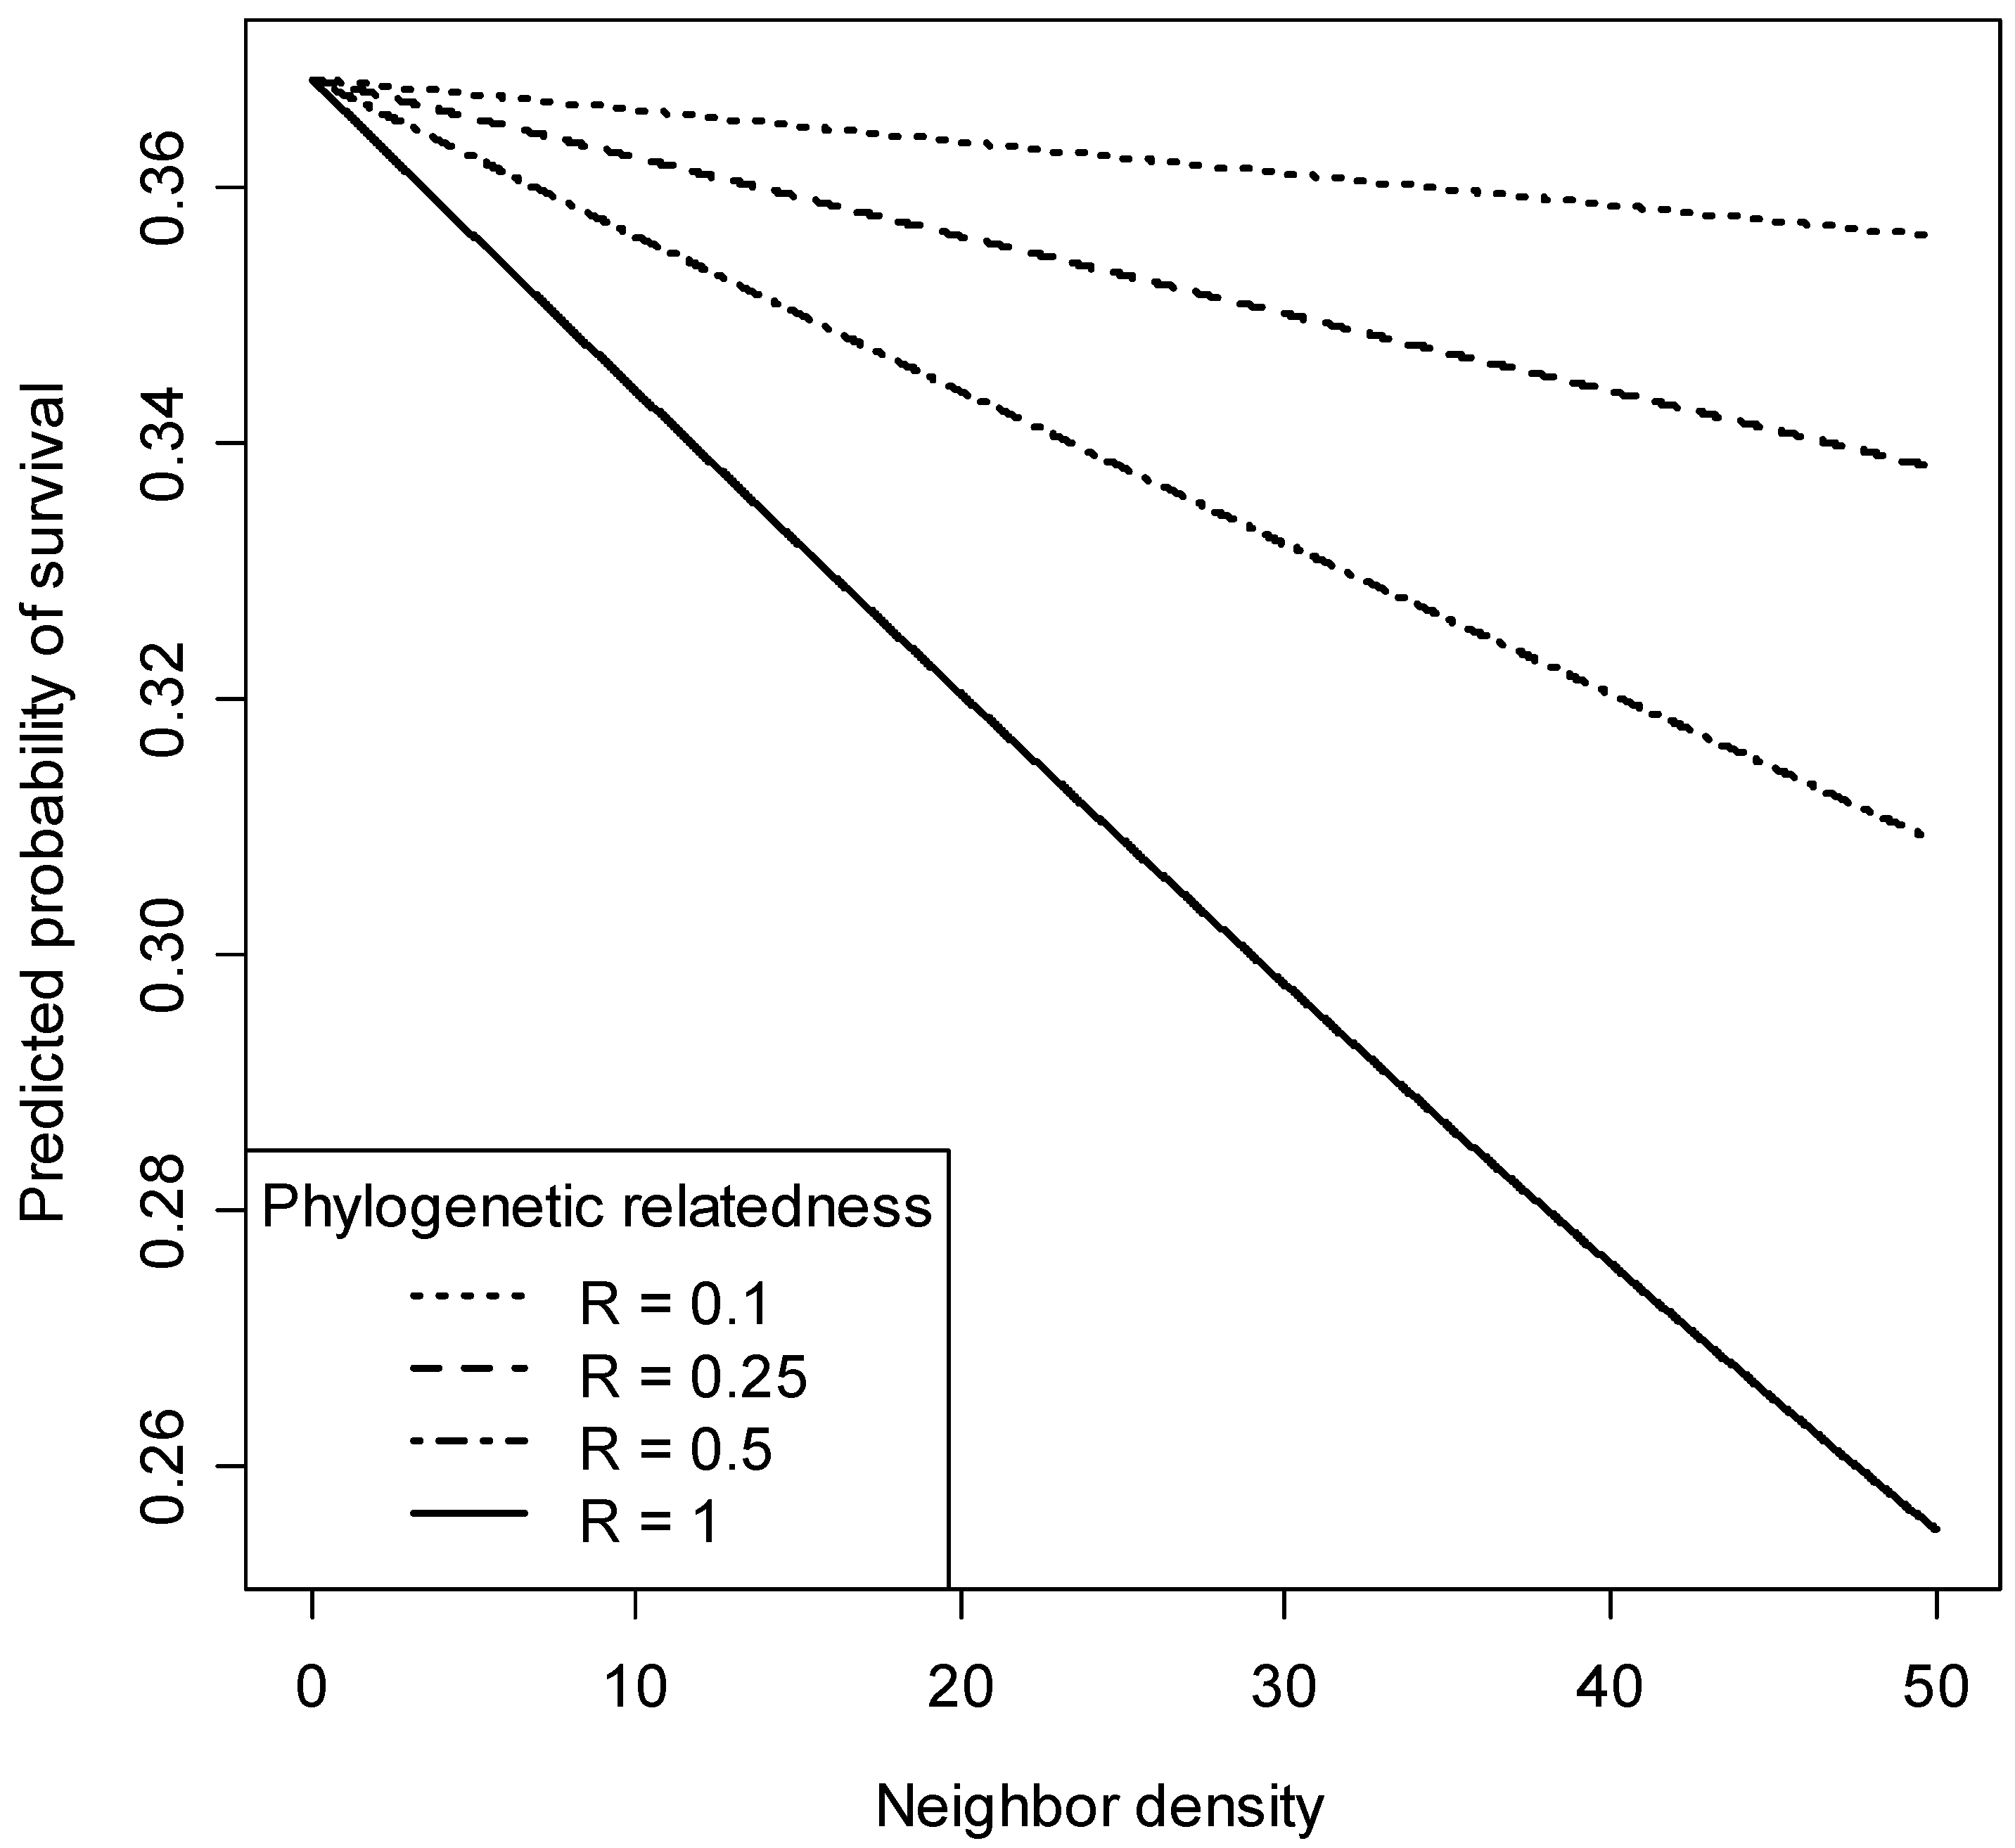
3.3. Phylogenetic Neighborhood Effects on Seedling Survival

We found a significant effect of the density and phylogenetic relatedness of neighbors on seedling survival over each of the first three census intervals (p < 0.05 for 2000–2002, 2002–2004, 2004–2007), but not in the final census interval (2007–2008, Table 1). In the first three censuses, the probability of survival declined with increasing density and relatedness of neighboring seedlings, as seen in Figure 3). For the 2000–2002 interval, the model that included density and phylogenetic relatedness of all neighbors performed better at predicting seedling survival than did the model that only included conspecific neighbor density, shown in Table 1, even when palm species were excluded from the analyses, shown in Table S1. This indicates that seedlings were negatively affected not only by seedlings of their own species but also by seedlings of closely related species that were present in the same seedling plot. AIC values were similar for both the phylogenetic and conspecific models in the 2002–2004 and 2004–2007 intervals, with the conspecific model performing slightly better in 2002–2004 and the phylogenetic model performing slightly better in the 2004–2007 interval, as seen in Table 1.

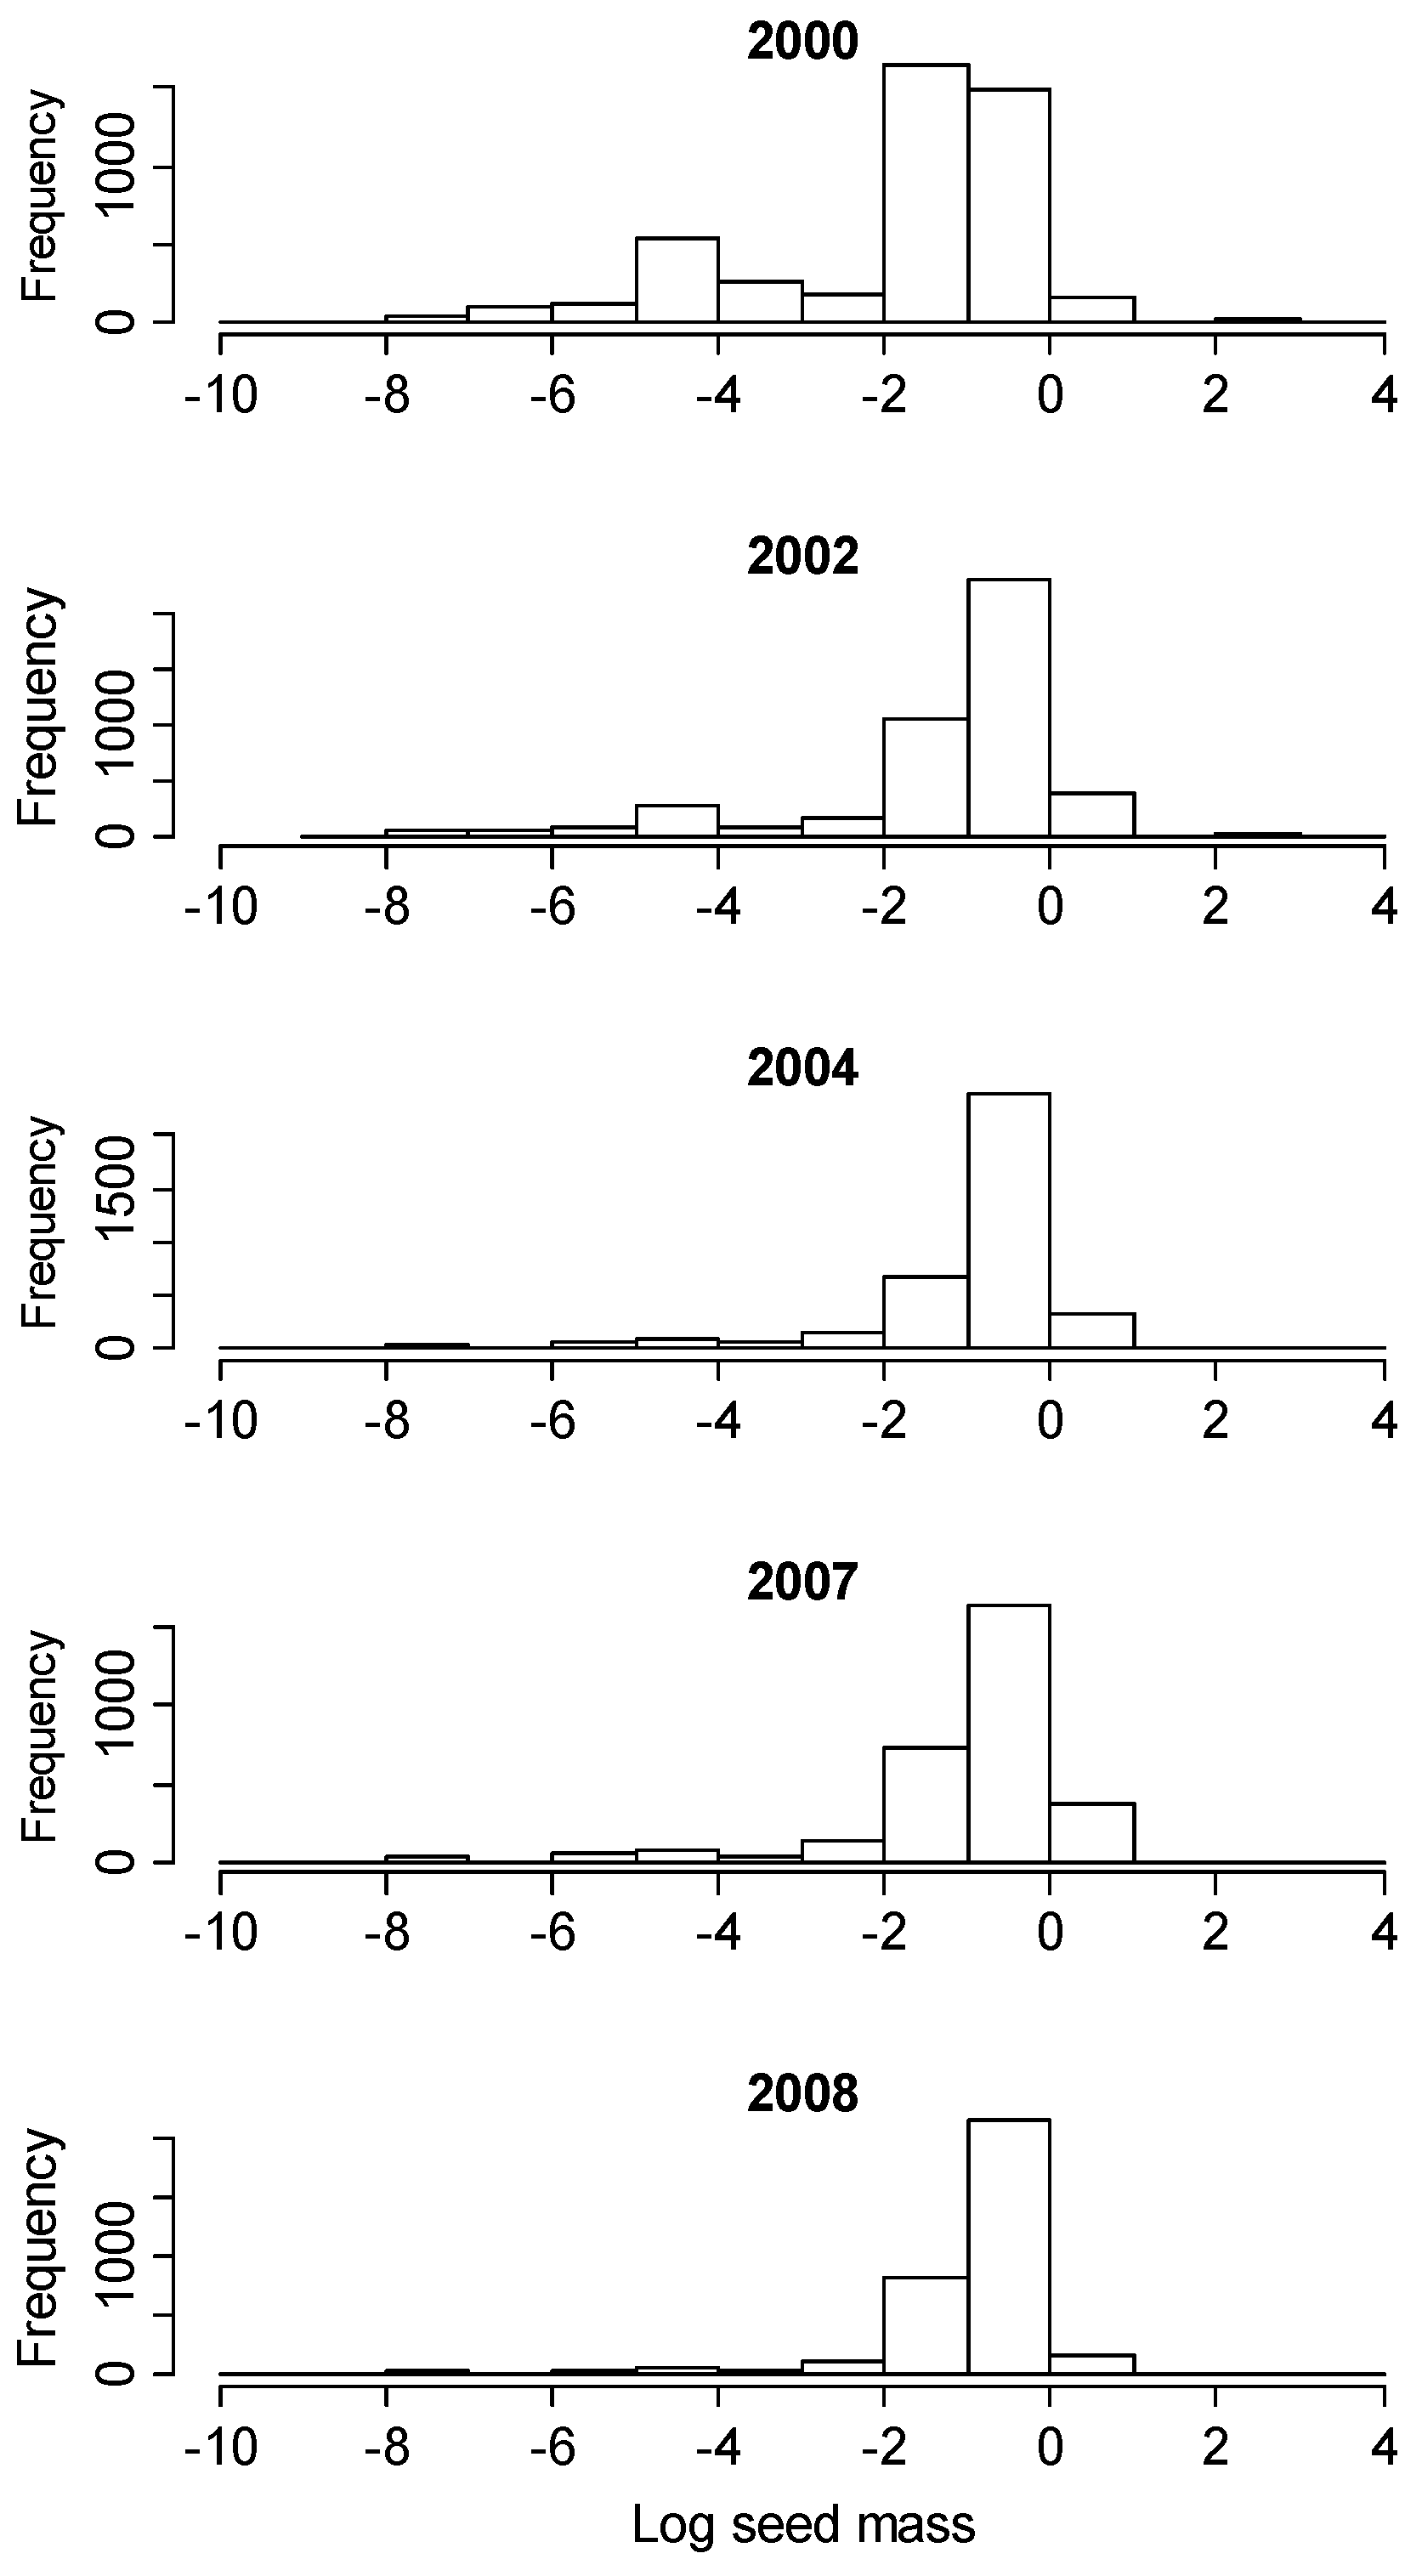
3.4. Changes in Seed Mass Values Following Hurricane Disturbance

In all years, the seedling community was dominated by individuals of relatively large-seeded species, as demonstrated by the left-skewed distributions of seed sizes shown in Figure 4. Variation in seed mass among seedlings was greatest in the initial census in 2000 (variance = 3.50) and decreased in each subsequent census (2002: var = 2.77, 2004: var = 2.11, 2007: var = 2.04, 2008: var = 1.72). This suggests that the heterogeneous conditions immediately following the hurricane permitted the recruitment of species with a wide variety of life history strategies, but the effect did not persist. This pattern was largely a result of an elevated number of seedlings of species with low seed mass in the 2000 seedling census, as seen in Figure 4.
Within seedling plots, patterns of structure in seed mass values varied significantly among census years for NRI (Kruskal-Wallis chi-squared = 56.7, df = 4, p < 0.001), but not NTI (Kruskal-Wallis chi-squared = 7.81, df = 4, p = 0.10). Values of NRI and NTI for seed mass steadily increased over each census interval, as seen in Figure 5, indicating that seedling plots were increasingly occupied by seedlings of species with more similar seed mass values. In all censuses, seedlings had more similar values of seed mass than expected (compared to the null model), as indicated by positive NRI and NTI values shown in Figure 5. Patterns of NRI and NTI for seed mass were largely consistent when palm species were dropped from the analysis, as seen in Figure S3.

4. Discussion

We used a well-resolved community phylogeny coupled with long-term seedling dynamics data to improve our understanding of forest regeneration processes following disturbance. We found evidence that the phylogenetic structure of the seedling community shifted over time as the forest recovered from hurricane disturbance. Our analyses revealed that the direction and pattern of these changes in phylogenetic structure depended strongly on whether palm species at the site were included in the analysis. We also found evidence that changes in phylogenetic community structure were shaped by both the abiotic environment and biotic interactions in the seedling community. Specifically, seedlings of small-seeded, light-demanding species, which had been able to recruit under the high light conditions created by hurricane disturbance, decreased in abundance over time as the canopy recovered and light levels dropped. At the same time, the high densities of seedlings present immediately post-hurricane led to significant conspecific and phylogenetic density-dependent mortality, reducing phylogenetic relatedness of co-occurring seedlings. In addition, our study revealed that the signature of past anthropogenic impacts were still present in the phylogenetic structure of the seedling community, even decades after human land use ceased.

4.1. Phylogenetic Community Dynamics Following Hurricane Disturbance

Phylogenetic relatedness in the seedling community was highest in the first census following Hurricane Georges. Following that census, seedling phylogenetic relatedness declined, reaching a minimum ~five years post-hurricane, before increasing again. Comparing patterns of phylogenetic community structure with and without palm species (Figure 1a,b vs. Figure 1c,d) revealed that the observed changes in phylogenetic relatedness were driven by changes in the abundance of palm species. In particular, the palm Prestoea acuminata doubled in relative abundance in the seedling plots between 2000 and 2002, becoming the most abundant species in the seedling layer. Because palms are distantly related to most other species in the Luquillo forest, this increase in palm seedling abundance caused a sharp decrease in mean phylogenetic relatedness in the seedling community, particularly across the first census interval. Although Prestoea acuminata clearly recruits well under the high light conditions created by hurricane damage, it is a relatively large seeded species. This explains why patterns of phylogenetic community structure did not match patterns of mean seed mass over time when palms were included in the analyses.
When palms were excluded, phylogenetic relatedness tended to increase over time, before dropping significantly in the final census interval (Figure 1c,d). This increase in phylogenetic relatedness in the years following the hurricane was likely driven by decreased abundance of light-demanding species that had recruited in response to higher understory light resulting from hurricane damage to the canopy. Understory light levels were nearly four times higher in the Luquillo forest six months after Hurricane Georges compared to during seedling censuses 3–9 years later [29]. Small-seeded, light-demanding pioneer species responded strongly to the high light conditions found immediately after the hurricane, recruiting in higher densities than in other years. For example, seedlings of the pioneer species Cecropia schreberiana were only recorded in the seedling plots in the initial census in 2000. Other small-seeded, light-demanding species, such as Psychotria brachiata and Schefflera morototoni, were relatively common in the 2000 seedling census but had declined sharply in relative abundance by the subsequent census. Although we lack data on seedling abundances prior to the hurricane, such a high abundance of small-seeded, light-demanding seedlings were not present beneath the largely intact forest canopy that existed before the hurricane (JT, personal observation). As seedlings of these light-demanding species either grew quickly into larger size classes or died out as light levels dropped due to canopy closure, the relative abundance of more shade-tolerant species increased. For example, several large-seeded, late-successional species, such as Dacryodes excelsa and Tetragastris balsamifera, had substantially higher seedling densities in later censuses compared to the 2000 census. This shift towards larger-seeded, shade-tolerant species can be seen in our community-level analysis of mean seed mass values, which revealed higher abundance of seedlings of small-seeded species in the initial census compared to later censuses (Figure 4). At the scale of the seedling plots, this led to higher similarity of seed mass values over time following the hurricane, at least for NRI (Figure 5a). Similarly, other studies in Puerto Rico showed consistent increases in functional clustering [60,61]. This increasing functional clustering in the seedling plots appears to contribute to the post-hurricane dynamics of phylogenetic community structure when palms are excluded (i.e., similar temporal patterns of phylogenetic structure in Figure 1c,d and of seed mass structure in Figure S3a). While we attribute these changes to the effects of increased canopy openness due to hurricane damage, we also acknowledge that temporal changes in phylogenetic structure could be influenced by additional factors, such as inter-annual climatic variation [62].
Our survival model results suggest that species interactions are also shaping the phylogenetic structure of the seedling community. Specifically, we found evidence of phylogenetic density-dependent seedling mortality, particularly in the first census interval following Hurricane Georges when seedling densities were elevated due to increased canopy openness [29]. Specifically, mortality was higher for seedlings surrounding by seedling neighbors of their own or closely related species (versus distantly related neighbors). The negative effect of closely related neighbors most likely results from the fact that closely related species tend to have similar resource requirements or be susceptible to the same natural enemies [32], leading to strong resource competition or enemy-mediated apparent competition among closely related plant species [63] (reviewed by [64]). Similar negative phylogenetic neighborhood effects have been reported in other tropical forests. For example, similar results were reported by Webb et al. [34], Metz et al. [35] and Paine et al. [36] for seedlings in Borneo, Ecuador, and French Guiana, respectively, supporting the idea that the phylogenetic composition of local neighborhoods influences regeneration dynamics in tropical forests (but see [65]). However, our results contrast with those of a study of tree growth and survival, also conducted in the LFDP, which found little evidence that the phylogenetic relatedness of neighbors had a strong impact on performance of saplings and trees ≥1 cm dbh [22]. Thus, phylogenetic neighborhood effects appear to be strongest at earlier life stages in the Luquillo forest. Interestingly, this result contrasts with findings from the tropical forest of Barro Colorado Island, Panama (which does not experience hurricane disturbance), where negative effects of neighborhood phylogenetic relatedness on survival were found for adult trees, but not seedlings [66]. In the present study, we detected strong negative phylogenetic neighborhood effects on seedling survival only in the first few years following the hurricane, indicating temporal variation in the strength of such effects. Thus, our study contributes to a growing consensus that patterns of phylogenetic density dependence can vary both within sites (i.e., with life stage and temporally), as well as across sites (e.g., [67]).

4.2. Signature of Past Land-Use on Phylogenetic Community Structure

In addition to impacts of natural disturbance on phylogenetic community structure, we also found that the phylogenetic structure of the seedling community differed significantly between areas that had experienced different intensities of past human disturbance. Specifically, seedling communities in areas of high-intensity past land use were similar to or less phylogenetically clustered than those in areas of lower-intensity past land use (both with and without palm species included). These findings are opposite to findings of previous studies examining the impacts of past human disturbance on plant communities (e.g., [13,15,18,68,69]), which generally found that human disturbance tended to homogenize not only the phylogenetic composition but also the functional and taxonomic composition of tree communities [15].
The discrepancy between results of previous studies and our present study may be due to the interaction between land-use history and hurricane disturbance at our study site, shaping patterns of both disturbance and recovery. Earlier studies of the Luquillo forest have shown that the two areas differing in land use history in the LFDP respond distinctly to hurricanes [70,71,72]. Specifically, anthropogenic disturbance increases the proportion of secondary species, which are often more vulnerable to storm damage [73]. Thus the high-intensity past land use area of the plot experienced more canopy damage in Hurricane Georges than the low-intensity area, leading to higher and more variable understory light levels in the high-intensity area [74]. These differences likely influenced recruitment patterns and phylogenetic structure after the hurricane. Indeed, while the two areas showed qualitatively similar patterns of seedling phylogenetic structure over time, the magnitude of temporal change was different (Figure 2). The greater hurricane damage in the high-intensity land use area may have sustained a mix of early successional and late successional species in the seedling community in the years following hurricane disturbance, which resulted in the higher observed phylogenetic overdispersion than in the low-intensity land use portion of the LFDP, which suffered less damage and thus had a more homogenous understory.

5. Conclusions

Our results reveal how disturbance can impact both the abiotic and biotic environment, causing changes in phylogenetic and functional community structure over space and time. Our study focuses on a single life stage but suggests that both human and natural disturbance influence the phylogenetic structure of ecological communities and that their effects are interactive. Understanding the impacts of disturbance on forest communities, as well as the underlying processes driving forest recovery, is critical given that the frequency of some types of severe natural disturbances (e.g., hurricanes, droughts) is predicted to increase due to climate change [75,76]. In addition, an increasing proportion of forested area is made up of secondary forest recovering from past human disturbance [77]. Understanding the implications of past human land use for phylogenetic diversity (and thus evolutionary history and potential), as well as how human disturbance interacts with natural disturbances, should be a key research priority. Recent disturbance events, such as Hurricanes Irma and Maria in the Caribbean [78] and droughts and fires in the Neotropics and Southeast Asia due to the severe 2015–2016 El Niño event [79], offer the opportunity for studies that will increase our understanding of forest disturbance and recovery in a changing world.

Supplementary Materials

The following are available online at https://www.mdpi.com/1999-4907/9/9/556/s1, Figure S1: DNA barcode phylogeny for the Luquillo Forest Dynamics Plot; Figure S2: Mean phylogenetic relatedness of seedlings after excluding palm species; Figure S3: Mean similarity of seed mass values of seedlings after excluding palm species; Table S1: AIC values for neighborhood model comparisons with palm species excluded.

Author Contributions

Conceptualization, L.S.C. and M.U.; Methodology, J.T., N.G.S. and W.J.K.; Software, N.G.S.; Validation, J.T.; Formal Analysis, L.S.C.; Investigation, J.T., J.K.Z., W.J.K. and J.F.-M.; Resources, J.T., J.K.Z. and W.J.K.; Data Curation, J.T., J.F.-M. and L.S.C.; Writing—Original Draft Preparation, L.S.C.; Writing—Review & Editing, M.N.U., M.U., J.F.-M., W.J.K., N.G.S., J.T. and J.K.Z.; Visualization, L.S.C.; Supervision, M.U., J.T. and J.K.Z.; Project Administration, J.K.Z. and J.T.; Funding Acquisition, J.K.Z., J.T., M.U. and W.J.K.

Funding

This research was funded by the U.S. National Science Foundation (NSF) grant numbers DEB-0614659, DEB-9906713, DEB-0087214, and DEB-0516066 and by the Andrew W. Mellon Foundation, the Center for Tropical Forest Science, and the Smithsonian Institution Global Earth Observatories program. Additional support was provided by grants from NSF to the Institute for Tropical Ecosystem Studies, University of Puerto Rico, working with the International Institute of Tropical Forestry, for the Luquillo LTER Program. L.S.C. acknowledges fellowship support from the Earth Institute at Columbia University and the National Center for Ecological Analysis and Synthesis at the University of California, Santa Barbara. N.G.S. was supported by a National Science Foundation Postdoctoral Fellowship in Bioinformatics and a Center for Tropical Forest Science Research Grant. M.N.U was supported by a Postdoctoral Environmental Fellowship from the Yale Institute for Biospheric Studies.

Acknowledgments

We thank Andy Jones for help with phylogeny construction. We thank the LTER and LFDP technicians and volunteer assistants who worked on the seedling censuses. We thank three anonymous reviewers for suggestions that improved the manuscript.

Conflicts of Interest

The authors declare no conflict of interest.

References

  1. Sousa, W.P. The role of disturbance in natural communities. Annu. Rev. Ecol. Syst. 1984, 15, 353–391. [Google Scholar] [CrossRef]
  2. Canham, C.D.; Marks, P.L. The response of woody plants to disturbance patterns of establishment and growth. In The Ecology of Natural Disturbance and Patch Dynamics; White, P.S., Pickett, S.T.A., Eds.; Academic Press: New York, NY, USA, 1985; pp. 197–216. [Google Scholar]
  3. Grubb, P.J. The maintenance of species-richness in plant communities: The importance of regeneration niche. Biol. Rev. 1977, 52, 107–145. [Google Scholar] [CrossRef]
  4. Clark, J.S. Testing disturbance theory with long-term data: Alternative life-history solutions to the distribution of events. Am. Nat. 1996, 148, 976–996. [Google Scholar] [CrossRef]
  5. Connell, J.H. Diversity in Tropical Rain Forests and Coral Reefs. Science 1978, 199, 1302–1310. [Google Scholar] [CrossRef] [PubMed]
  6. Pacala, S.W.; Rees, M. Models suggesting field experiments to test two hypotheses explaining successional diversity. Am. Nat. 1998, 152, 729–737. [Google Scholar] [CrossRef] [PubMed]
  7. Loehle, C. Strategy Space and the Disturbance Spectrum: A Life-History Model for Tree Species Coexistence. Am. Nat. 2000, 156, 14–33. [Google Scholar] [CrossRef] [PubMed]
  8. Meiners, S.J.; Cadotte, M.W.; Fridley, J.D.; Pickett, S.T.A.; Walker, L.R. Is successional research nearing its climax? New approaches for understanding dynamic communities. Funct. Ecol. 2015, 29, 154–164. [Google Scholar] [CrossRef] [Green Version]
  9. Verdu, M.; Gomez-Aparicio, L.; Valiente-Banuet, A. Phylogenetic relatedness as a tool in restoration ecology: A meta-analysis. Proc. R. Soc. Lond. B Biol. Sci. 2012, 279, 1761–1767. [Google Scholar] [CrossRef] [PubMed] [Green Version]
  10. Verdú, M.; Pausas, J.G. Fire drives phylogenetic clustering in Mediterranean Basin woody plant communities. J. Ecol. 2007, 95, 1316–1323. [Google Scholar] [CrossRef] [Green Version]
  11. Knapp, S.; Kühn, I.; Schweiger, O.; Klotz, S. Challenging urban species diversity: Contrasting phylogenetic patterns across plant functional groups in Germany. Ecol. Lett. 2008, 11, 1054–1064. [Google Scholar] [CrossRef] [PubMed]
  12. Dinnage, R. Disturbance alters the phylogenetic composition and structure of plant communities in an old field system. PLoS ONE 2009, 4, e7071. [Google Scholar] [CrossRef] [PubMed]
  13. Letcher, S.G. Phylogenetic structure of angiosperm communities during tropical forest succession. Proc. R. Soc. Lond. B Biol. Sci. 2010, 277, 97–104. [Google Scholar] [CrossRef] [PubMed] [Green Version]
  14. Whitfeld, T.J.S.; Kress, W.J.; Erickson, D.L.; Weiblen, G.D. Change in community phylogenetic structure during tropical forest succession: Evidence from New Guinea. Ecography 2012, 35, 821–830. [Google Scholar] [CrossRef]
  15. Purschke, O.; Schmid, B.C.; Sykes, M.T.; Poschlod, P.; Michalski, S.G.; Durka, W.; Kühn, I.; Winter, M.; Prentice, H.C. Contrasting changes in taxonomic, phylogenetic and functional diversity during a long-term succession: Insights into assembly processes. J. Ecol. 2013, 101, 857–866. [Google Scholar] [CrossRef]
  16. Feng, G.; Svenning, J.C.; Mi, X.; Jia, Q.; Rao, M.; Ren, H.; Bebber, D.P.; Ma, K. Anthropogenic disturbance shapes phylogenetic and functional tree community structure in a subtropical forest. For. Ecol. Manag. 2014, 313, 188–198. [Google Scholar] [CrossRef]
  17. Pastore, A.I.; Scherer, B.P. Changes in community phylogenetic structure in a North American forest chronosequence. Ecosphere 2016, 7, e01592. [Google Scholar] [CrossRef] [Green Version]
  18. Norden, N.; Letcher, S.G.; Boukili, V.; Swenson, N.G.; Chazdon, R. Demographic drivers of successional changes in phylogenetic structure across life-history stages in plant communities. Ecology 2012, 93, S70–S82. [Google Scholar] [CrossRef]
  19. Whitmore, T.C. Canopy gaps and the two major groups of forest trees. Ecology 1989, 70, 536–538. [Google Scholar] [CrossRef]
  20. Swenson, N.G.; Enquist, B.J. Ecological and evolutionary determinants of a key plant functional trait: Wood density and its community. Am. J. Bot. 2007, 94, 451–459. [Google Scholar] [CrossRef] [PubMed]
  21. Queenborough, S.A.; Mazer, S.J.; Vamosi, S.M.; Garwood, N.C.; Valencia, R.; Freckleton, R.P. Seed mass, abundance and breeding system among tropical forest species: Do dioecious species exhibit compensatory reproduction or abundances? J. Ecol. 2009, 97, 555–566. [Google Scholar] [CrossRef]
  22. Uriarte, M.; Swenson, N.G.; Chazdon, R.L.; Comita, L.S.; Kress, W.J.; Erickson, D.; Forero-Montaña, J.; Zimmerman, J.K.; Thompson, J. Trait similarity, shared ancestry and the structure of neighbourhood interactions in a subtropical wet forest: Implications for community assembly. Ecol. Lett. 2010, 13, 1503–1514. [Google Scholar] [CrossRef] [PubMed] [Green Version]
  23. Moles, A.T.; Westoby, M. Cycle Seed size and plant strategy across the whole life. OIKOS 2006, 113, 91–105. [Google Scholar] [CrossRef]
  24. Westoby, M.; Leishman, M.; Lord, J. Comparative ecology of seed size and dispersal. Philos. Trans. R. Soc. Lond. Ser. B 1996, 351, 1309–1318. [Google Scholar] [CrossRef]
  25. Poorter, L.; Rose, S.A. Light-dependent changes in the relationship between seed mass and seedling traits: A meta-analysis for rain forest tree species. Oecologia 2005, 142, 378–387. [Google Scholar] [CrossRef] [PubMed]
  26. Muller-Landau, H.C. The tolerance—Fecundity trade-off and the maintenance of diversity in seed size. Proc. Natl. Acad. Sci. USA 2010, 107, 4242–4247. [Google Scholar] [CrossRef] [PubMed]
  27. Coomes, D.A.; Grubb, P.J. Colonization, tolerance, competition and seed-size variation within functional groups. Trends Ecol. Evol. 2003, 18, 283–291. [Google Scholar] [CrossRef]
  28. Grubb, P.J.; Metcalfe, J.D. Adaptation and inertia in the Australian tropical lowland rain-forest flora: Contradictory trends in intergeneric and intrageneric comparisons of seed size in relation to light demand. Funct. Ecol. 1996, 10, 512–520. [Google Scholar] [CrossRef]
  29. Comita, L.S.; Uriarte, M.; Thompson, J.; Jonckheere, I.; Canham, C.D.; Zimmerman, J.K. Abiotic and biotic drivers of seedling survival in a hurricane-impacted tropical forest. J. Ecol. 2009, 97, 1346–1359. [Google Scholar] [CrossRef]
  30. Verdú, M.; Rey, P.J.; Alcántara, J.M.; Siles, G.; Valiente-Banuet, A. Phylogenetic signatures of facilitation and competition in successional communities. J. Ecol. 2009, 97, 1171–1180. [Google Scholar] [CrossRef] [Green Version]
  31. Novotny, V.; Basset, Y.; Miller, S.E.; Weiblen, G.D.; Bremer, B.; Cizek, L.; Drozd, P. Low host specificity of herbivorous insects in a tropical forest. Nature 2002, 416, 841–844. [Google Scholar] [CrossRef] [PubMed] [Green Version]
  32. Gilbert, G.S.; Webb, C.O. Phylogenetic signal in plant pathogen-host range. Proc. Natl. Acad. Sci. USA 2007, 104, 4979–4983. [Google Scholar] [CrossRef] [PubMed] [Green Version]
  33. Cahill, J.F.; Kembel, S.W.; Lamb, E.G.; Keddy, P.A. Does phylogenetic relatedness influence the strength of competition among vascular plants? Perspect. Plant Ecol. Evol. Syst. 2008, 10, 41–50. [Google Scholar] [CrossRef]
  34. Webb, C.O.; Gilbert, G.S.; Donoghue, M.J. Phylodiversity-dependent seedling mortality, size structure, and disease in a Bornean rain forest. Ecology 2006, 87, S123–S131. [Google Scholar] [CrossRef]
  35. Metz, M.R.; Sousa, W.P.; Valencia, R. Widespread density-dependent seedling mortality promotes species coexistence in a highly diverse Amazonian rain forest. Ecology 2010, 91, 3675–3685. [Google Scholar] [CrossRef] [PubMed]
  36. Paine, C.E.T.; Norden, N.; Chave, J.; Forget, P.-M.; Fortunel, C.; Dexter, K.G.; Baraloto, C. Phylogenetic density dependence and environmental filtering predict seedling mortality in a tropical forest. Ecol. Lett. 2012, 15, 34–41. [Google Scholar] [CrossRef] [PubMed]
  37. Kress, W.J.; Erickson, D.L.; Swenson, N.G.; Thompson, J.; Uriarte, M.; Zimmerman, J.K. Advances in the use of DNA barcodes to build a community phylogeny for tropical trees in a Puerto Rican forest dynamics plot. PLoS ONE 2010, 5, e15409. [Google Scholar] [CrossRef] [PubMed]
  38. Boucher, D.H.; Vandermeer, J.H.; Mallona, M.A.; Zamora, N.; Perfecto, I. Resistance and resilience in a directly regenerating rainforest: Nicaraguan trees of the Vochysiaceae after Hurricane Joan. For. Ecol. Manag. 1994, 68, 127–136. [Google Scholar] [CrossRef]
  39. Walker, L.R. Tree damage and recovery from hurricane Hugo in Luquillo Experimental Forest, Puerto Rico. Biotropica 1991, 23, 379–385. [Google Scholar] [CrossRef]
  40. Bellingham, P.J.; Kapos, V.; Varty, N.; Healey, J.R.; Tanner, E.V.J.; Kelly, D.L.; Dalling, J.W.; Burns, L.S.; Lee, D.; Sidrak, G. Hurricanes need not causes high mortality: The effects of Hurricane Gilbert on forest in Jamaica. J. Trop. Ecol. 1992, 8, 217–223. [Google Scholar] [CrossRef]
  41. Bellingham, P.J.; Tanner, E.V.J.; Rich, P.M.; Goodland, T.C.R. Changes in light below the canopy of a Jamaican montane rainforest after a hurricane. J. Trop. Ecol. 1996, 12, 669–722. [Google Scholar] [CrossRef]
  42. Walker, L.R.; Lodge, D.J.; Guzman-Grajales, S.M.; Fetcher, N. Species-specific seedling responses to hurricane disturbance in a Puerto Rican rain forest. Biotropica 2003, 35, 472–485. [Google Scholar] [CrossRef]
  43. Norden, N.; Chazdon, R.L.; Chao, A.; Jiang, Y.-H.; Vilhez-Alvarado, B. Resilience of tropical rain forests: Tree community reassembly in secondary forests. Ecol. Lett. 2009, 12, 385–394. [Google Scholar] [CrossRef] [PubMed]
  44. Thompson, J.; Brokaw, N.; Zimmerman, J.K.; Waide, R.B.; Everham, E.M.I.; Schaefer, D.A. Luquillo forest dynamics plot, Puerto Rico, United States. In Tropical Forest Diversisty Dynamism Findings from a Large-Scale Plot Network; University of Chicago Press: Chicago, IL, USA, 2004; pp. 540–550. [Google Scholar]
  45. Ostertag, R.; Scatena, F.N.; Silver, W.L. Forest floor decomposition following hurricane litter inputs in several Puerto Rican forests. Ecosystems 2003, 6, 261–273. [Google Scholar] [CrossRef]
  46. Thompson, J.; Brokaw, N.; Zimmerman, J.K.; Waide, R.B.; Everham, E.M., III; Lodge, D.J.; Taylor, C.M.; García-Montiel, D.; Fluet, M. Land use history, environment, and tree composition in a tropical forest. Ecol. Appl. 2002, 12, 1344–1363. [Google Scholar] [CrossRef]
  47. Zimmerman, J.K.; Mitchell Aide Bt, T.; Rosario, M.; Serrano, M.; Herrera, L. Effects of land management and a recent hurricane on forest structure and composition in the Luquillo Experimental Forest, Puerto Rico. For. Ecol. Manag. 1995, 77, 65–76. [Google Scholar] [CrossRef]
  48. Foster, D.; Swanson, F.; Aber, J.; Burke, I.; Brokaw, N.; Tilman, D.; Knapp, A. The importance of land-use legacies to ecology and conservation. Bioscience 2003, 53, 77–88. [Google Scholar] [CrossRef]
  49. Uriarte, M.; Rivera, L.W.; Zimmerman, J.K.; Aide, T.M.; Power, A.G.; Flecker, A. Effects of land use history on hurricane damage and recovery in a neotropical forest. Plant Ecol. 2004, 174, 49–58. [Google Scholar] [CrossRef]
  50. Uriarte, M.; Canham, C.D.; Thompson, J.; Zimmerman, J.K.; Brokaw, N. Seedling recruitment in a hurricane-driven tropical forest: Light limitation, density-dependence and the spatial distribution of parent trees. J. Ecol. 2005, 93, 291–304. [Google Scholar] [CrossRef]
  51. Erickson, D.L.; Jones, F.A.; Swenson, N.G.; Pei, N.; Bourg, N.; Chen, W.; Davies, S.J.; Ge, X.; Hao, Z.; Howe, R.W.; et al. Comparative evolutionary diversity and phylogenetic structure across multiple forest dynamics plots: A mega-phylogeny approach. Front. Genet. 2014, 5, 1–14. [Google Scholar] [CrossRef] [PubMed]
  52. Cavender-Bares, J.; Kozak, K.H.; Fine, P.V.A.; Kembel, S.W. The merging of community ecology and phylogenetic biology. Ecol. Lett. 2009, 12, 693–715. [Google Scholar] [CrossRef] [PubMed] [Green Version]
  53. Webb, C.O. Exploring the phylogenetic structure of ecological communities: An example for rain forest trees. Am. Nat. 2000, 156, 145–155. [Google Scholar] [CrossRef] [PubMed]
  54. Kembel, S.W.; Hubbell, S.P. The phylogenetic structure of a neotropical forest tree community. Ecology 2006, 87, S86–S99. [Google Scholar] [CrossRef]
  55. Hardy, O.J. Testing the spatial phylogenetic structure of local communities: Statistical performances of different null models and test statistics on a locally neutral community. J. Ecol. 2008, 96, 914–926. [Google Scholar] [CrossRef]
  56. Kembel, S.W.; Ackerly, D.D.; Blomberg, S.P.; Cornwell, W.K.; Cowan, P.D.; Hel, M.R.; Morlon, H.; Webb, C.O. Picante: R tools for integrating phylogenies and ecology. Bioinformatics 2010, 26, 1463–1464. [Google Scholar] [CrossRef] [PubMed] [Green Version]
  57. Benjamini, Y.; Hochberg, Y. Controlling the false discovery rate: A practical and powerful approach to multiple testing. J. R. Stat. Soc. Ser. B 1995, 57, 289–300. [Google Scholar]
  58. Bates, D.; Mächler, M.; Bolker, B.M.; Walker, S.C. Fitting Linear Mixed-Effects Models using lme4. arXiv, 2014; arXiv:1046.5823. [Google Scholar]
  59. R Development Core Team. R: A Language and Environment for Statistical Computing; R Foundation for Statistical Computing: Vienna, Austria, 2017; Available online: https://www.R-project.org/ (accessed on 25 July 2018).
  60. Umaña, M.N.; Forero-Montaña, J.; Muscarella, R.; Nytch, C.J.; Thompson, J.; Uriarte, M.; Zimmerman, J.; Swenson, N.G. Interspecific functional convergence and divergence and intraspecific negative density dependence underlie the seed-to-seedling transition in tropical trees. Am. Nat. 2015, 187, 99–109. [Google Scholar] [CrossRef] [PubMed] [Green Version]
  61. Muscarella, R.; Uriarte, M.; Aide, T.M.; Erickson, D.L.; Forero-Montaña, J.; Kress, W.J.; Swenson, N.G.; Zimmerman, J.K. Functional convergence and phylogenetic divergence during secondary succession of subtropical wet forests in Puerto Rico. J. Veg. Sci. 2016, 27, 283–294. [Google Scholar] [CrossRef]
  62. Uriarte, M.; Muscarella, R.; Zimmerman, J.K. Environmental heterogeneity and biotic interactions mediate climate impacts on tropical forest regeneration. Glob. Chang. Biol. 2017, 24, e692–e704. [Google Scholar] [CrossRef] [PubMed]
  63. Bagchi, R.; Gallery, R.E.; Gripenberg, S.; Gurr, S.J.; Narayan, L.; Addis, C.E.; Freckleton, R.P.; Lewis, O.T. Pathogens and insect herbivores drive rainforest plant diversity and composition. Nature 2014, 506, 85–88. [Google Scholar] [CrossRef] [PubMed]
  64. Wright, S.J. Plant diversity in tropical forests: A review of mechanisms of species coexistence. Oecologia 2002, 130, 1–14. [Google Scholar] [CrossRef] [PubMed]
  65. Gonzalez, M.A.; Roger, A.; Courtois, E.A.; Jabot, F.; Norden, N.; Paine, C.E.T.; Baraloto, C.; Thébaud, C.; Chave, J. Shifts in species and phylogenetic diversity between sapling and tree communities indicate negative density dependence in a lowland rain forest. J. Ecol. 2010, 98, 137–146. [Google Scholar] [CrossRef] [Green Version]
  66. Zhu, Y.; Comita, L.S.; Hubbell, S.P.; Ma, K. Conspecific and phylogenetic density-dependent survival differs across life stages in a tropical forest. J. Ecol. 2015, 103, 957–966. [Google Scholar] [CrossRef] [Green Version]
  67. Chen, L.; Comita, L.S.; Wright, S.J.; Swenson, N.G.; Zimmerman, J.K.; Mi, X.; Hao, Z.; Ye, W.; Hubbell, S.P.; Kress, W.J.; et al. Forest tree neighborhoods are structured more by negative conspecific density dependence than by interactions among closely related species. Ecography 2017, 41, 1114–1123. [Google Scholar] [CrossRef]
  68. Letcher, S.G.; Chazdon, R.L.; Andrade, A.C.S.; Bongers, F.; van Breugel, M.; Finegan, B.; Laurance, S.G.; Mesquita, R.C.G.; Martínez-Ramos, M.; Williamson, G.B. Phylogenetic community structure during succession: Evidence from three Neotropical forest sites. Perspect. Plant Ecol. Evol. Syst. 2012, 14, 79–87. [Google Scholar] [CrossRef]
  69. Arnan, X.; Arcoverde, G.B.; Pie, M.R.; Ribeiro-Neto, J.D.; Leal, I.R. Increased anthropogenic disturbance and aridity reduce phylogenetic and functional diversity of ant communities in Caatinga dry forest. Sci. Total Environ. 2018, 631–632, 429–438. [Google Scholar] [CrossRef] [PubMed]
  70. Zimmerman, J.K.; Comita, L.S.; Thompson, J.; Uriarte, M.; Brokaw, N. Patch dynamics and community metastability of a subtropical forest: Compound effects of natural disturbance and human land use. Landsc. Ecol. 2010, 25, 1099–1111. [Google Scholar] [CrossRef]
  71. Lugo, A.E.; Helmer, E. Emerging forests on abandoned land: Puerto Rico’s new forests. For. Ecol. Manag. 2004, 190, 145–161. [Google Scholar] [CrossRef] [Green Version]
  72. Uriarte, M.; Canham, C.D.; Thompson, J.; Zimmerman, J.K.; Murphy, L.; Sabat, A.M.; Fetcher, N.; Haines, B.L. Natural disturbance and human land use as determinants of tropical forest dynamics: Results from a forest simulator. Ecol. Monogr. 2009, 79, 423–443. [Google Scholar] [CrossRef]
  73. Zimmerman, J.K.; Everham, E.M.; Waide, R.B.; Lodge, D.J.; Taylor, C.M.; Brokaw, N.V.L. Responses of tree species to hurricane winds in subtropical wet forest in Puerto Rico: Implications for tropical tree life-histories. J. Ecol. 1994, 82, 911–922. [Google Scholar] [CrossRef]
  74. Comita, L.S.; Thompson, J.; Uriarte, M.; Jonckheere, I.; Canham, C.D.; Zimmerman, J.K. Interactive effects of land use history and natural disturbance on seedling dynamics in a subtropical forest. Ecol. Appl. 2010, 20, 1270–1284. [Google Scholar] [CrossRef] [PubMed]
  75. Bonan, G.B. Forests and climate change: Forcings, feedbacks, and the climate benefits of forests. Science 2008, 320, 1444–1449. [Google Scholar] [CrossRef] [PubMed]
  76. Corlett, R.T. Climate change in the tropics: The end of the world as we know it? Biol. Conserv. 2012, 151, 22–25. [Google Scholar] [CrossRef]
  77. FAO (Food and Agriculture Organization). The State of the World’s Forests; FAO: Rome, Italy, 2017. [Google Scholar]
  78. Hu, T.; Smith, R.B. The Impact of hurricane Maria on the vegetation of Dominica and Puerto Rico using multispectral remote sensing. Remote Sens. 2018, 10, 827. [Google Scholar] [CrossRef]
  79. Liu, J.; Bowman, K.W.; Schimel, D.S.; Parazoo, N.C.; Jiang, Z.; Lee, M.; Bloom, A.A.; Wunch, D.; Frankenberg, C.; Sun, Y.; et al. Contrasting carbon cycle responses of the tropical continents to the 2015–2016 El Niño. Science 2017, 358, eaam5690. [Google Scholar] [CrossRef] [PubMed] [Green Version]
Figure 1. Mean phylogenetic relatedness of seedlings at the local neighborhood scale (2-m2 seedling plot). Panels (a,b) show mean abundance-weighted values of Net Relatedness Index (NRI) and Nearest Taxon Index (NTI), respectively, for the full data set. Panels (c,d) show the same metrics, but when palm species were excluded. Bars represent 1 s.e. and letters indicate differences between years within each panel. Positive and negative values indicate phylogenetic clustering and overdispersion, respectively.
Forests 09 00556 g001
Figure 2. Mean phylogenetic relatedness of seedlings within 2-m2 plots that experienced varying effects of past land use. Panels (a,b) show mean abundance-weighted values of Net Relatedness Index (NRI) and Nearest Taxon Index (NTI), respectively, for the full data set. Gray bars indicate results for seedling plots located in low-intensity land use portion of Luquillo Forest Dynamics Plot (LFDP) and white bars indicate results for seedling plots located in high-intensity land-use portion of LFDP. Stars (*) and pluses (+) indicate years where values differed between land use history categories at the α = 0.05 and α = 0.10 levels, respectively.
Forests 09 00556 g002
Figure 3. Effect of neighbor density on the probability of survival for a 10 cm tall seedling from 2000 to 2002 in the Luquillo Forest Dynamics Plot. Lines show the predicted relationship based on model results for different degrees of phylogenetic relatedness (R) between the focal individual and neighboring seedlings (with R = 1 for conspecifics).
Forests 09 00556 g003
Figure 4. Histograms showing the frequency of log-transformed seed mass values of seedlings in the 150 2 × 1 m seedling plots in the Luquillo Forest Dynamics Plot, Puerto Rico. Each seedling was assigned the mean seed mass value for its species.
Forests 09 00556 g004
Figure 5. Mean similarity of seed mass values of seedlings within 2-m2 seedling plots. Values of abundance-weighted Net Relatedness Index (NRI) (a) and abundance-weighted Nearest Taxon Index (NTI) (b) measure the functional similarity of individuals in each plot. Bars represent 1 s.e. and letters indicate differences between years for NRI. There was no significant variation among years for NTI.
Forests 09 00556 g005
Table 1. AIC values for model comparisons. Bold values indicate the best fit model (i.e., lowest AIC) for each census interval.
Census Interval
Model2000–20022002–20042004–20072007–2008
Null (No neighbors)5064.942670.03210.53106.5
Total neighbor density5063.14265.13210.73108.2
Conspecific neighbor density5060.44261.03183.83108.5
Phylogenetic density5049.84261.53182.33108.5

