Article

Selenium, Sulphur, Trace Metal, and BTEX Levels in Soil, Water, and Lettuce from the Croatian Raša Bay Contaminated by Superhigh-Organic-Sulphur Coal

by
Gordana Medunić
1,*,
Željka Kuharić
2,
Adela Krivohlavek
2,
Marija Đuroković
3,
Kristina Dropučić
3,
Ankica Rađenović
4,
Borna Lužar Oberiter
1,
Aleksandra Krizmanić
5 and
Mladen Bajramović
6
1
Department of Geology, Faculty of Science, University of Zagreb, 10000 Zagreb, Croatia
2
Andrija Štampar Teaching Institute of Public Health, 10000 Zagreb, Croatia
3
Department for Binders and Ecology, Institute IGH d.d., 10000 Zagreb, Croatia
4
Faculty of Metallurgy, University of Zagreb, 44000 Sisak, Croatia
5
Department of Biology, Faculty of Science, University of Zagreb, 10000 Zagreb, Croatia
6
Istrian Coal Mines Raša (IUR), 21100 Raša, Croatia
*
Author to whom correspondence should be addressed.
Geosciences 2018, 8(11), 408; https://doi.org/10.3390/geosciences8110408
Submission received: 10 October 2018 / Revised: 31 October 2018 / Accepted: 6 November 2018 / Published: 8 November 2018
(This article belongs to the Special Issue Geochemical Equilibrium and Processes in Seawater)

Abstract

:
This paper elaborates soil, water, and lettuce contamination status with respect to selenium, sulphur, trace metals, and BTEX (benzene, toluene, ethylbenzene, and xylenes) in a coal-based area (Raša Bay, Adriatic Sea, Croatia). A local coal-fired power plant polluted soil with S, Se, Cd, and PAHs due to the combustion of domestic superhigh-organic-sulphur coal. The locality is dotted with waste from coal mining/separation, coal combustion, former metal factories, untreated municipal and coal mine effluents, along with various harbour activities, which contribute to environmental contamination. The methodology involved ICP-MS and GC-MS for the measurement of trace elements and BTEX, respectively, while soil sulphur was determined with Eschka’s mixture. The max values of the analysed trace elements in soil (mg/kg) are reported: Hg 1.14, Cd 3.29, V 624, Se 10.3, Pb 872, Cr 1860, Zn 6580, Cu 1850, and U 25.2. According to ecological indices, these values fall into the category of an extremely high level of soil pollution. Elevated total Se values in surface water are ascribed to leaching of seleniferous coal, ash, and coal-polluted soil. Levels of BTEX in water samples were very low (0–0.83 µg/L). The data provide basic information on the inorganic and organic contamination status of the Raša Bay area.

Graphical Abstract

1. Introduction

Coal mining and ash-generating processes like coal combustion, smelting, and metal foundry are the predominant sources of various potentially toxic emissions [1] which pollute the atmosphere, pedosphere, hydrosphere, and biosphere [2]. They are represented by complex mixtures, which include particle matter, semi-volatile matter, and various gases [3]. Owing to implementation of clean coal technologies [4] and strict environmental regulations, air pollutant concentrations have generally declined in western Europe and North America since the late 20th century, but they are increasing in industrializing areas of Asia and Africa. Fossil fuel combustion has been the largest single source of mercury (Hg), nickel (Ni), tin (Sn), and vanadium (V), and the second-largest global source of cadmium (Cd), stibnium (Sb), selenium (Se), and thallium (Tl) emissions [5]. These contaminants are being washed out by precipitation into nearby land, which becomes degraded through chemical changes. To estimate their relative enrichment in soil, various quantitative measures are applied on their respective total levels, by comparing them with natural concentrations. These are called ecological risk assessment indices (described in the Methods section).
Organic micropollutants such as BTEX (benzene, toluene, ethylbenzene, and xylene) are important petrochemical materials typically derived from gasoline and diesel fuel. They were found in Sava and Bosna river sediments following a catastrophic flood in eastern Croatia and northern Bosnia in 2014 [6]. These environmental contaminants are often associated with wastewater due to poor wastewater management practices in the mentioned countries.
Croatia is a Central European country, renowned for the karstic Adriatic coast which attracts millions of visitors and tourists per year. One of its components is the Istrian Peninsula, a large (3500 km2) triangular piece of land, pointing down into the northern Adriatic Sea (Figure 1).
The historic (back to 18th century) coal mining and utilisation, as well as the associated foundry industries, were located in the Labin city area (45°06′ N 14°07′ E; population 22,658), some 3 km away from the Adriatic Sea (Figure 1A). The Istrian coal syncline, stretching from Trieste (Italy) to Koromačno (southern tip of the peninsula), is composed of six coal basins. One of them is the Labin basin, where coal miners had excavated 40 Mt of coal by 1999, when the mining ceased. Istrian coal is known as superhigh-organic-sulphur (SHOS) Raša coal, characterised by an unusually high amount of sulphur (organic form), up to 14% [7], and increased Se, V, and U [8]. It largely powered Italian industry 100 years ago, as well as local Labin households and factories. During the period 1970–2000, it was used in a sole Croatian coal-fired power plant (PPP, Figure 1A). This has resulted in the pollution of local soil with S, PAHs, Se, and Cd [9], exhibiting phytotoxicity [10], and prominent soil REE patterns [11]. The Labin area is composed of acid-vulnerable karst terrain, which is highly susceptible to pollution due to its complex hydrodynamics and low filtration capacity. Coastal marine systems are particularly vulnerable to contamination by numerous pollutants transported to them by rivers or directly discharged into them [12].
This paper reports levels of S, Sr, Se, As, Al, Fe, Mn, selected trace metals (V, U, Hg, Cd, Pb, Cr, Zn, Cu and Co), and BTEX in the main environmental media (topsoil, stream sediment, and surface fresh- and seawater), and locally grown lettuce from the Labin city area. Sampling locations were selected primarily with respect to historic Raša coal mines and a separation unit, ash waste disposal sites, a former foundry locality, an abandoned machine tool factory, an active chrome plate factory, and today’s insufficiently treated municipal wastewater effluents (MWE), as well as coal mine effluents discharged in local streams. The potential risks for environmental quality were assessed by calculating various ecological indices.

2. Materials and Methods

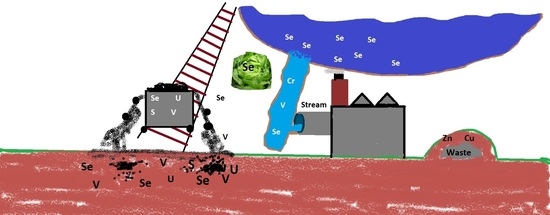
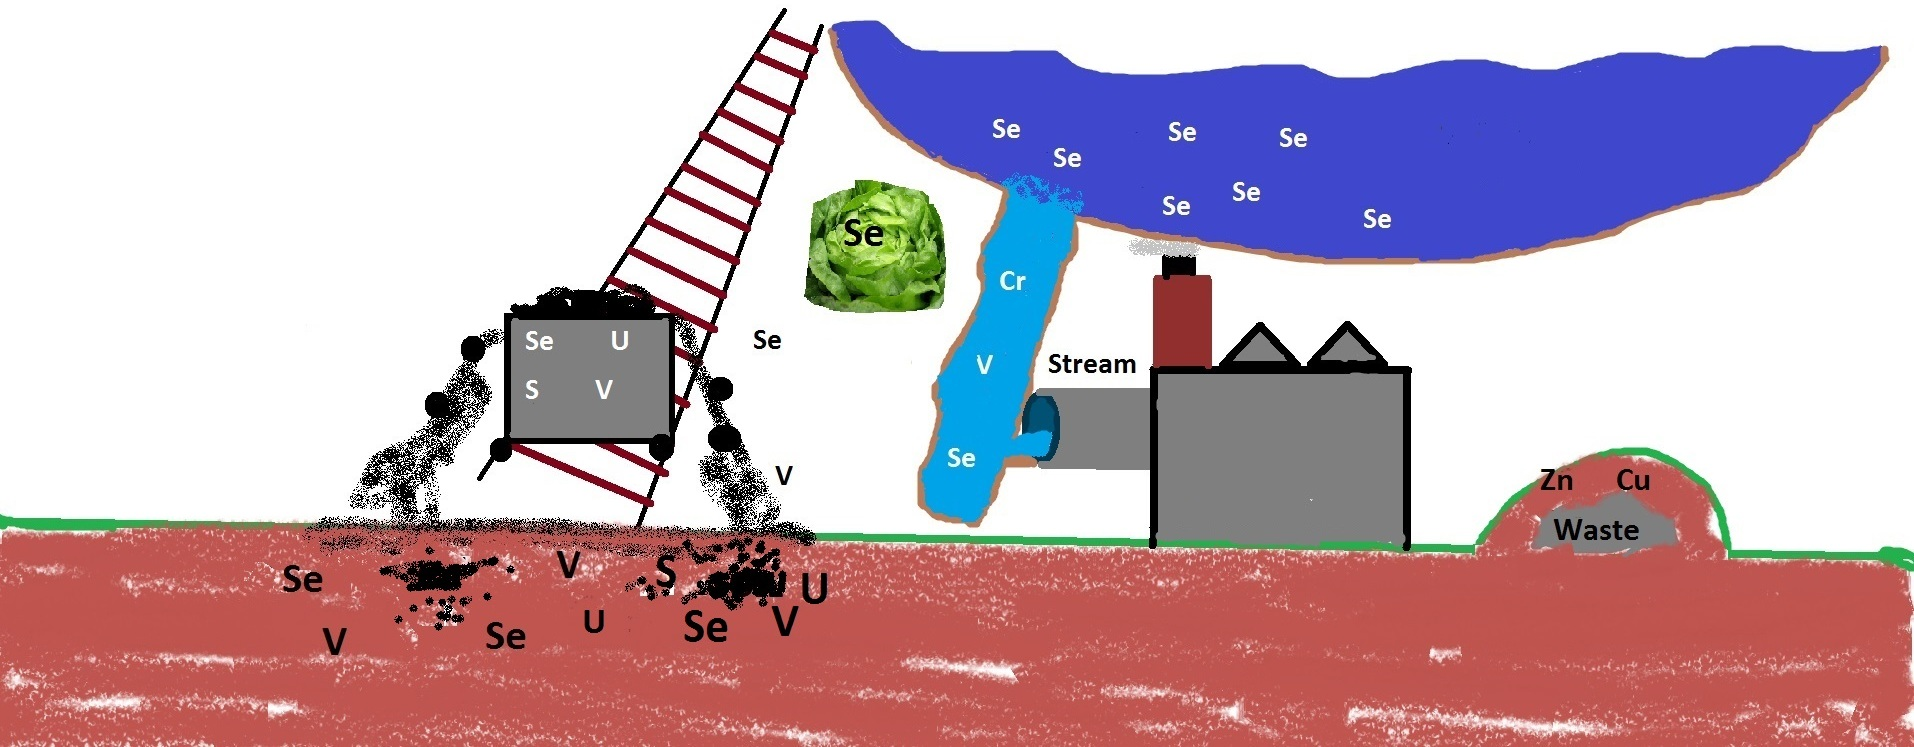
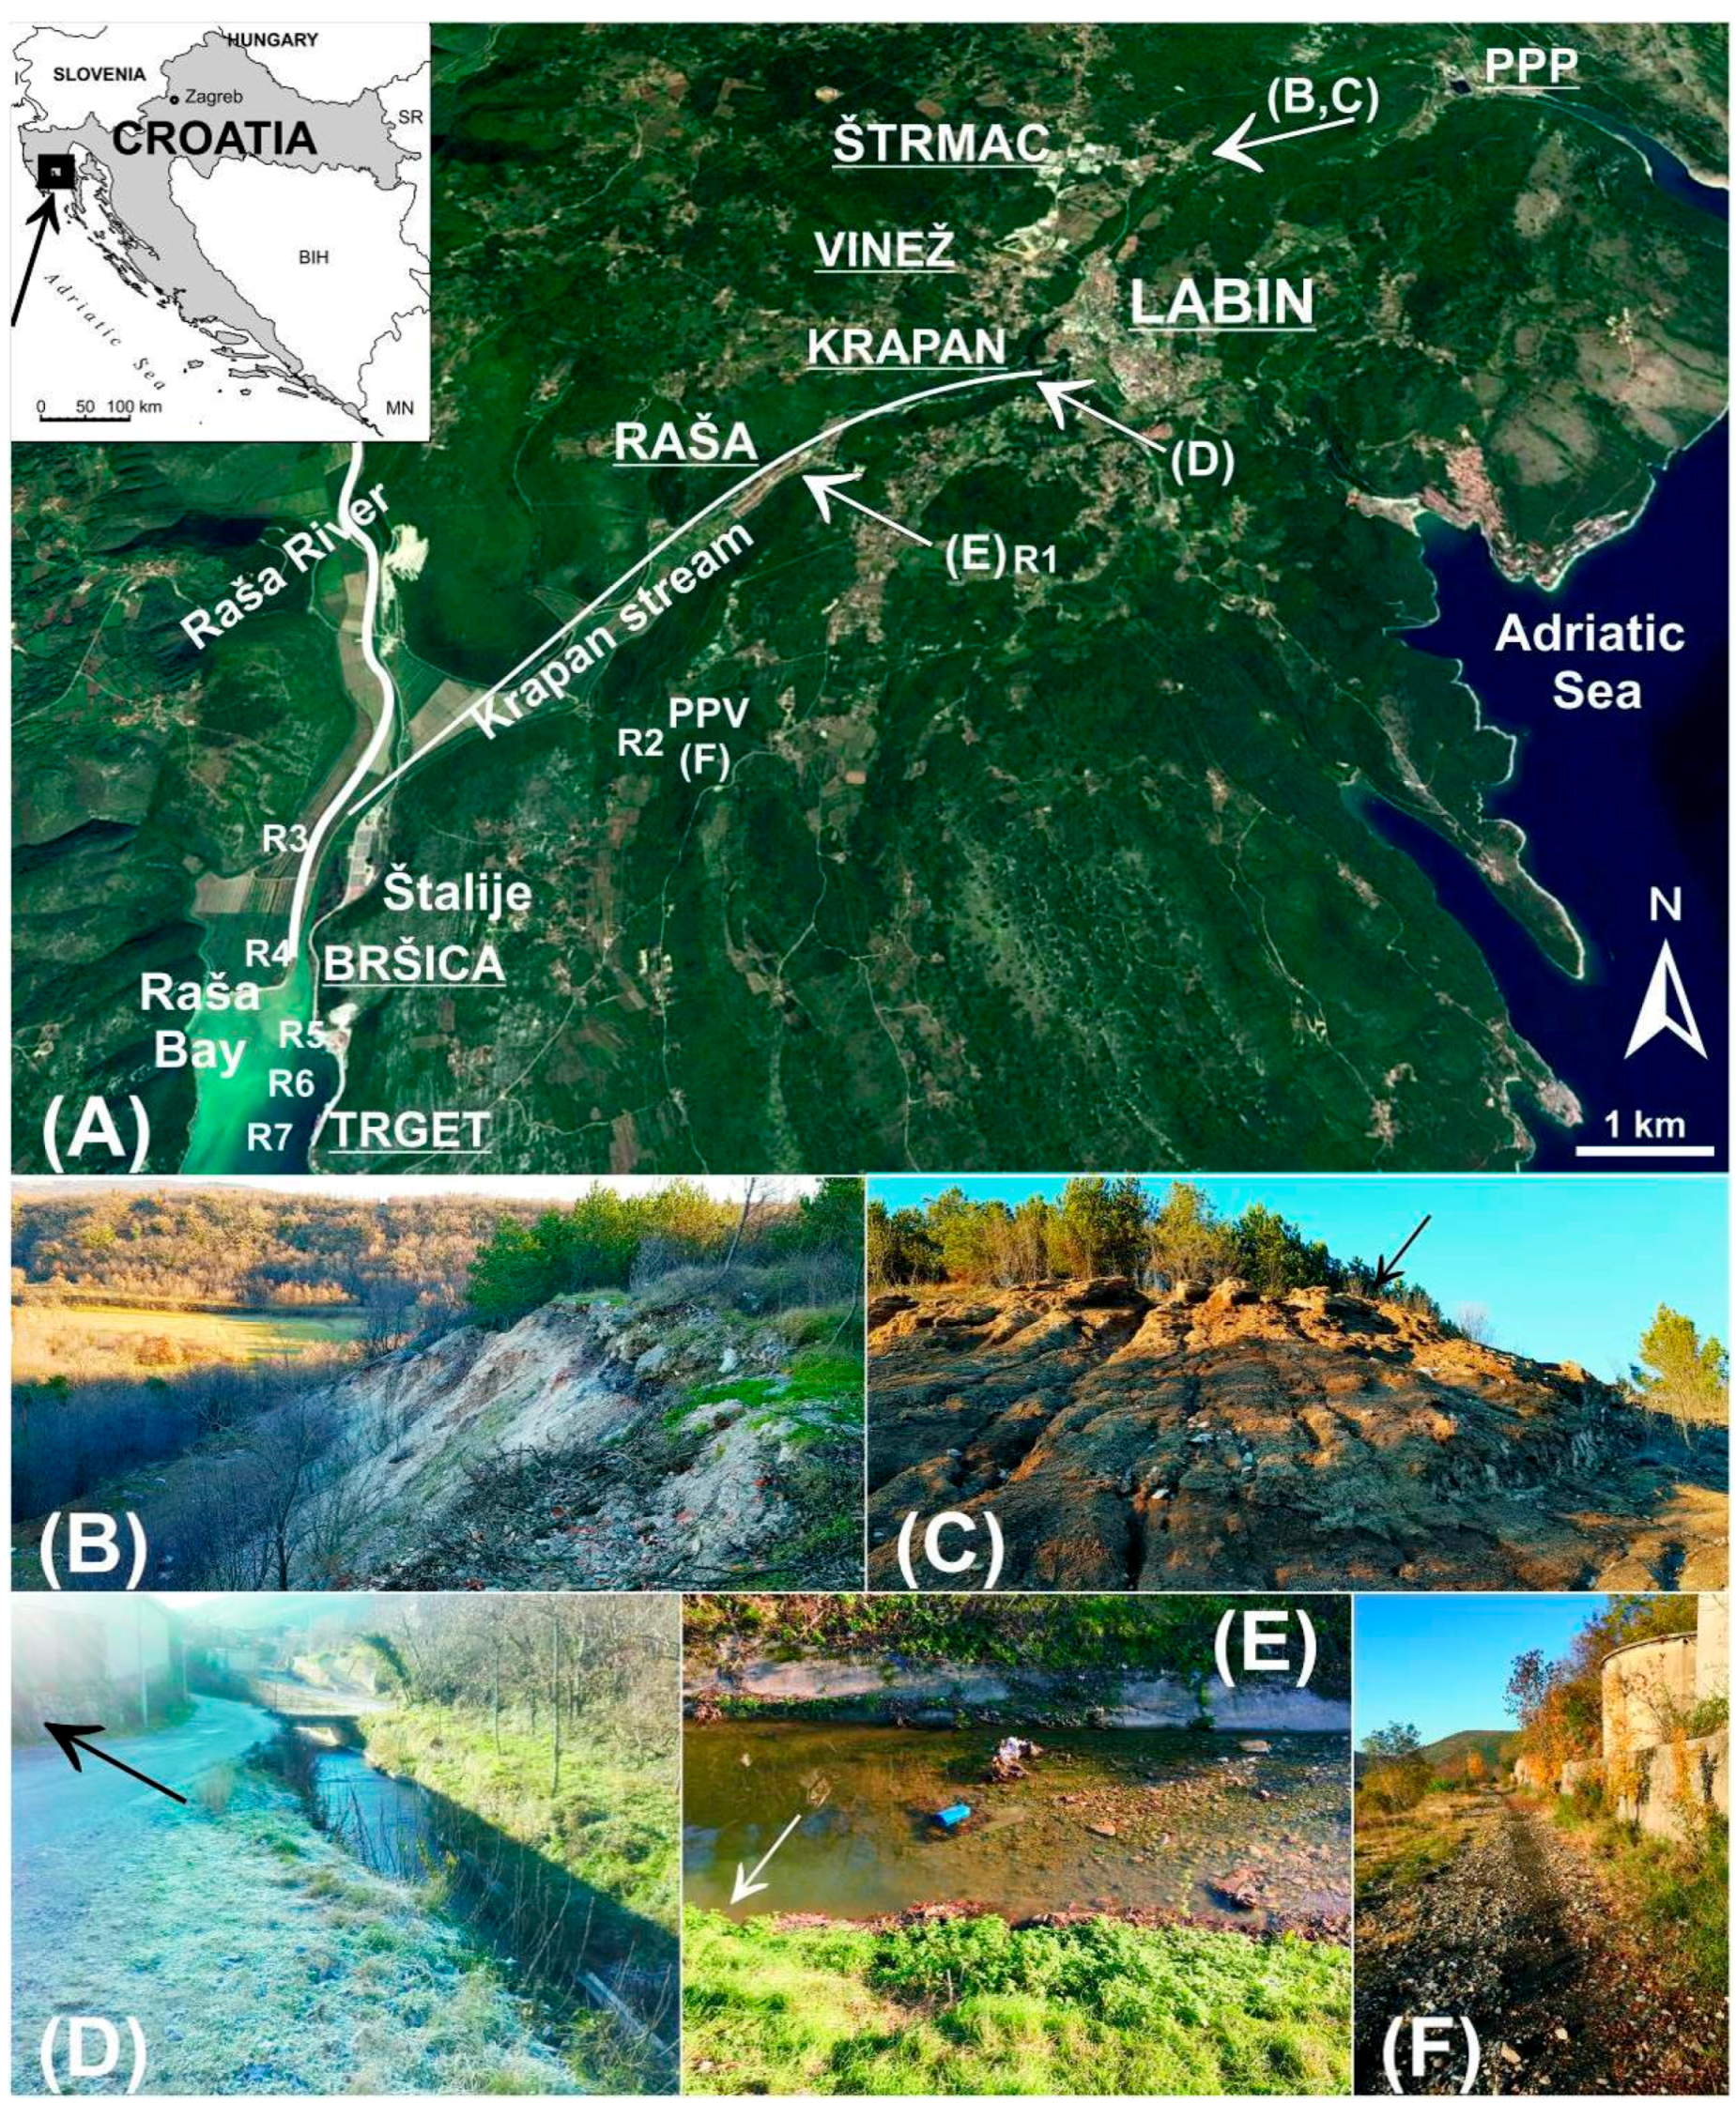
2.1. Site Description and Sampling Strategy

The study area (Figure 1A) extends from the Štrmac town (45°07′ N 14°07′ E) towards the Raša Bay (Bršica and Trget harbours, 45°02′ N 14°03′ E). More details about geology, hydrology, and pedology can be found elsewhere [13,14]. Briefly, carbonate bedrock is composed of Mesozoic limestones and dolomites, which contain the SHOS Raša coal seams. The coal series is up to 400 m thick, tectonically very disturbed, and the deepest sections descend from Raša via Labin (−400 m) to Plomin (−500 m). The number and range of coal layers in the series is variable; in the Labin area, some 13 layers with thicknesses of 0.8–7.0 m were registered. The study area is characterised by thin to moderately thick red or brown clay-loam soils, belonging to the classes of Chromic Cambisols and Chromic Luvisols [15]. The soil is composed of quartz, plagioclase, K-feldspar, micas, kaolinite, chlorite, vermiculite, mixed-layer clay minerals, hematite, goethite, boehmite, and XRD-amorphous inorganic compounds [14].
Relatively high rainfalls percolate quickly through karstified bedrock and flow towards the sea. A municipal wastewater sewage system exists in Labin city (95% connection), and a few neighbouring towns, while the rest of the population uses septic tanks. The existing stormwater sewer causes some problems to the current system as well as the operation of a device for the central wastewater treatment. The reconstruction of the existing mixed-sewer drainage system will facilitate the receiving and draining of the stormwater and municipal sanitary wastewater. The area is characterised by a Mediterranean climate (mild humid winters and hot dry summers), while the dominant NE winds [9] carry airborne gases and dust load from the PPP (45°08′ N 14°09′ E) towards the Labin city area. This is an undulating plateau surrounded by deep-cut valleys (Raša River and Krapan stream), and a steep coastline (Figure 1A). Raša coal mining towns (Štrmac, Labin, Vinež, Krapan, and Raša) produced the most valuable deposits of the lignite coal reserves in Croatia. Following their closure (1999), shafts were flooded up to the water table, and the water has since been flowing through the underground streams to the seawater. The Štalije location served for the separation and washing of coal, while dirty wastewater had been disposed of in the sea for decades. Such practice lasted until the end of the Second World War, when wells were built. Bršica was the loading port for coal in the past. Today, it is specialised for export of livestock and dangerous goods.
By visual inspection of the terrain, topsoil (down to depth of 10–15 cm) samples (n = 16, composites of five subsamples taken from an area of 1 m2) were collected from the vicinity of derelict ash waste and related industrial sites in the towns of Štrmac (Figure 1B,C), Vinež, Krapan (Figure 1D), and Raša (Figure 1E), and the locations surrounding a former Vlaška power plant (PPV, Figure 1F; it was generating electricity for the coal-transporting railway from Krapan to Štalije), as well as the Štalije (Figure 1A) coal separation site. Control topsoil samples (n = 5), from the same carbonate bedrock, were collected 20 km away from the study area in the NE direction (45°14′ N 14°15′ E). Following the air-drying, soil samples were disaggregated in an agate mortar and sieved to <2 mm, while subparts were additionally sieved to <0.063 mm for the total S and cation exchange capacity (CEC) analyses.
About 3 kg of sediment was taken from a site in the Krapan stream (Figure 1E), which receives the partially treated MWE from the Labin city, non-treated effluents from the Krapan and Raša towns, and coal mine effluents.
Lettuce leaf samples were collected from small garden plots (n = 4; one lettuce sample per garden plot) situated along the Krapan stream in Raša town (Figure 1E). The plant leaves were washed with tap and distilled water, and rinsed with deionized water. After drying in an oven at 60 °C for a few days, they were crushed in an agate mortar.
Non-filtered water samples included water flowing from a Krapan coal mine (n = 1), MWE (n = 3) in Raša town, the Raša River (n = 1), at a site a few km upstream of the Raša estuary, and the seawater (n = 3) close to the Bršica and Trget localities (Figure 1A). Water samples were collected from the surface, at a maximum depth of 10–15 cm, in acid-cleansed plastic bottles spiked with suprapure HNO3, and all the bottles were stored at 2 °C prior to analysis conducted the next day. All these samples were collected in November 2015, and almost the same sampling campaign was conducted again in May 2018 (symbols R1–R7 on Figure 1A).

2.2. Analytical Methods

Soil physicochemical properties (pH, LOI—loss on ignition, CEC—cation exchange capacity, and CaCO3) were determined according to the procedures presented in a previous publication [9]. Total sulphur content (%) in soil (fraction <0.063 mm) and reference ISE 979 (Rendzina soil from Wepal, the Netherlands) was determined using Eschka’s mixture according to the standard test method ASTM E775-87 [16]. Accuracy and precision were within ±10% between analysed and certified values.
Levels of trace elements in soil/sediment, soil water extracts, and lettuce, except for Hg, were measured by ICP-MS (ELAN DRC-e, Singapore, Perkin Elmer). For quality assurance, reagent blanks and certified reference materials were also analysed. Element detection limit values for soil (mg/kg), lettuce (mg/kg), and water (µg/L) were as follows: Cd—0.0037, 0.013, and 0.061; Cu—0.037, 0.126, and 0.303; Cr—0.018, 0.063, and 0.152; Hg—0.0015, 0.0003, and 0.03; Pb—0.020, 0.063, and 0.257; Se—0.022, 0.058, and 0.167; Sr—0.037, 0.126, and 0.606; U—0.103, 0.303, and 0.285; and Zn—0.093, 0.315, and 0.351, respectively. Subsamples (0.1 g) of finely ground and homogenised soil and sediment (<2 mm), and CRM RTC 79 were subjected to total digestion in the microwave oven (Multiwave 3000, Anton Paar, Graz, Austria). The two-step procedure consisted of the digestion with a mixture of 4 mL HNO3, 1 mL HCl, and 1 mL HF, followed by the addition of 6 mL of H3BO3. All the measurements had recoveries from 95.2% to 109%, whereas RSD ranged from 0.2 to 5.5%. Considering the water extracts of several selected soil samples, they were prepared by mixing (horizontal shaker) 10 g of dry homogenised samples (<2 mm) with 100 mL of double-distilled water for 24 h at room temperature (22 °C), and then the final suspension was centrifuged. For quality assurance, CRM BCR-713 (Waste Water Effluent) was used; recoveries ranged from 92.4 to 106%, and RSD ranged from 5.24% to 9.21%. Lettuce samples, along with CRM NIM-GBW 10015 spinach, were digested in a microwave ETHOS SEL Milestone device. Approximately 0.1 g of a sample was placed in a Teflon cuvette, into which 4 mL of aqua regia (1 mL HNO3 (65%), and 3 mL of HCl (37%)) was added. The digestion program included 4 min at 300 W, 1 min at 600 W, 1 min at 0 W, and finally 2 min at 300 W. Recoveries ranged from 96.4 to 102%.
Prior to trace element measurements in stream and seawater samples (2015 campaign), they were further diluted 10- and 20-fold, respectively, and acidified with 2% (v/v) HNO3 (65%, supra pur, Fluka, Steinheim, Switzerland), while In (1 µg/L) was added as an internal standard. An Element 2 HR-ICP-MS instrument (Thermo, Bremen, Germany) was used, and detailed a method description was published [17]. Quality control was performed by simultaneous analysis of blanks and certified reference water (SLRS-4, NRC, Ottawa, ON, Canada). Good agreement (±10%) between analysed and certified concentrations was obtained for all the measured elements. Total levels of trace elements in water samples collected in May 2018 were determined by ICP-MS (Aglient 7800, Aglient, Santa Clara, CA, USA). Water samples (25.0 ± 0.1 mL) and blank were subjected to digestion with ETHOS UP Milestone device using hydrochloric (6.0 ± 0.1 mL) and nitric (2.0 ± 0.1 mL) acid. The digestion program included 15 min’s heating to 145 °C and 45 min’s heating at 145 °C. The applied power of digestion devices was 1800 W. The whole digested volumes from the pressure vessels were transferred into a volumetric flask and filled up with ultra-pure water up to 50.0 mL in volume. Samples were analysed on ICP-MS device using high-matrix introduction plasma mode at 1:8 dilution. All samples, quality control samples and blanks were measured in triplicate. Recoveries were between 91% and 109%, and RSD from 1 to 5%. Total levels of BTEX in the same water samples (May 2018) were determined by GC-MS (Agilent 7890 B System with Agilent 7697 Headspace and Agilent 597 MSD detector). Samples were analysed as received, without any pre-treatment using the headspace technique together with quality control samples. Recoveries were between 95% and 103%.
Total Hg in diluted water samples (2015-campaign), and digested soil/sediment and lettuce samples was determined by cold-vapour atomic absorption spectrometry (CV-AAS) on FIMS-400 instrument (Flow Injection Mercury System-400, Perkin Elmer, Waltham, MA, USA). Total Hg in soil water extracts (prepared by mixing 0.1 g of dry homogenised samples with 1 mL of deionised water for 24 h before centrifugation) was determined by direct measurement on instrument DMA-80 (Direct Mercury Analyzer-80, Milestone Srl, Milano, Italy), which includes total decomposition, amalgamation, and atomic absorption spectrometry. All samples, quality control, and blanks were measured in triplicate. Recovery was 96.7%, and RSD ranged from 0.8 to 2.8%.
Data analysis was carried out using Statistica 12 software (StatSoft Inc., Tulsa, OK, USA). It involved the nonparametric Mann Whitney U test and the Kendall Tau correlation analysis. The test was carried out on two soil groups (control vs. polluted). Statistical decisions were made at a significance level of p < 0.05.

2.3. Ecological Risk Assessment
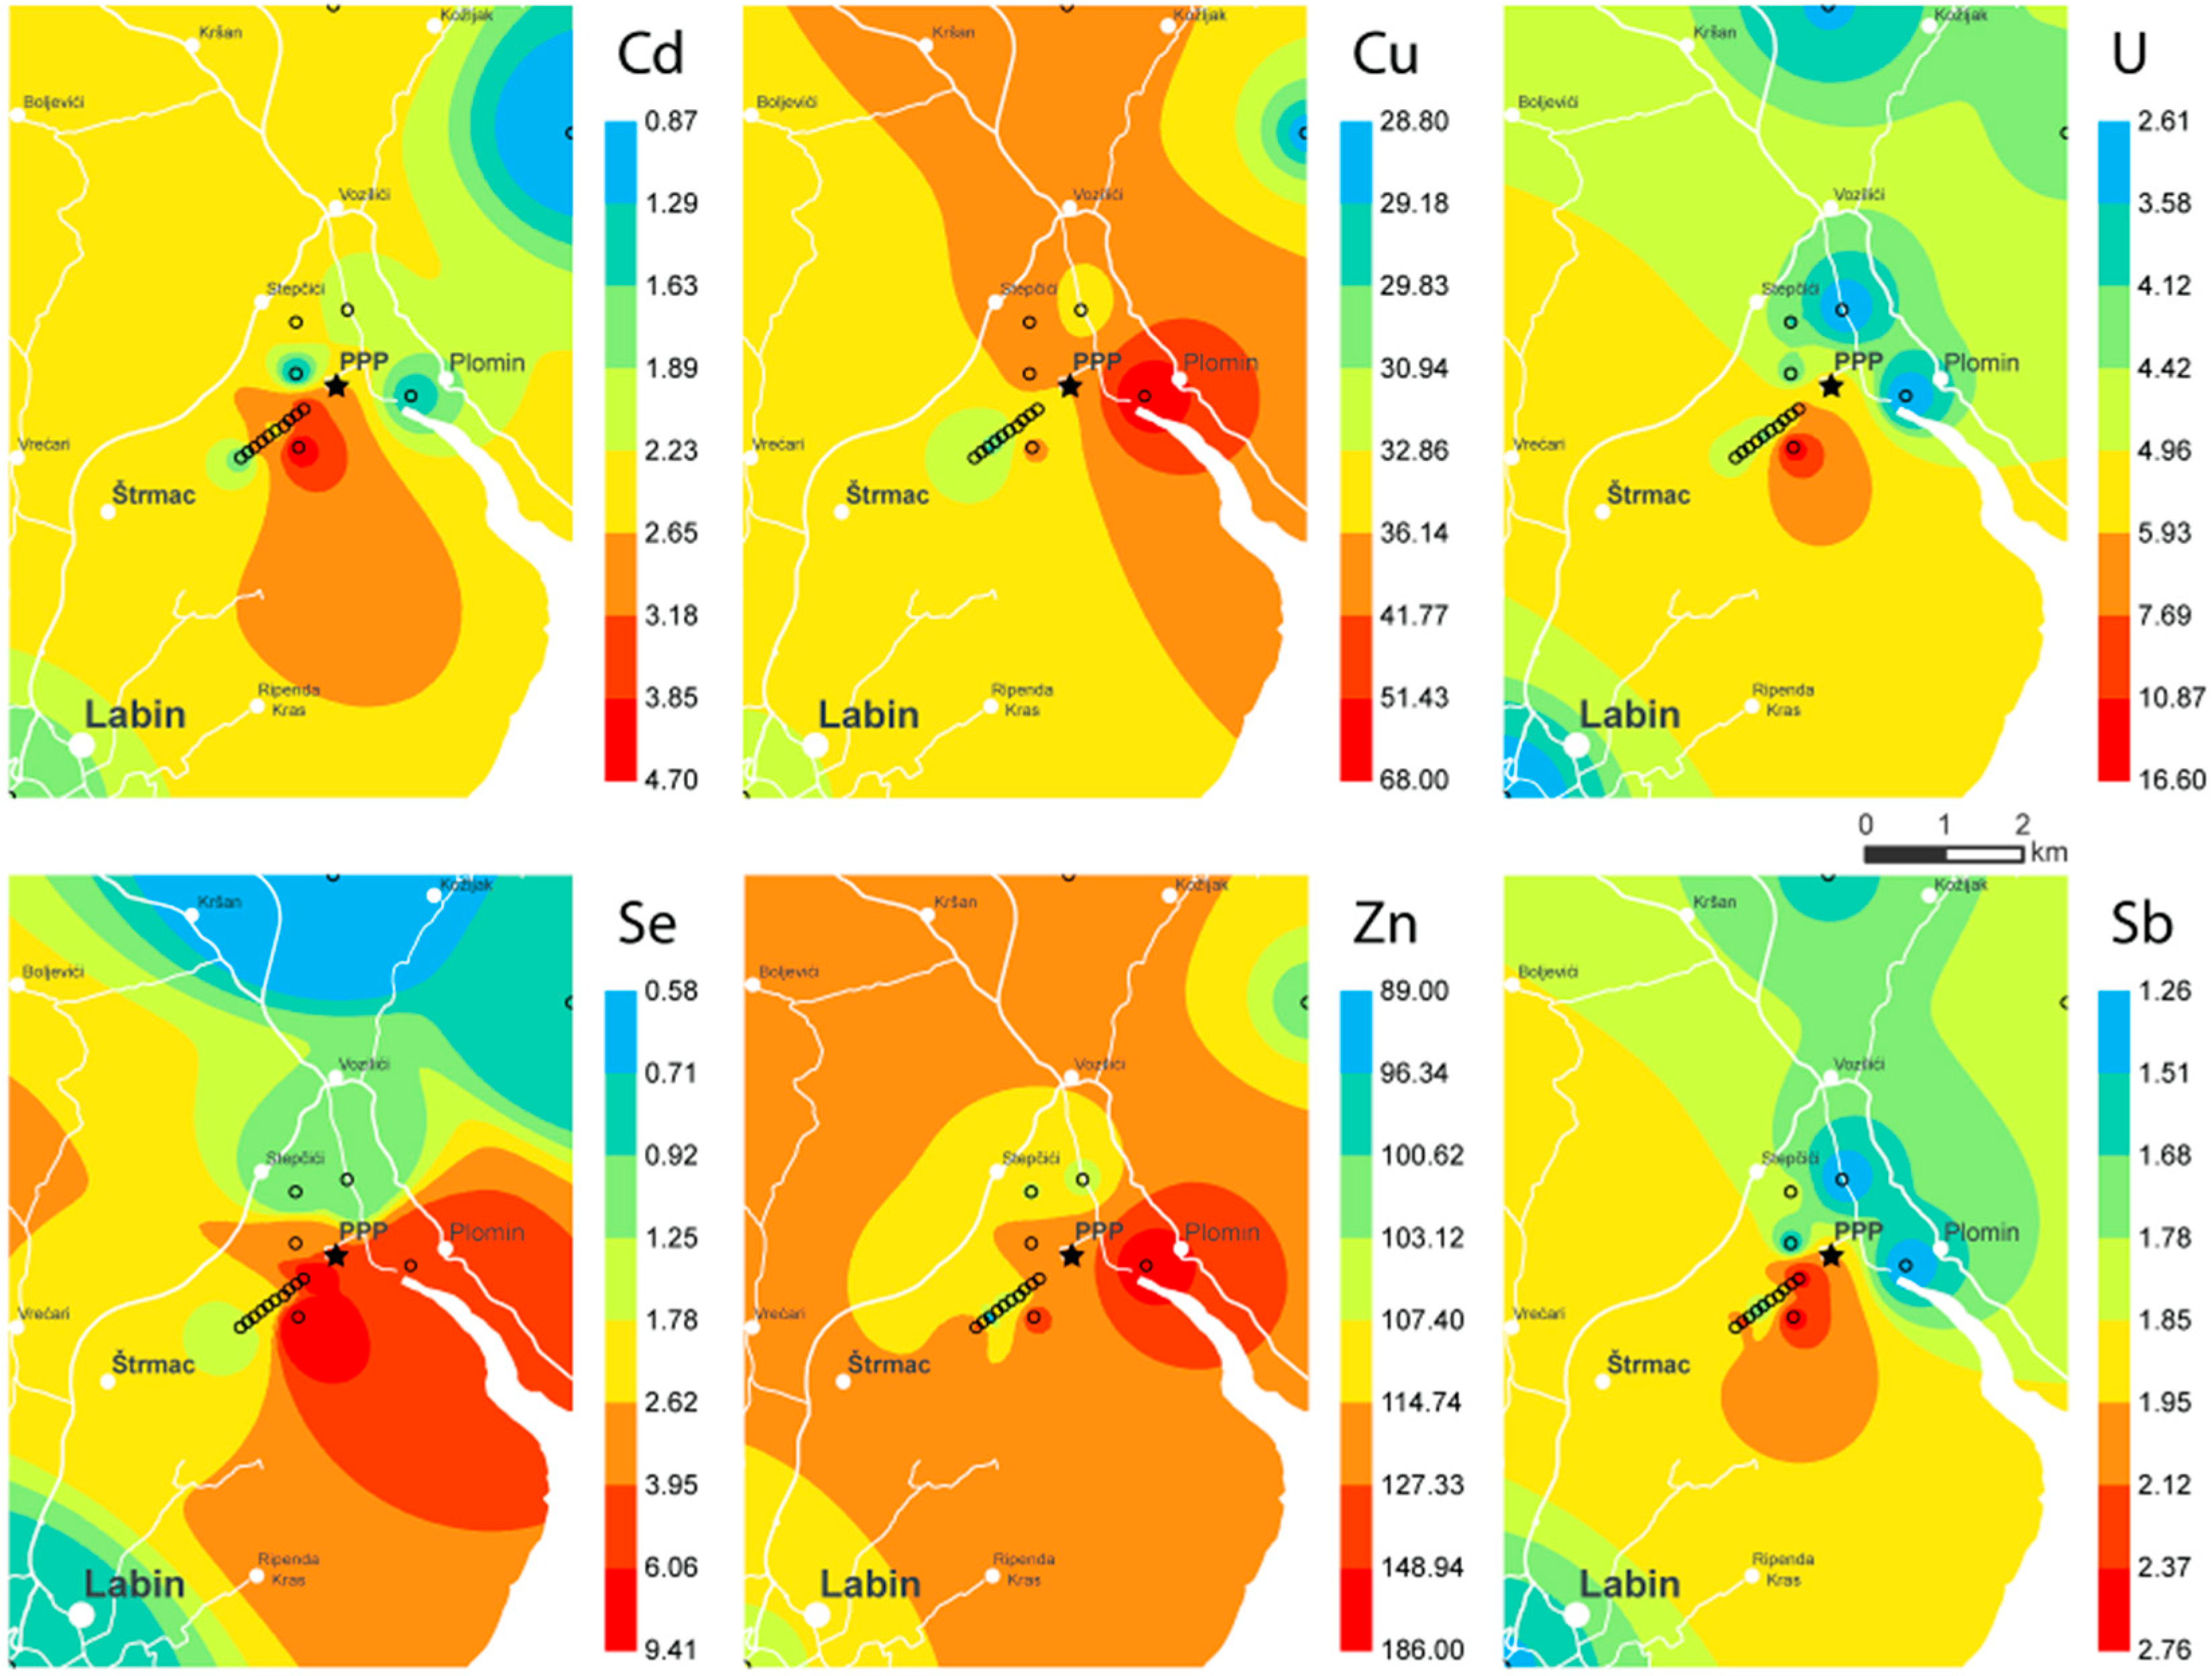
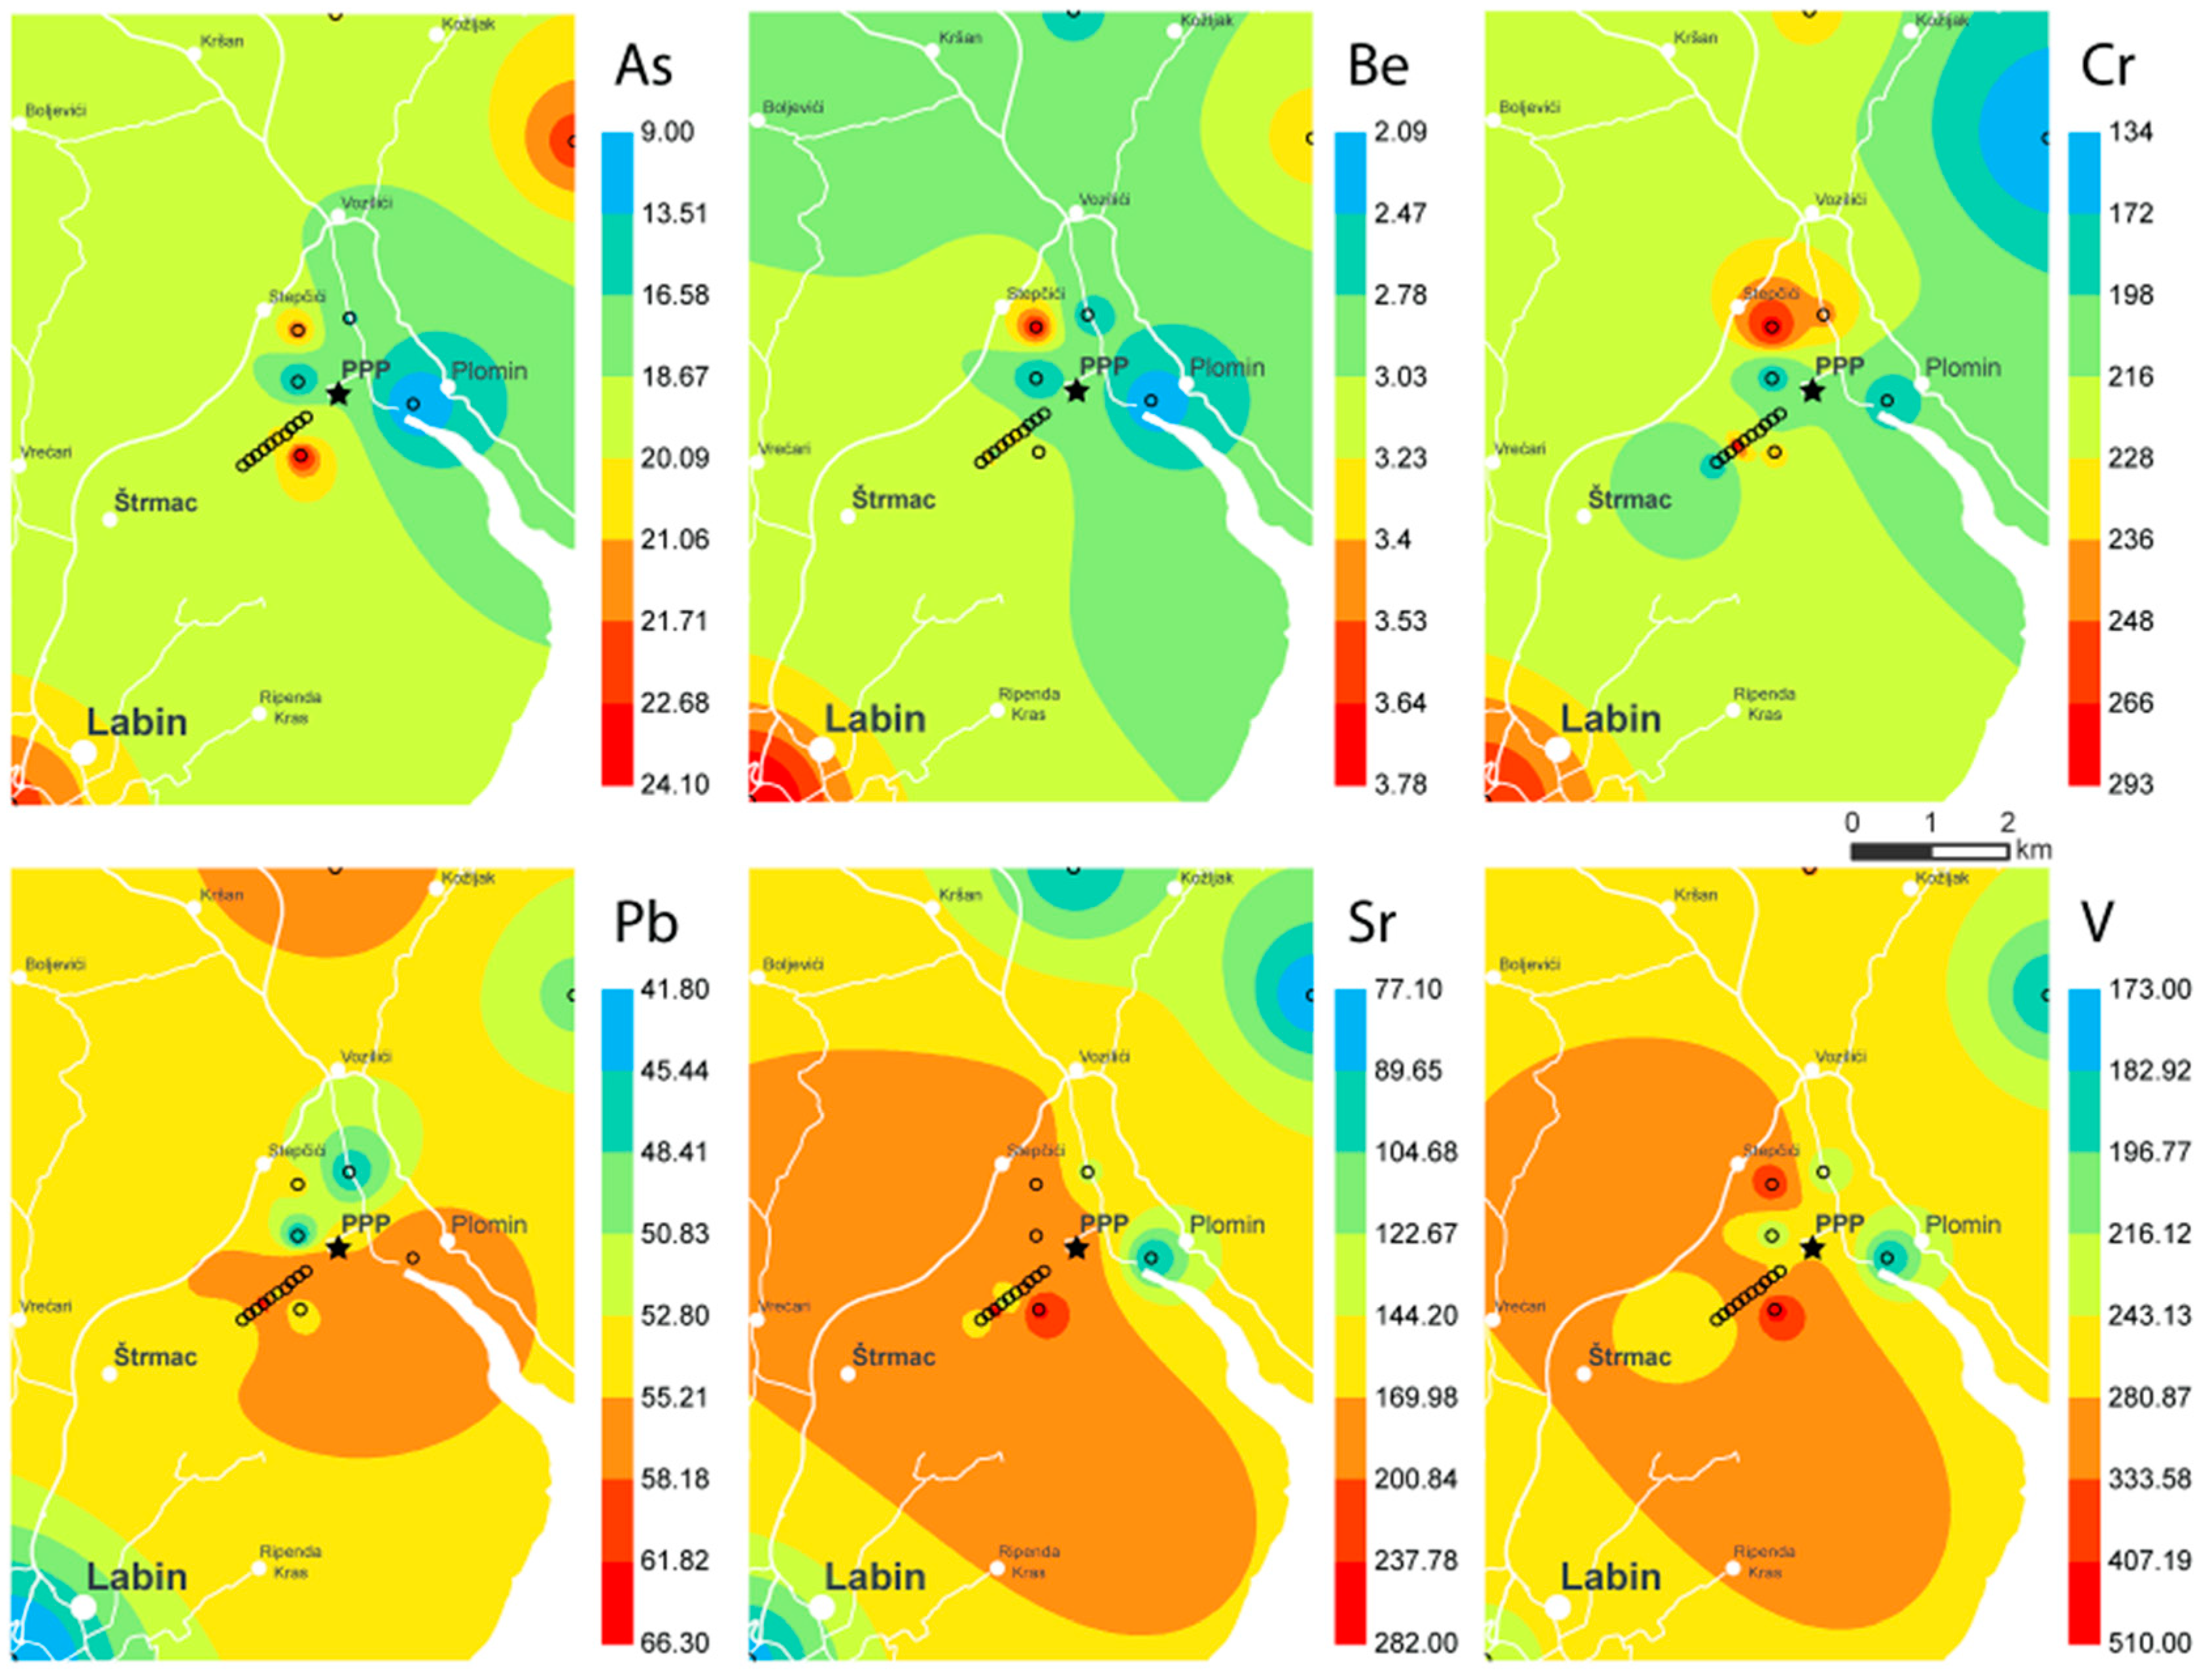
To quantify the levels of potential contamination of soil by selenium and trace metals, strontium was used as a reference element, while soil background Se and heavy metal median data (Istrian Peninsula) were found in the Croatian geochemical atlas [18]. Control soil sulphur concentrations served as soil S background data. The enrichment factor was calculated as follows:
EF = ( C n / C Sr ) sample ( B n / B Sr ) background
where Cn (sample) is the concentration of an examined element n in a soil sample, Bn (background) is the concentration of an examined element n in the unpolluted background sample, while CSr (sample) and BSr (background) are the concentrations of a reference element (Sr) in the soil sample and the unpolluted background sample, respectively. The contamination categories [19] are as follows: deficiency to minimal enrichment (EF < 2), moderate enrichment (EF = 2–5), significant enrichment (EF = 5–20), very high enrichment (EF = 20–40), and extremely high enrichment (EF > 40).
The geo-accumulation index was calculated as follows:
I geo = Log 2 ( C n ) ( 1.5 × B n )
where Cn is the measured concentration of an element n in a soil sample, and Bn is the geochemical background concentration of the same element in soil [18]. There are six classes of Igeo [20]: practically uncontaminated (Igeo ≤ 0), uncontaminated to moderately contaminated (0 < Igeo < 1), moderately contaminated (1 < Igeo < 2), moderately to heavily contaminated (2 < Igeo < 3), heavily contaminated (3 < Igeo < 4), heavily to extremely contaminated (4 < Igeo < 5), and extremely contaminated (5 < Igeo).
Similar to Igeo, the contamination factor Cf was calculated as follows:
Cf = Cn/Bn
There are four Cf categories [21]: low contamination (Cf < 1), moderate contamination (1 ≤ Cf < 3), considerable contamination (3 ≤ Cf < 6), and very high contamination (6 ≤ Cf).
The contamination degree is the sum of individual contamination factors:
Cdeg = Ʃ Cf
There are also four classes of Cdeg [21]: low degree of contamination (Cdeg < 8), moderate degree of contamination (8 ≤ Cdeg < 16), considerable degree of contamination (16 ≤ Cdeg < 32), and very high degree of contamination (32 ≤ Cdeg).
The integrated pollution index (IPI) was calculated as the arithmetic mean of all contamination factors (Cf) or PIs [22], and they are classified as follows: IPI ≤ 1 low level of pollution, 1 < IPI ≤ 2 moderate level of pollution, 2 < IPI ≤ 5 high level of pollution, and 5 < IPI extremely high level of pollution.

2.4. Contour Maps

Based on trace element data (accomplished by ICP-MS measurements) for soil around PPP, presented in a previous paper [9] (but not depicted graphically), contour maps were created in order to visualize the spatial distribution of trace elements in the immediate surroundings of PPP. Interpolation was performed using the deterministic inverse distance weighting method. Values at unknown locations were estimated based on values at sampling locations and weights which are inversely proportional to their distance using the formula:
z 0 = i = 1 n w i z i i = 1 n w i
Weights are related to distance by wi = 1/di0k, where di0 is the distance between the sample location and the one being estimated, while k controls the rate of decline of the weighting value with increasing distance. A value of k = 2 was used for all of the maps.

3. Results and Discussion

3.1. Levels of Se and Trace Metals in Soil and Sediment

Table 1 shows that trace element values in control soil, being similar to the respective published data [14], are representative of preindustrial background soil composition. Selenium, V, Pb and Zn levels are slightly higher than the data published elsewhere [23], thus reflecting a variability of trace elements within and among the Istrian soils [14]. There are three broad element classes in the Croatian karst soil [24]: (1) anthropogenic association (Pb, V, Cu and Cr), mostly related to traffic, the fishing industry, Raša coal mining and combustion, refinery industry, and vineyards; (2) mixed origin (radionuclides and Zn), mostly related to Raša coal beds, and various urban and industrial sources; and (3) geogene origin (Sr, Ba, Ti, Al, Na, Ca, Mg, Fe, Mn, Ni and Co). In our previously conducted study [8], we determined positive Kendall’s rank correlations among Se, V and U (the so-called coalphile elements) in Štrmac ash waste (Figure 1B,C) and SHOS Raša coal samples (>0.62 and >0.99, respectively, p < 0.05 in both cases). Given that the same Se-V-U association (>0.80, p < 0.05) was also determined in control soil samples in this study, it can be said that the SHOS Raša coal geochemistry has had a significant role in shaping the local and regional soil geochemical background.
Table 2 shows that the majority of element values in Labin soil are slightly to greatly increased compared to the published data.
Both soils (Table 1 and Table 2) have comparable pH values, but their carbonate, LOI, and CEC values differ somewhat. Higher carbonate content in Labin soil can be explained partly by varying pedology [14], and partly by the combustion-derived CaSO4 particles emitted from the PPP [9]. The maximum LOI values were determined in dark-coloured soils enriched in coal debris collected from the PPV (Figure 1F) and Štalije sites. Considering the CEC values, they are rather heterogenous (large SD), likely having resulted from various longlasting urban and industrial activities which contribute to soil perturbations. They are also negatively correlated with LOI (the more coal debris, the less clay), S, and coalphile trace elements (Se, V, U and Hg). The SHOS Raša coal debris, as well as ash by-products, account for some of the highest soil sulphur values in the world (Table 2). Otherwise, coals rich in sulphur are exploited in NE India [31], and Indonesia [32], characterised by S values (%) up to 5.70 and 5.40, respectively. Furthermore, elevated Se (up to 10.3 mg/kg), and positive S-Se-V-U-Sr-CaCO3-LOI correlations (>0.33, p < 0.05) in Labin soil are also a consequence of the SHOS Raša coal debris. Similar Se and V enrichments in coal were reported for Chinese SHOS Guiding coals [33], and USA coal [34]. Selenium has proved a particularly useful fingerprint element with respect to coal-related pollution issues. Extremely high Se values were found in croplands and discarded coal spoils (Yutangba, China), ranging from 346 mg/kg to 2018 mg/kg [35]. They were related to human activities like coal conveyance by local villagers, coal mining, and lime discharge into croplands. Selenium-bearing coals are exclusively high-S coals, Se is a high-coalphile element, and coal beds are sorption barriers for Se, V, U, Mo and Pb dissolved in oxic infiltration waters [36]. Selenate (SeO42−) is notably mobile in strongly oxidising and alkaline environments [37], like those prevailing in the study area, characterised by carbonate bedrock. An absence of impermeable lining beneath the Štrmac ash waste landfill (Figure 1B,C) implies that the locality could act as an inconspicuous source of the environmental pollution with Se and trace metals. For instance, leaching of trace elements (Se, V, etc.) from coal ash ponds to adjacent surface water and shallow groundwater was found in the southeastern United States [38]. Herewith, the results of our previous study [8] could be indicative of a potentially hazardous leaking problem in the Labin area. We found slightly increased Se values in seawater, clover, and foliage samples (close to the PPP), while the Štrmac ash waste samples exhibited lower Se than SHOS ash, which was analysed previously [39]; this could be a consequence of the selenate mobility in the oxidising, alkaline Labin karst environment.
Furthermore, the positively correlated (p < 0.05) Cd-Cu-Pb-Zn group in Labin soil is typical for localities polluted by the mining, metallurgical, and coal-combustion industries [2,40,41]. Soils around metal mines and smelters had metal levels 100-folds those in background soils [40]. The maximum Pb value (Table 2), and a high Zn value (934 mg/kg) were measured in Vinež soil, contaminated by various coal mining and associated industrial activities; the values were slightly lower than the limits (1000 and 1200 mg/kg, respectively) prescribed for trace metals in soil allocated for industrial and commercial purposes [29]. Also, Pb, Zn and Cu values exceeded the Dutch ‘C’ levels (600, 3000 and 500 mg/kg, respectively), which require soil remediation [41]. The maximum levels of Cr, Cu and Zn deserve special mention, as they greatly exceed the limit values for soil in industrial and commercial areas (data in Table 2). Chromium was positively correlated with Pb, Cu and Zn (p > 0.05), while its maximum value of 1860 mg/kg, at a Krapan site close to a chrome plating factory (Figure 1D), could be explained by the possible leaking of chemicals used in the working process. Copper and Zn maximum values (Table 2) in soil overlying the Štrmac ash waste (Figure 1B,C) likely derive from foundry waste, which is known for enrichment in trace metals [26,40]. The waste has been disposed of there for decades, together with other non-hazardous waste materials from local sources. Similar Cu (up to 1018 mg/kg), and Zn (up to 10,000 mg/kg) values were reported for soil polluted by non-hazardous waste from the steel production processes [2].
Contour maps (Figure 2 and Figure 3) of soil trace element levels clearly show how many of them are increased in the SW part of the local area as a consequence of the SW winds, which have carried contaminant load from the PPP facility. Their spatial distributions are in accordance with the results of a previous study [9].
Potentially mobile Se and heavy metal fractions were assessed by applying water as an extractant on several soil samples, selected according to anthropogenic activities. The results (Figure 4) were compared with a similar study carried out on soil polluted with Zn, Pb and Cd from a Pb-Zn mine [42].
The results were fairly comparable, as the authors [42] determined that the percentages of the total water-soluble Zn, Pb, and Cd were very low, ranging from 0.02% to 0.6%, while the respective values in Labin soil were also low, 0.02–0.03%. Specifically, the highest total water-extracted Pb (131 µg/L), and Zn (289 µg/L) values were recorded in Vinež soil; among the measured elements, only water-extracted Pb was positively correlated with total soil Pb (>0.71, p < 0.05). Similarly, a copper contamination of urban soil near a chemical factory, based on correlations (>0.99, p < 0.05) among water-extractable and total Cu levels was elaborated [43]. Figure 4 depicts generally similar Se and V patterns (related to the Raša coal legacy), roughly different from the Pb-Zn-Cu (related to foundry activities), and Cr (possibly from chrome plating process) patterns across soil groups. With respect to Se data (Figure 4), much higher Se aqueous extract levels (100 µg/L) were reported for soils collected from a PPP’s vicinity, and even up to 1900 µg/L for Raša coal ash, which exceeded the non-hazardous limit of 500 µg/L Se [14]. The maximum water-soluble soil Se (4.64 µg/L, a percentage of 0.1%) in this study was much lower than the respective value (354 µg/L, a percentage of 4.3%) reported in a Chinese selenosis area (total soil Se up to 7.87 µg/g, derived from high-Se coal). There, the morbidity rate caused by Se’s toxicity in local food was almost 50% during the period 1961–1964 [44].
The collected sediment sample could be considered sewerage sludge due to its proximity to an effluent pipe (Figure 1E). Table 2 shows that Pb, Zn and Cu levels are increased with respect to a geographically similar locality [28], and to the sediment quality criteria (data in Table 2). Although they seem to exceed the toxic levels, they are lower than the limit values for metals in sewerage sludge [45], as follows (mg/kg): Cu 1000–1750, Zn 2500–4000, and Pb 750–1200. Very high levels of Zn, Pb, and Cd (mg/kg) were reported [46] for the most polluted river sediment in EU (1846, 229 and 73, respectively). Potentially toxic trace elements like Pb, Zn and Cu have low solubility in neutral to slightly higher pH values characteristic for karst environments [26]. If firmly associated with mineral phases, they should not pose a threat to aquatic life, unless Eh-pH conditions get appreciably changed. It was reported that consistently high water metal concentrations would nearly always contaminate associated sediments, while the converse should not necessarily be true [47].

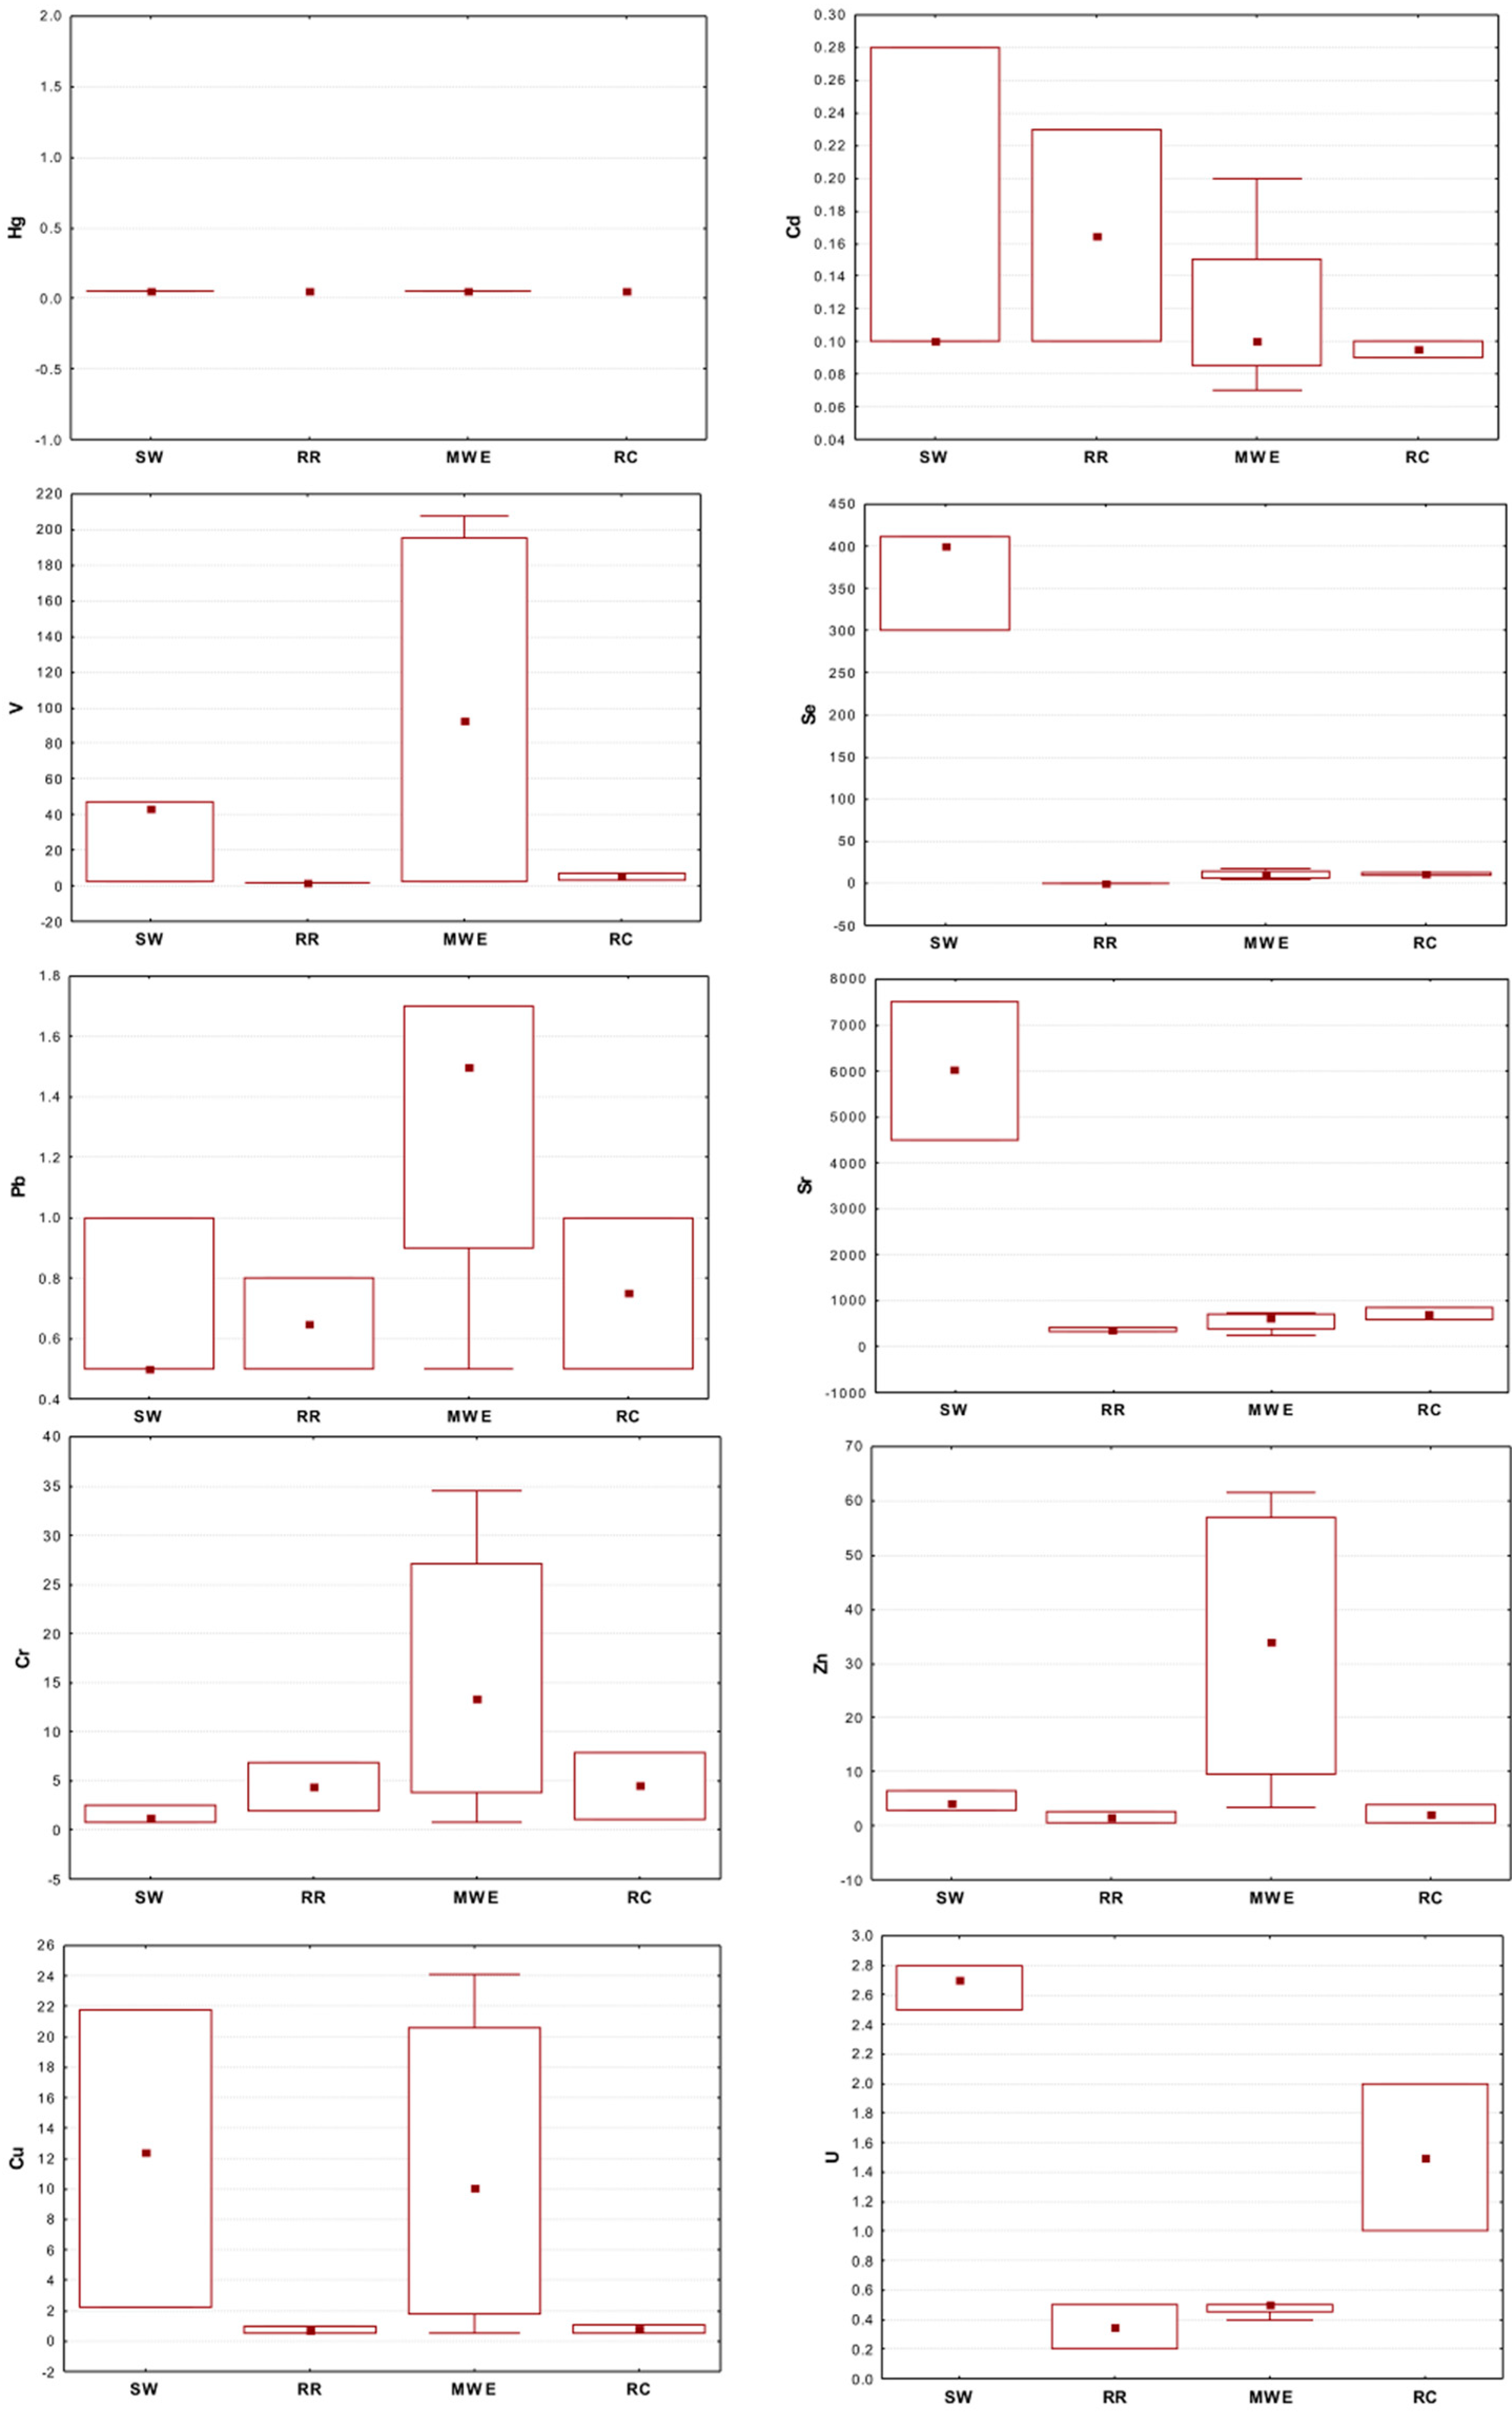
3.2. Levels of Se, Trace Metals, and BTEX in Water and Lettuce Samples

Total levels of Sr and trace metals (dissolved and particle associated elements) in different water sample groups (2015 campaign) are presented in Figure 5. Generally, in all four groups, Hg, Cd, Pb, Zn, U and Sr were either comparable or lower than the compiled published data in Table 3. Lead, Cr, Zn and Cu values in seawater were slightly above the world seawater values [25], possibly from suspended particles enriched in trace metals. Copper in MWE and seawater reached levels of land/surface water category 5 (toxic levels), and seawater category 2 (sea affected by pollution from land). Chromium in MWE samples (up to 34.5 µg/L, land water category 5) exceeded the maximum allowed Cr according to Croatian law [48], and it was slightly above a Dutch intervention value (30.0 µg/L) for Cr(III) in groundwater [49]. This could be related to the spatial proximity of Krapan soil polluted with chromium (max Cr value in Table 2), explained in the context of a possible hazardous disposal of chemicals from chrome plate factory into the Krapan stream (Figure 1D).
Owing to the fact that vanadium is enriched in SHOS Raša coal [8], Raša ash by-products [39], and Labin soil (Table 2), V values in this study increased in seawater, MWE (water category 5), and coal mine water (Figure 5) compared with typical Croatian karst localities, Croatian guidelines, and seawater average values (Table 3). Likewise, anomalously high Se values (300–400 µg/L) were found in seawater sampled from a Trget beach (Figure 1A). It is presumed that the site has been occasionally affected by leaking of the Štalije coal separation unit site, even today, decades after its closure. Similarly, high Se levels (mean ± SD: 537 ± 650 µg/L) in US home wells were found to be derived from a uranium mill tailing pond nearby [50]. A paper [51] reviewed the environmental implications of selenium, and pointed out that rain can leach selenium from coal and oil-shale mining, preparation, and storage sites, where it may enter down-gradient streams and reservoirs through precipitation runoff. That has probably been happening in the Labin area occasionally. Also, increased concentrations (600–900 µg/L) of Se were found in the groundwater of a small backfill area at a surface mine [52]. They were interpreted in the context of oxidation of selenium-bearing pyrite in the geological past combined with mining operations which disturbed the overburden and altered its environment. An average Se value of 139 µg/L was reported for surface water from a village with a heavy prevalence of selenosis [44]. Background groundwater Se values of 0.40 µg/L were found in the Labin area [14]. In this study, total Se values in MWE (up to 18.2 µg/L), and coal mine water (up to 13.0 µg/L) exceeded the regulatory limit value of 10 µg/L (Table 3). Moreover, they are up to nine times the level of concern of 2–5 µg/L [53], while certain toxicological and reproductive effects are reported for cases of Se >5 µg/L in water [26]. One author of the paper [53] emphasized that waterborne selenium concentrations of 2 µg/L or greater should be considered hazardous to the health and long-term survival of fish and wildlife populations due to the high potential for food-chain bioaccumulation, dietary toxicity, and reproductive effects.
The findings of this study (2015 campaign) provide an evidence of an occasional leaking of polluted Labin soil, coal ash by-products, SHOS Raša coal beds, and probably SHOS coal particles dumped in the sea long ago. However, minor and trace metal data of the 2018 campaign water samples (Table 4) were rather low, except for Se, which was found to be still slightly increased at locations in Raša town (MWE) and PPV. The BTEX levels were found to be very low (Table 4), indicating no sign of the relevant contamination of local surface water in the study area.
Vanadium, Se, and Cr max levels (mg/kg, d.w.) in lettuce (8.33, 2.53 and 5.48, respectively) were slightly increased in comparison with compiled data [23], while max levels of Cd (0.38), Cu (12.8), Hg (0.03), Pb (2.84) and Zn (30.2), in mg/kg, d.w., were fairly similar to published data [56] reported for Croatian market vegetables. Reference [57] reported that Se levels in 17 different crops, all grown on soils with moderate Se concentrations, rarely exceeded 1.00 mg/kg Se (d.w.). Reference [44] determined Se of up to 6.30 mg/kg d.w. in crops grown on Se-rich soil (Enshi County, China). The authors [44] also found a good correlation (r = 0.83, p < 0.01) between crop Se and soil water-soluble Se. Compared to lettuce from eastern Croatia [58] and Greece [59], Labin lettuce Se is increased approximately five-fold and 20-fold, respectively. Selenium has a strong tendency for bioaccumulation, posing toxic hazards by entering the food chain [51]. Like water samples, lettuce from the Labin area can be considered to be polluted with Se and V, elements typically enriched in SHOS coals [33]. Obviously, the soil water-soluble Se must have caused a certain degree of Se uptake by lettuce. On the other hand, it is reported [26] that V-rich soils should not pose any risk from V bioaccumulation in the food chain.

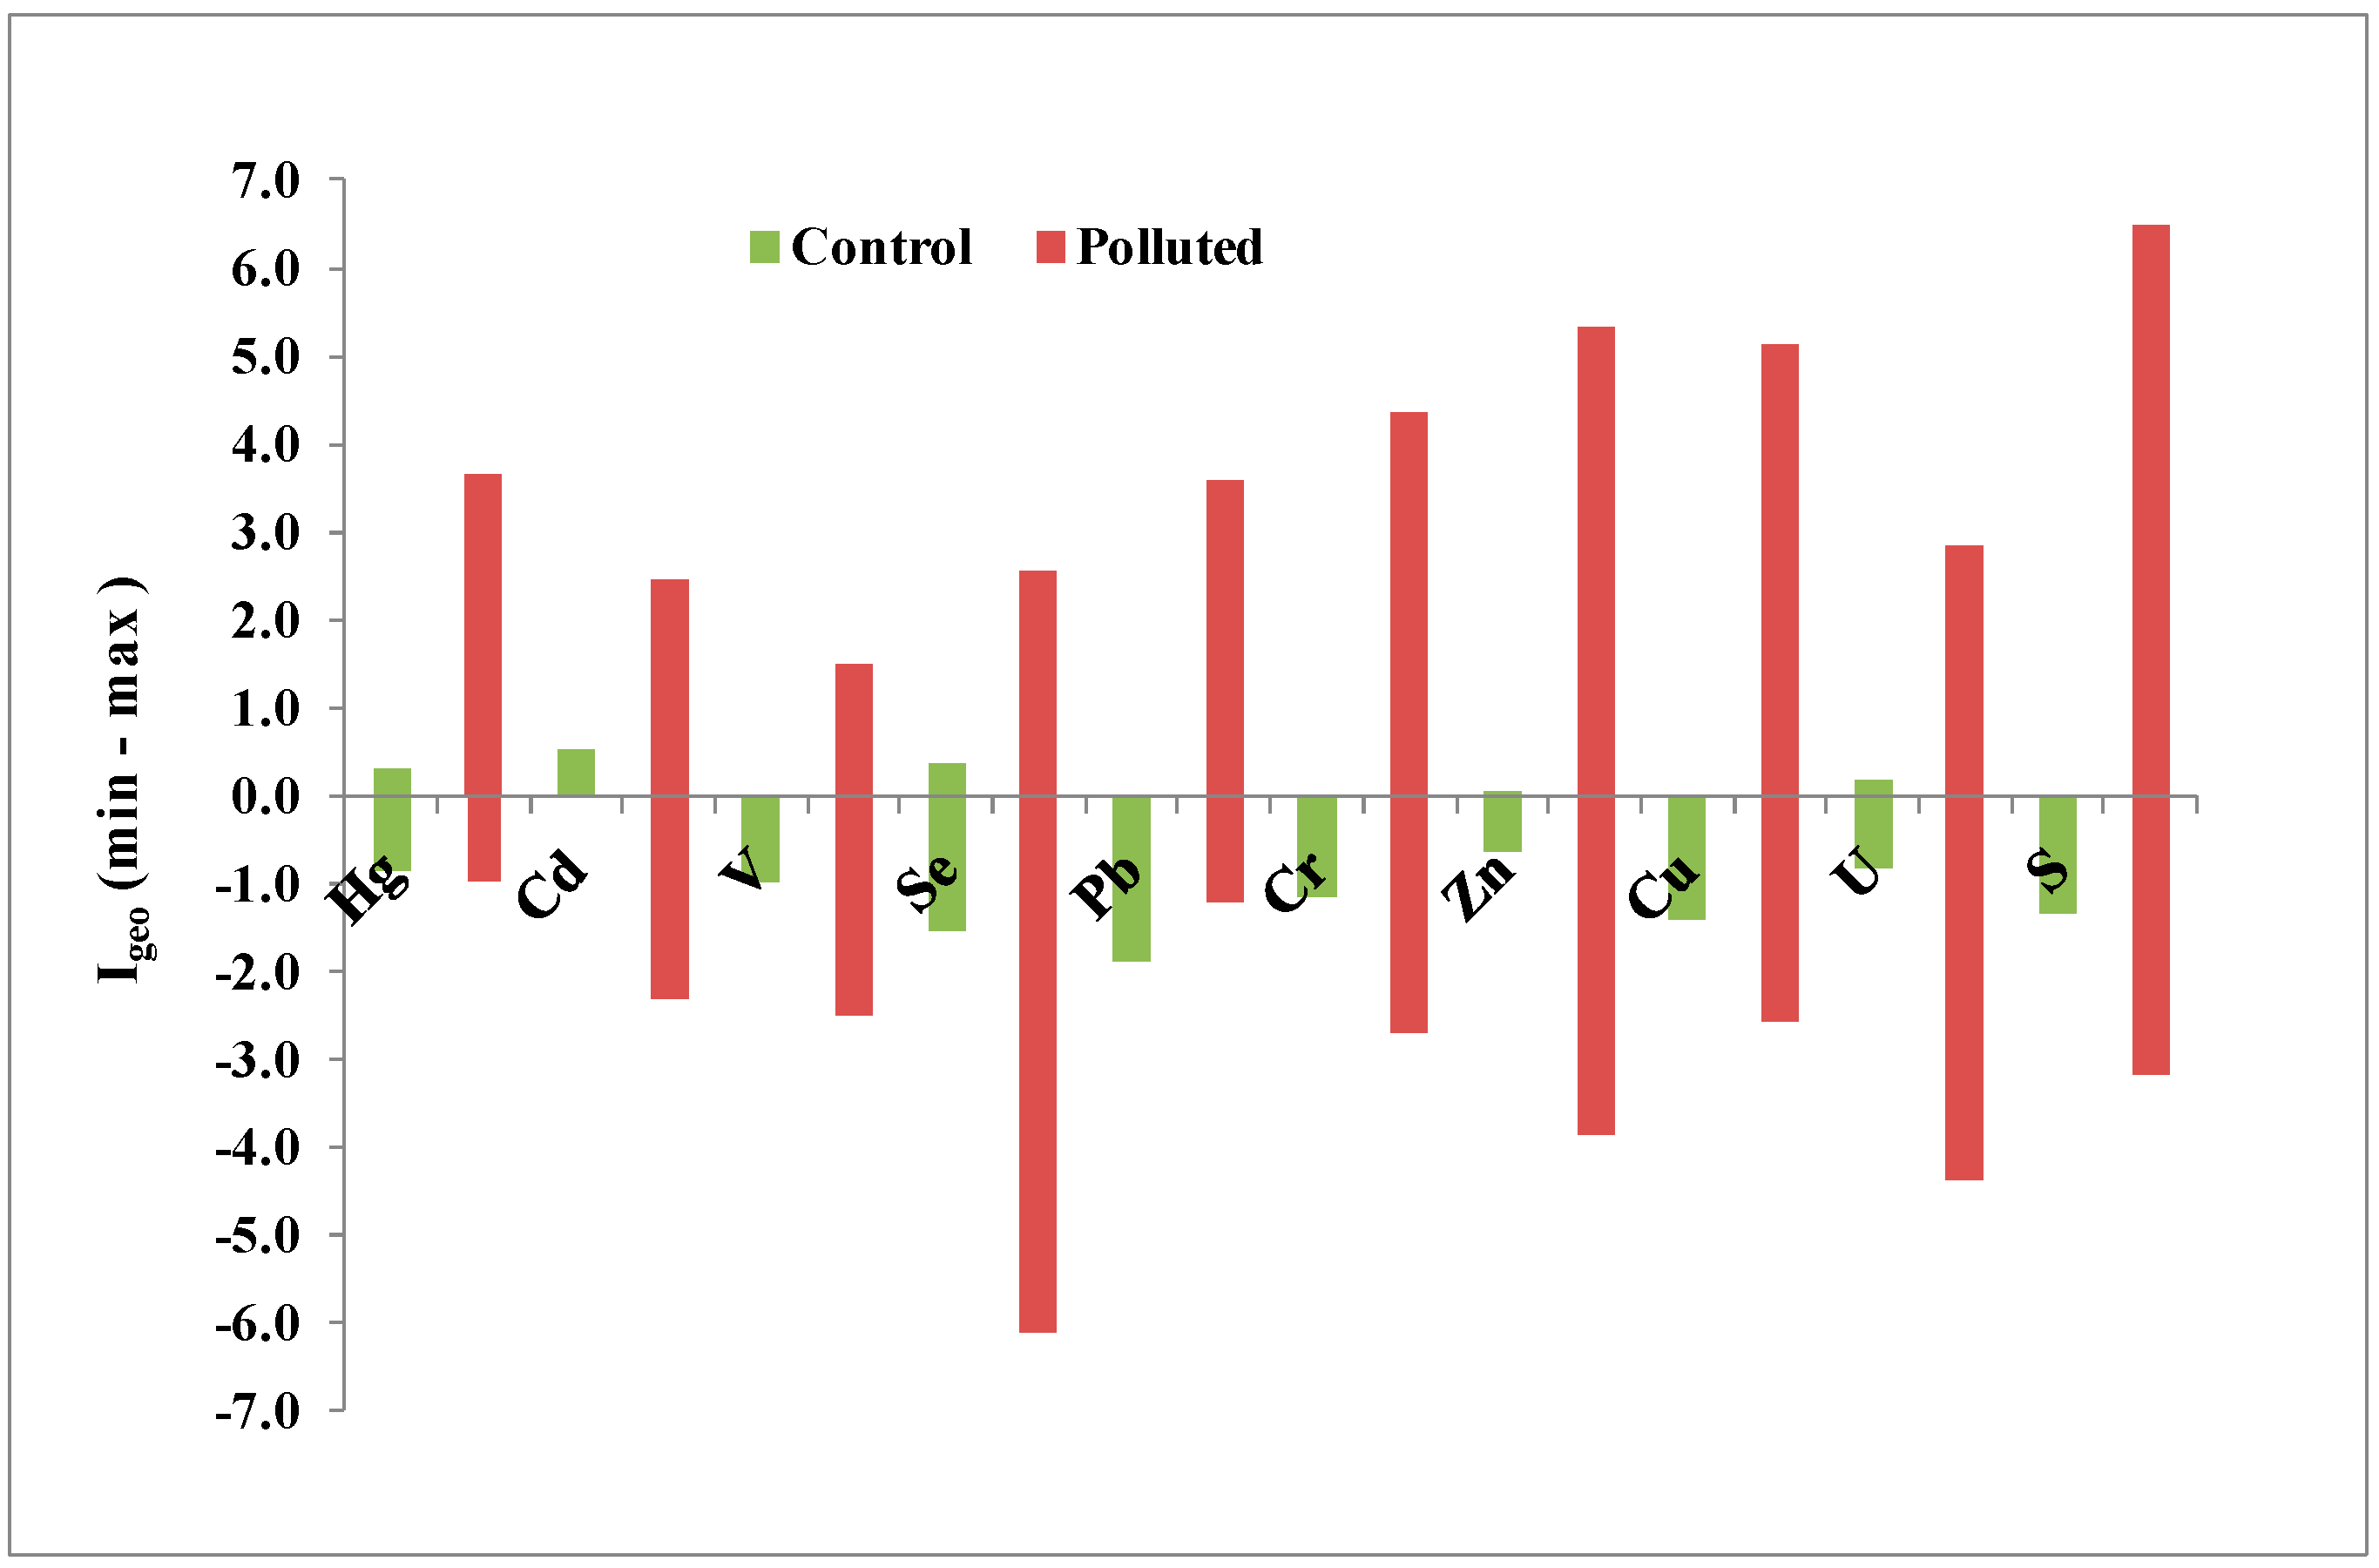
3.3. Ecological Risk Assessment Indices

By calculating various element ratios (ecological indices, Table 5), it was possible to envisage a numerical scale of the analysed environmental contamination. Control soil was essentially devoid of contamination by analysed elements due to low levels of all the calculated indices. Considering the Labin soil, V exhibited a considerable degree of contamination (Cdeg = 26.2), while the rest of the analysed elements showed rather high degrees of contamination (Cdeg 35.1, and 924 for Cd and S, respectively). In fact, a high level of pollution is indicated based on the max IPI value of 135. One paper [60] reported EF values of trace elements in soil contaminated by a coal-fired power plant, within the range 0.2–31.8, while EF values in this study were between 0.97 and 27.9. Figure 6 shows Igeo values that are indicative of high levels of pollution of Labin soil with the analysed elements; among the metals, zinc exhibited the highest max value (Igeo 5–6). Although Zn is an essential element in plant nutrition [26], its elevated concentrations can induce phytotoxic effects in plant communities [61].

4. Conclusions

This study showed that historic coal mining and combustion, as well as the accompanying metal/foundry industries, have appreciably polluted the entire environment of the Labin city area. Due to the coal enrichment in S, Se, V and U, the same elements were found to be elevated primarily in soil, but also in surface water as well as in home-grown lettuce. Some future studies should cover other food items to get a better insight into this issue. Seawater (unfiltered) was found to have very high levels of selenium (2015-campaign), which should be a matter of utmost concern with respect to marine life. Soil overlying the Štrmac site, which hosts huge quantities of ash and foundry waste, was found to have anomalously high Cu, Zn and Pb levels. The site lacks an impermeable lining, while its levels of Se tend to decrease, possibly due to leaking processes. Therefore, the site should be inspected more thoroughly, technically improved, and monitored so as to protect the local terrestrial and marine environment. Other potentially toxic trace metals like Pb, Cr, Hg and Cd were also slightly to highly increased in soil, water, and lettuce samples. Their values were attributed to the coal-based industry, an inadequate municipal wastewater system, and abandoned ash waste exposed to atmospheric conditions. Ecological risk assessment indices point to appreciable threats to ecological communities, posed by anomalously high metal(loid) and S levels in soil, water, and vegetable domains at the most polluted sites. Our ongoing studies are focused on floral, faunal, SHOS coal and ash specimens in order to understand the scale of the environmental problem outlined here, and a bioremediation strategy.

Author Contributions

Conceptualization, G.M.; methodology, G.M.; field work, A.K. and M.B.; software, B.L.O. and A.K.; validation, A.K. and M.Đ.; formal analysis, Ž.K., K.D. and A.R.; investigation, G.M.; data analysis, G.M.; writing—original draft preparation, G.M.; writing—review and editing, G.M.; visualization, G.M., B.L.O. and A.K.

Funding

This research received no external funding.

Conflicts of Interest

The authors declare no conflict of interest.

References

  1. Awoyemi, O.M.; Dzantor, E.K. Toxicity of coal fly ash (CFA) and toxicological response of switchgrass in mycorrhiza-mediated CFA-soil admixtures. Ecotoxicol. Environ. Saf. 2017, 144, 438–444. [Google Scholar] [CrossRef] [PubMed]
  2. Sofilić, T.; Brnardić, I.; Šimunić-Mežnarić, V.; Šorša, A. Soil pollution caused by landfilling of nonhazardous waste from steel production processes. Chem. Ind. 2013, 62, 381–388. [Google Scholar]
  3. Saikia, J.; Saikia, P.; Boruah, R.; Saikia, B.K. Ambient air quality and emission characteristics in and around a non-recovery type coke oven using high sulphur coal. Sci. Total Environ. 2015, 530, 304–313. [Google Scholar] [CrossRef] [PubMed]
  4. Medunić, G.; Mondol, D.; Rađenović, A.; Nazir, S. Review of the latest research on coal, environment, and clean technologies. Min. Geol. Pet. Eng. Bull. 2018, 33, 13–21. [Google Scholar] [CrossRef]
  5. Clarke, L.B.; Sloss, L.L. Trace Elements—Emissions from Coal Combustion and Gasification; IEA Coal Research: London, UK, 1992; p. 111. [Google Scholar]
  6. Medunić, G.; Šmit, Z. Organic micropollutants in the Sava and Bosna river overbank and floodplain sediments during the May through June 2014 catastrophic flood. Min. Geol. Pet. Eng. Bull. 2015, 31, 45–52. [Google Scholar] [CrossRef]
  7. Medunić, G.; Rađenović, A.; Bajramović, M.; Švec, M.; Tomac, M. Once grand, now forgotten: What do we know about the superhigh-organic-sulphur Raša coal? Min. Geol. Pet. Eng. Bull. 2016, 34, 27–45. [Google Scholar] [CrossRef]
  8. Medunić, G.; Kuharić, Ž.; Krivohlavek, A.; Fiket, Ž.; Rađenović, A.; Gödel, K.; Kampić, Š.; Kniewald, G. Geochemistry of Croatian superhigh-organic-sulphur Raša coal, imported low-S coal, and bottom ash: Their Se and trace metal fingerprints in seawater, clover, foliage, and mushroom specimens. Int. J. Oil Gas Coal Technol. 2018, 18, 3–24. [Google Scholar] [CrossRef]
  9. Medunić, G.; Ahel, M.; Božičević Mihalić, I.; Gaurina Srček, V.; Kopjar, N.; Fiket, Ž. Toxic airborne S, PAH, and trace element legacy of the superhigh-organic-sulphur Raša coal combustion: Cytotoxicity and genotoxicity assessment of soil and ash. Sci. Total Environ. 2016, 566, 306–319. [Google Scholar] [CrossRef] [PubMed]
  10. Radić, S.; Medunić, G.; Kuharić, Ž.; Roje, V.; Maldini, K.; Vujčić, V.; Krivohlavek, A. The effect of hazardous pollutants from coal combustion activity: Phytotoxicity assessment of aqueous soil extracts. Chemosphere 2018, 199, 191–200. [Google Scholar] [CrossRef] [PubMed]
  11. Fiket, Ž.; Medunić, G.; Kniewald, G. Rare earth elements distribution in soil nearby thermal power plant. Environ. Earth Sci. 2016, 75, 598. [Google Scholar] [CrossRef]
  12. Sharma, N.; Bhatnagar, P.; Chatterjee, S.; John, P.J.; Soni, I.P. Bio Nanotechnological Intervention: A Sustainable Alternative to Treat Dye Bearing Waste Waters. Indian J. Pharm. Biol. Res. 2017, 5, 17–24. [Google Scholar] [CrossRef]
  13. Halamić, J.; Peh, Z.; Miko, S.; Galović, L.; Šorša, A. Geochemical atlas of Croatia: environmental implications and geodynamical thread. J. Geochem. Explor. 2012, 115, 36–46. [Google Scholar] [CrossRef]
  14. Miko, S.; Prohić, E.; Durn, G.; Šparica, M. Selenium distribution and mobility in Mediterranean karst soils from a coal mining region in Istria, Croatia. In Proceedings of the 6th International Symposium on Environmental Geochemistry, Edinburgh, Scotland, 7–11 September 2003. [Google Scholar]
  15. Durn, G.; Ottner, F.; Slovenec, D. Mineralogical and geochemical indicators of the polygenetic nature of terra rossa in Istria, Croatia. Geoderma 1999, 91, 125–150. [Google Scholar] [CrossRef]
  16. ASTM International. Standard Test Methods for Total Sulfur in the Analysis Sample of Refuse-Derived Fuel. Available online: https://www.astm.org/Standards/E775.htm (accessed on 7 September 2018).
  17. Fiket, Ž.; Roje, V.; Mikac, N.; Kniewald, G. Determination of arsenic and other trace elements in bottled waters by high resolution inductively coupled plasmamass spectrometry. Croat. Chem. Acta 2007, 80, 91–100. [Google Scholar]
  18. Halamić, J.; Miko, S. Geochemical Atlas of the Republic of Croatia; Croatian Geological Survey: Zagreb, Croatia, 2009; p. 87. [Google Scholar]
  19. Loska, K.; Wiechula, D.; Korus, I. Metal contamination of farming soils affected by industry. Environ. Int. 2004, 30, 159–165. [Google Scholar] [CrossRef]
  20. Müller, G. Index of geoaccumulation in sediments of the Rhine River. Geojournal 1969, 2, 108–118. [Google Scholar]
  21. Hakanson, L. An ecological risk index for aquatic pollution control. A sedimentological approach. Water Res. 1980, 14, 975–1001. [Google Scholar] [CrossRef]
  22. Wei, B.; Yang, L. A review of heavy metal contaminations in urban soils, urban road dusts and agricultural soils from China. Microchem. J. 2010, 94, 99–107. [Google Scholar] [CrossRef] [Green Version]
  23. Kabata-Pendias, A. Trace Elements in soils and Plants, 4th ed.; CRC Press/Taylor & Francis Group: Boca Raton, FL, USA, 2010; p. 548. ISBN I978-1-4200-9368-1. [Google Scholar]
  24. Prohić, E.; Hausberger, G.; Davis, J.C. Geochemical patterns in soils of the karst region, Croatia. J. Geochem. Explor. 1997, 60, 139–155. [Google Scholar] [CrossRef]
  25. Reimann, C.; de Caritat, P. Chemical Elements in the Environment: Factsheets for the Geochemist and Environmental Scientist; Springer: Berlin/Heidelberg, Germany, 1998; p. 398. ISBN 978-3-642-72016-1. [Google Scholar]
  26. Adriano, D.C. Trace Elements in Terrestrial Environments: Biogeochemistry, Bioavailability, and Risks of Metal; Springer: New York, NY, USA, 2001; p. 867. ISBN 978-0-387-21510-5. [Google Scholar]
  27. Official Gazette. Regulations on the Protection of the Agricultural Land from Pollution. Available online: https://narodne-novine.nn.hr/clanci/sluzbeni/2010_03_32_745.html (accessed on 8 November 2018).
  28. Frančišković-Bilinski, S.; Scholger, R.; Bilinski, H.; Tibljaš, D. Magnetic, geochemical and mineralogical properties of sediments from karstic and flysch rivers of Croatia and Slovenia. Environ. Earth Sci. 2014, 72, 3939–3953. [Google Scholar] [CrossRef]
  29. Croatian Environment Agency. Croatian Soil Monitoring Programme. Available online: http://ec.europa.eu/environment/life/project/Projects/index.cfm?fuseaction=home.showFile&rep=file&fil=Soilmonitoring_Croatian.pdf (accessed on 7 November 2018).
  30. SMSP and FALCONBRIDGE NC SAS. Koniambo Project, Environmental Baseline Study—Summary. Available online: http://www.koniambonickel.nc/media/pdf/doc_pdf/resum_english.pdf (accessed on 7 November 2018).
  31. Baruah, B.P.; Khare, P. Mobility of trace and potentially harmful elements in the environment from high sulfur Indian coal mines. Appl. Geochem. 2010, 25, 1621–1631. [Google Scholar] [CrossRef]
  32. Singh, A.L.; Singh, P.K.; Singh, M.P.; Kumar, A. Environmentally sensitive major and trace elements in Indonesian coal and their geochemical significance. Energy Sources Part A Recovery Util. Environ. Eff. 2015, 37, 1836–1845. [Google Scholar] [CrossRef]
  33. Dai, S.; Seredin, V.V.; Ward, C.R.; Hower, J.C.; Xing, Y.; Zhang, W.; Song, W.; Wang, P. Enrichment of U–Se–Mo–Re–V in coals preserved within marine carbonate successions: Geochemical and mineralogical data from the Late Permian Guiding Coalfield, Guizhou, China. Miner. Depos. 2015, 50, 159–186. [Google Scholar] [CrossRef]
  34. Hower, J.C.; Greb, S.F.; Cobb, J.C.; Williams, D.A. Discussion on origin of vanadium in coals: Parts of the Western Kentucky (USA) No. 9 coal rich in vanadium. J. Geol. Soc. Lond. 2000, 157, 1257–1259. [Google Scholar] [CrossRef]
  35. Zhu, J.; Wang, N.; Li, S.; Li, L.; Su, H.; Liu, C. Distribution and transport of selenium in Yutangba, China: Impact of human activities. Sci. Total Environ. 2008, 392, 252–261. [Google Scholar] [CrossRef] [PubMed]
  36. Yudovich, Y.E.; Ketris, M.P. Selenium in coal: A review. Int. J. Coal Geol. 2006, 67, 112–126. [Google Scholar] [CrossRef]
  37. Naftz, D.L.; Rice, J.A. Geochemical processes controlling selenium in ground water after mining, Powder River Basin, Wyoming, U.S.A. Appl. Geochem. 1989, 4, 565–575. [Google Scholar] [CrossRef]
  38. Harkness, J.S.; Sulkin, B.; Vengosh, A. Evidence for coal ash ponds leaking in the Southeastern United States. Environ. Sci. Technol. 2016, 50, 6583–6592. [Google Scholar] [CrossRef] [PubMed]
  39. Valković, V.; Makjanić, J.; Jakšić, M.; Popović, S.; Bos, A.J.J.; Vis, R.D.; Wiederspahn, K.; Verheul, H. Analysis of fly ash by X-ray emission spectroscopy and proton microbeam analysis. Fuel 1984, 63, 1357–1362. [Google Scholar] [CrossRef]
  40. Helios Rybicka, E. Impact of mining and metallurgical industries on the environment in Poland. Appl. Geochem. 1996, 11, 3–9. [Google Scholar] [CrossRef]
  41. Verner, J.F.; Ramsey, M.H.; Helios Rybicka, E.; Jedrzejczyk, B. Heavy metal contamination of soils around a PbZn smelter in Bukowno, Poland. Appl. Geochem. 1996, 11, 11–16. [Google Scholar] [CrossRef]
  42. Svete, P.; Milačić, R.; Pihlar, B. Optimisation of an extraction procedure for determination of total water-soluble Zn, Pb and Cd and their species in soils from a mining area. Ann. Chim. 2000, 90, 323–334. [Google Scholar]
  43. Medunić, G.; Tomašić, N.; Balen, D.; Oreščanin, V.; Prohić, E.; Kampić, Š.; Ivanišević, D. Distribution of copper and zinc in the soil of an industrial zone in the city of Garešnica, Croatia. Geol. Croat. 2009, 62, 179–187. [Google Scholar] [CrossRef]
  44. Yang, G.Q.; Wang, S.Z.; Zhou, R.H.; Sun, S.Z. Endemic selenium intoxication of humans in China. Am. J. Clin. Nutr. 1983, 37, 872–881. [Google Scholar] [CrossRef] [PubMed] [Green Version]
  45. Davis, R.D. Use of sewage sludge on land in the United Kingdom. Water Sci. Technol. 1987, 19, 1–8. [Google Scholar] [CrossRef]
  46. Aleksander-Kwaterczak, U.; Helios Rybicka, E. Contaminated sediments as a potential source of Zn, Pb, and Cd for a river system in the historical metalliferous ore mining and smelting industry area of South Poland. J. Soils Sediments 2009, 9, 13. [Google Scholar] [CrossRef]
  47. Warren, L.J. Contamination of sediments by lead, zinc and cadmium: A review. Environ. Pollut. Ser. B Chem. Phys. 1981, 2, 401–436. [Google Scholar] [CrossRef]
  48. Official Gazette. Regulations on Classification of Waters. Available online: https://narodne-novine.nn.hr/clanci/sluzbeni/full/1998_06_77_1037.html (accessed on 7 November 2018).
  49. Ternjej, I.; Gaurina Srček, V.; Mihaljević, Z.; Kopjar, N. Cytotoxic and genotoxic effects of water and sediment samples from gypsum mining area in channel catfish ovary (CCO) cells. Ecotoxicol. Environ. Saf. 2013, 98, 119–127. [Google Scholar] [CrossRef] [PubMed]
  50. Official Gazette. Regulations on Water from Karst and Table Waters. Available online: https://narodne-novine.nn.hr/clanci/sluzbeni/2013_06_81_1723.html (accessed on 7 November 2018).
  51. Swartjes, F.A. Risk-based assessment of soil and groundwater quality in the Netherlands: Standards and remediation urgency. Risk Anal. 1999, 19, 1235–1249. [Google Scholar] [CrossRef] [PubMed]
  52. Valentine, J.L.; Kang, H.K.; Spivey, G.H. Selenium levels in human blood, urine, and hair in response to exposure via drinking water. Environ. Res. 1978, 17, 347–355. [Google Scholar] [CrossRef]
  53. Lemly, A.D. Environmental implications of excessive selenium: A review. Biomed. Environ. Sci. 1997, 10, 415–435. [Google Scholar] [PubMed]
  54. Dreher, G.B.; Finkelman, R.B. Selenium mobilization in a surface coal mine, Powder River Basin, Wyoming, U.S.A. Environ. Geol. Water Sci. 1992, 19, 155–167. [Google Scholar] [CrossRef]
  55. Lemly, A.D. Guidelines for evaluating selenium data from aquatic monitoring and assessment studies. Environ. Monit. Assess. 1993, 28, 83–100. [Google Scholar] [CrossRef] [PubMed]
  56. Stančić, Z.; Vujević, D.; Gomaz, A.; Bogdan, S.; Vincek, D. Detection of heavy metals in common vegetables at Varaždin City Market, Croatia. Arch. Ind. Hyg. Occup. Med. 2016, 67, 340–350. [Google Scholar] [CrossRef] [PubMed] [Green Version]
  57. Terry, N.; Zayed, A.M.; de Souza, M.P.; Tarun, A.S. Selenium in higher plants. Ann. Rev. Plant Physiol. 2000, 51, 401–432. [Google Scholar] [CrossRef] [PubMed]
  58. Klapec, T.; Mandić, M.L.; Grgić, J.; Primorac, L.; Perl, A.; Krstanović, V. Selenium in selected foods grown or purchased in eastern Croatia. Food Chem. 2004, 85, 445–452. [Google Scholar] [CrossRef]
  59. Pappa, E.C.; Pappas, A.C.; Surai, P.F. Selenium content in selected foods from the Greek market and estimation of the daily intake. Sci. Total Environ. 2006, 372, 100–108. [Google Scholar] [CrossRef] [PubMed]
  60. Mandal, A.; Sengupta, D. An assessment of soil contamination due to heavy metals around a coal-fired thermal power plant in India. Environ. Geol. 2006, 51, 409–420. [Google Scholar] [CrossRef]
  61. Fernàndez-Martínez, J.; Zacchini, M.; Fernández-Marín, B.; García-Plazaola, J.I.; Fleck, I. Gas-exchange, photo-and antioxidant protection, and metal accumulation in I-214 and Eridano Populus sp. clones subjected to elevated zinc concentrations. Environ. Exp. Bot. 2014, 107, 144–153. [Google Scholar] [CrossRef]
Figure 1. Map of the study area: (A) geographical position and sampling location names. Letters in parentheses refer to the relevant parts of the figure. Abbreviations are as follows: PPP—Plomin power plant, PPV—Vlaška power plant; (B) side view of the Štrmac location (ash waste pile); (C) front view of the Štrmac location (the arrow indicates a soil sampling site); (D) water sampling site (Krapan stream in the town of Krapan), the arrow shows the position of a chrome plating factory; (E) water sampling site (Krapan stream in the city of Raša), the arrow shows the position of municipal wastewater effluent; and (F) soil sampling site near PPV. Symbols R1–R7 designate water sampling sites of the 2018 campaign (details described in method chapter).
Geosciences 08 00408 g001
Figure 2. Soil selenium and trace metal contour maps.
Geosciences 08 00408 g002
Figure 3. Soil arsenic and trace metal contour maps.
Geosciences 08 00408 g003
Figure 4. Line plots of element concentrations (µg/L) measured in selected water-extracted soil samples: RC—soil polluted with Raša coal debris, F—soil overlying an old ash/foundry waste landfill, MF—soil polluted mostly by metal factory, and MWE—soil close to a municipal wastewater effluent channel.
Geosciences 08 00408 g004
Figure 5. Box-plots of total element concentrations (µg/L) measured in surface water samples (2015-campaign: SW—seawater, RR—Raša River, MWE—municipal wastewater effluent, and RC—water flowing out of a SHOS Raša coal mine (the Krapan site). Whiskers—min-max values, box—Q1–Q3 values, the middle point in a box—median value.
Geosciences 08 00408 g005
Figure 6. The range values of geo-accumulation indices (Igeo) of analysed elements in control and polluted (Labin) soil samples.
Geosciences 08 00408 g006
Table 1. Variable concentrations in control soil (n = 5) compared with relevant published data a–c ([18] a,b, [23] c). S (total sulphur), and LOI (loss on ignition) in %, trace elements in mg/kg, and CEC in mEq/100 g.
MeanSDMinMaxRange aMedian bMean c
Hg0.080.020.050.110.06–0.500.060.07
Cd0.720.080.640.810.40–0.900.400.41
V16327.2132189141–243148129
Se1.320.770.602.24-1.15 *0.44
Pb37.13.1333.841.833.0–46.048.027.0
Sr99.228.255.912299.0–258117175
Cr61.63.8956.165.4115–14260.059.5
Zn12625.5103.716788.0–11610870.0
Cu31.93.9127.937.417.0–35.031.038.9
U2.620.811.973.97-2.32 *3.00
S0.060.020.040.08-0.06 *-
pH7.050.136.907.20
CaCO30000
LOI12.51.7310.314.6
CEC21.13.7616.125.2
a Element values representative of the Labin area; b Element values representative of the coastal Croatian background; c Summarized world element values; * Element median values representative of the background in EU countries.
Table 2. Values (mean, SD, min, and max) of variables measured in Labin soil (n = 16), and sediment (n = 1) samples compared with relevant published data a–e. Underlined values refer to sediment reference levels. S, LOI, and CaCO3 in %, trace elements in in mg/kg, and CEC in mEq/100 g.
VariablePresent StudyPublished Data
MeanSDMinMaxSedimentabcde
Hg0.550.340.051.140.380.050.070.50–1.0050
0.090.01–0.12.490.20 (2 *)
Cd0.70.970.123.290.210.30.50–1.0050
1.80.530.260.60 (10 *)
V19421638.962433.790
9832.8
Se2.782.910.0310.30.840.3
2.3<5.000.63
Pb13619030.88721931750.0–1001000
2680.0–10021.231.0 (250 *)
Sr25016525.7655374240
187224.7
Cr16041114186031.48040.0–80.0750
6444.926.0 (110 *)
Zn990185011.265803507060.0–1501200
8070.490.0 (200 *)
Cu3676218.9118501162560.0–90.0500
1928.928.0 (110 *)
U5.936.780.1725.20.512.7
50.49
S2.772.810.018.1-0.08
pH7.290.396.57.92-
CaCO330.317.11.2755.9-
LOI2918.51183.1-
CEC12.57.771.625.5-
a Soil and sediment (<2 mm, total) world median data [25]; b Mean values [26]; c Croatian legislative values for medium texture soil [27]; sediment data [28]; d Limit values for soil in industrial and commercial areas [29]; e Sediment quality criteria [30]; * Toxic levels.
Table 3. Published values of trace elements in natural water according to Croatian legislative levels of water pollutants [48] a, from a Croatian karst locality [54] b, and [55] c (LW—land water: 1—no pollution, 2—element values are not significantly higher than natural ones, 3—element values are lower than constant toxic levels, 4—element values are periodically higher than constant toxic levels, without causing constant toxic conditions, and 5—element values are higher than constant toxic levels, causing acute toxic conditions; SW—seawater: 1—coastal sea, 2—sea directly affected by pollution from land and islands), and average world seawater [25] d (all in µg/L).
abcd
LW 1, 2LW 3–5SW 1SW 2
Cd0.015.000.10–0.500.50–5.000.10–0.500.50–2.500.11
Cr<0.0150.01.00–6.006.00–20.01.00–6.006.00–20.00.30
Cu0.2620002.00–10.010.0–20.02.00–10.010.0–20.00.25
Hg1.000.005–0.020.02–1.000.005–0.020.02–0.300.03
Pb0.0110.00.10–2.002.00–80.00.10–2.002.00–80.00.03
Se10.010.010.010.010.00.20
Sr6017900
U3.20
V0.185.001002001002002.50
Zn0.603,00050.0–80.080.0–20050.0–80.080.0–2000.03
Table 4. Trace element and BTEX levels (µg/L) in water samples of the 2018-campaign (R1–R7 symbols are described on Figure 1).
R1R2R3R4R5R6R7
Al9.824.8313.118.013.818.613.5
As0.540.350.690.580.780.640.98
Cd0000.020.020.0020.02
Co0.080.030.080.090.040.020.01
Cr0.941.071.080.682.020.680.53
Cu2.510.922.0256.61.502.912.25
Fe0.020.010.020.040.030.350.04
Hg00.0400.030.0020.0040
Mn0.7808.480.970.831.280.47
Pb0.03000.010.130.200.39
Se6.328.570.570.0400.410.41
Zn3.4507.340.681.606.474.39
Benzene00.010.010.8300.730
Toluene0.080.070.070.080.070.060.07
Ethylbenzene0000000
m, p-xylene0000000
o-xylene0000000
Table 5. Mean values of ecological risk indices (EF—enrichment factor, Cf—contamination factor, Cdeg—contamination degree, and IPI—integrated pollution index) calculated for control and polluted (Labin) soil samples; numbers in bold exceed the respective values of the polluted soil group.
ControlPolluted
EFCfCdegEFCfCdeg
Hg1.671.336.676.559.15182
Cd2.251.798.941.461.7635.1
V1.361.105.520.971.3126.2
Se1.291.155.751.412.4248.4
Pb0.990.773.861.822.8356.7
Cr1.331.035.134.352.6753.4
Zn1.511.175.845.199.17183
Cu1.200.914.558.5510.5210
U1.371.135.641.372.5651.1
S1.160.974.8327.946.2924
IPIMeanSDMinMax
C1.130.380.522.03
P8.8621.10.02135

