Next Article in Journal
After the Fall: Legacy Effects of Biogenic Structure on Wind-Generated Ecosystem Processes Following Mussel Bed Collapse
Previous Article in Journal
Metabolic Fates of Evening Crop-Stored Sugar in Ruby-Throated Hummingbirds (Archilochus colubris)
 
 
Correction published on 15 October 2020, see Diversity 2020, 12(10), 401.
Article

Muddy Boots Beget Wisdom: Implications for Rare or Endangered Plant Species Distribution Models

by
Nora H. Oleas
1,2,3,*,
Kenneth J. Feeley
4,
Javier Fajardo
5,6,
Alan W. Meerow
7,
Jennifer Gebelein
8 and
Javier Francisco-Ortega
2,3
1
Centro de Investigación de la Biodiversidad y Cambio Climático, y Carrera de Ingeniería en Biodiversidad y Recursos Genéticos, Facultad de Ciencias del Medio Ambiente, Universidad Tecnológica Indoamérica, Machala y Sabanilla, Quito EC170301, Ecuador
2
Department of Biological Sciences, International Center for Tropical Botany, Cuban Research Institute, and Kimberly Green Latin American and Caribbean Center, Florida International University, Miami, FL 33199, USA
3
Kushlan Tropical Science Institute, Fairchild Tropical Botanic Garden, Coral Gables, FL 33156, USA
4
Department of Biology, University of Miami, Coral Gables, FL 33146, USA
5
Centro Universitario de Mérida, Universidad de Extremadura, 06800 Mérida, Spain
6
Real Jardín Botánico (RJB-CSIC), 28014 Madrid, Spain
7
National Germplasm Repository, Agricultural Research Service−Subtropical Horticultural Research Station United States Department of Agriculture, Miami, FL 33158, USA
8
Department of Earth and Environment, Florida International University, Miami, FL 33199, USA
*
Author to whom correspondence should be addressed.
Diversity 2019, 11(1), 10; https://doi.org/10.3390/d11010010
Submission received: 7 December 2018 / Revised: 9 January 2019 / Accepted: 9 January 2019 / Published: 15 January 2019

Abstract

:
Species distribution models (SDMs) are popular tools for predicting the geographic ranges of species. It is common practice to use georeferenced records obtained from online databases to generate these models. Using three species of Phaedranassa (Amaryllidaceae) from the Northern Andes, we compare the geographic ranges as predicted by SDMs based on online records (after standard data cleaning) with SDMs of these records confirmed through extensive field searches. We also review the identification of herbarium collections. The species’ ranges generated with corroborated field records did not agree with the species’ ranges based on the online data. Specifically, geographic ranges based on online data were significantly inflated and had significantly different and wider elevational extents compared to the ranges based on verified field records. Our results suggest that to generate accurate predictions of species’ ranges, occurrence records need to be carefully evaluated with (1) appropriate filters (e.g., altitude range, ecosystem); (2) taxonomic monographs and/or specialist corroboration; and (3) validation through field searches. This study points out the implications of generating SDMs produced with unverified online records to guide species-specific conservation strategies since inaccurate range predictions can have important consequences when estimating species’ extinction risks.

1. Introduction

There has been a rapid increase in the accessibility of species occurrence data via the World Wide Web [1,2,3,4]. International programs such as the Global Biodiversity Information Facility [5] and Species Link [6], among others, have gathered data from different sources (e.g., herbarium and museum collections), allowing users to rapidly obtain massive amounts of data. These data are often used to generate species distribution models. Species distribution models (SDMs) are estimates of the geographic range of species on the basis of relationships between the known occurrence of the species and underlying environmental factors such as precipitation, temperature, and seasonality, among others [7]. In general terms, SDMs depend on three main components: (1) species occurrence data; (2) environmental variables, and (3) statistical models. The accuracy of the SDMs’ predictions will be influenced by the precision of these three components. The potential applications of SDMs include conservation planning for the protection of rare and endangered species, prediction of invasive species propagation, estimates of niche evolution, reserve selection and design, and predictions of species’ distributions under different past and future climate change scenarios [8,9,10,11,12,13,14,15,16].
For the conservation of rare and endangered species, SDM applications can be reduced by the limitations associated with these types of species. For instance, many rare and endangered species are knowny few geographic records. It has been proposed that to obtain accurate models of a species’ geographic distribution, a minimum of 20 records per species is required [17,18]. In order to overcome this limitation, averages of ensembles of small models are used to estimate priority areas of conservation [19,20]. Even individual species conservation can be benefited by SDMs because it has been possible to find new populations in areas where SDMs suggested the presence of the species, even with models estimated with as little as five records [21,22].
Furthermore, for species occurrence data, there are many issues related to biological data acquired from large online databases that may limit their value in SDMs [23,24]. For instance, historical records from herbarium specimens often lack accurate geographical coordinates, information that is essential for carrying out SDMs [25]. Geographic coordinates can be procured from location data that may be available on records and using maps, gazetteer, or software [26,27]. Unfortunately, in many cases the geographical information found in the specimen labels is vague, and it might be difficult to assess to what extent errors were made in the original record. It has been suggested that Geographic Information System (GIS) analysis [28] and the use of environmental filters could help to screen for errors in species occurrence data [15]. Another potentially important but greatly underappreciated source of error in collection records is the need for taxonomic validation by experts since misidentifications will clearly have implications for the ability of SDMs to accurately portray species’ ranges [29,30,31].
The aim of this study is to evaluate the impact of different species occurrence data sources on SDM estimates. We focus on the potential problems that can arise from generating SDMs using unverified species records as available from large online databases since this is common practice. Toward this goal, we compared SDM range predictions for three species of the plant genus Phaedranassa from the Northern Andes. We generated SDMs with standard species occurrence data available online through the Global Biodiversity Information Facility (GBIF) and other sources and compared them to range predictions generated using records validated through directed field searches and re-evaluation of specimen taxonomic identity. By comparing the two sets of range estimates, we hope to highlight the importance of data quality and taxonomic verification in SDMs. Our second goal is to show the influence of the range predictions obtained from these two types of data for conservation assessment.

2. Materials and Methods

2.1. Study Species

Phaedranassa (Herb.) is a small genus of the Amaryllidaceae family. This genus is known by eleven species that, except for one species from Costa Rica, are limited to moist slopes and dry valleys in the Andean mountains of Colombia and Ecuador [32]. Out of the eleven Phaedranassa species, eight are native to Ecuador with seven of these being endemic to the country [33]. All the Ecuadorean endemic Phaedranassa species are classified as either “endangered” or “vulnerable to extinction” under the International Union for the Conservation of Nature (IUCN) criteria [34]. Only P. dubia has been collected in a natural reserve. Our study focuses on three species: P. cinerea, P. schizantha, and P. dubia. Both P. cinerea and P. schizantha are endemic to Ecuador, whereas P. dubia has been reported in Colombia, too [32].

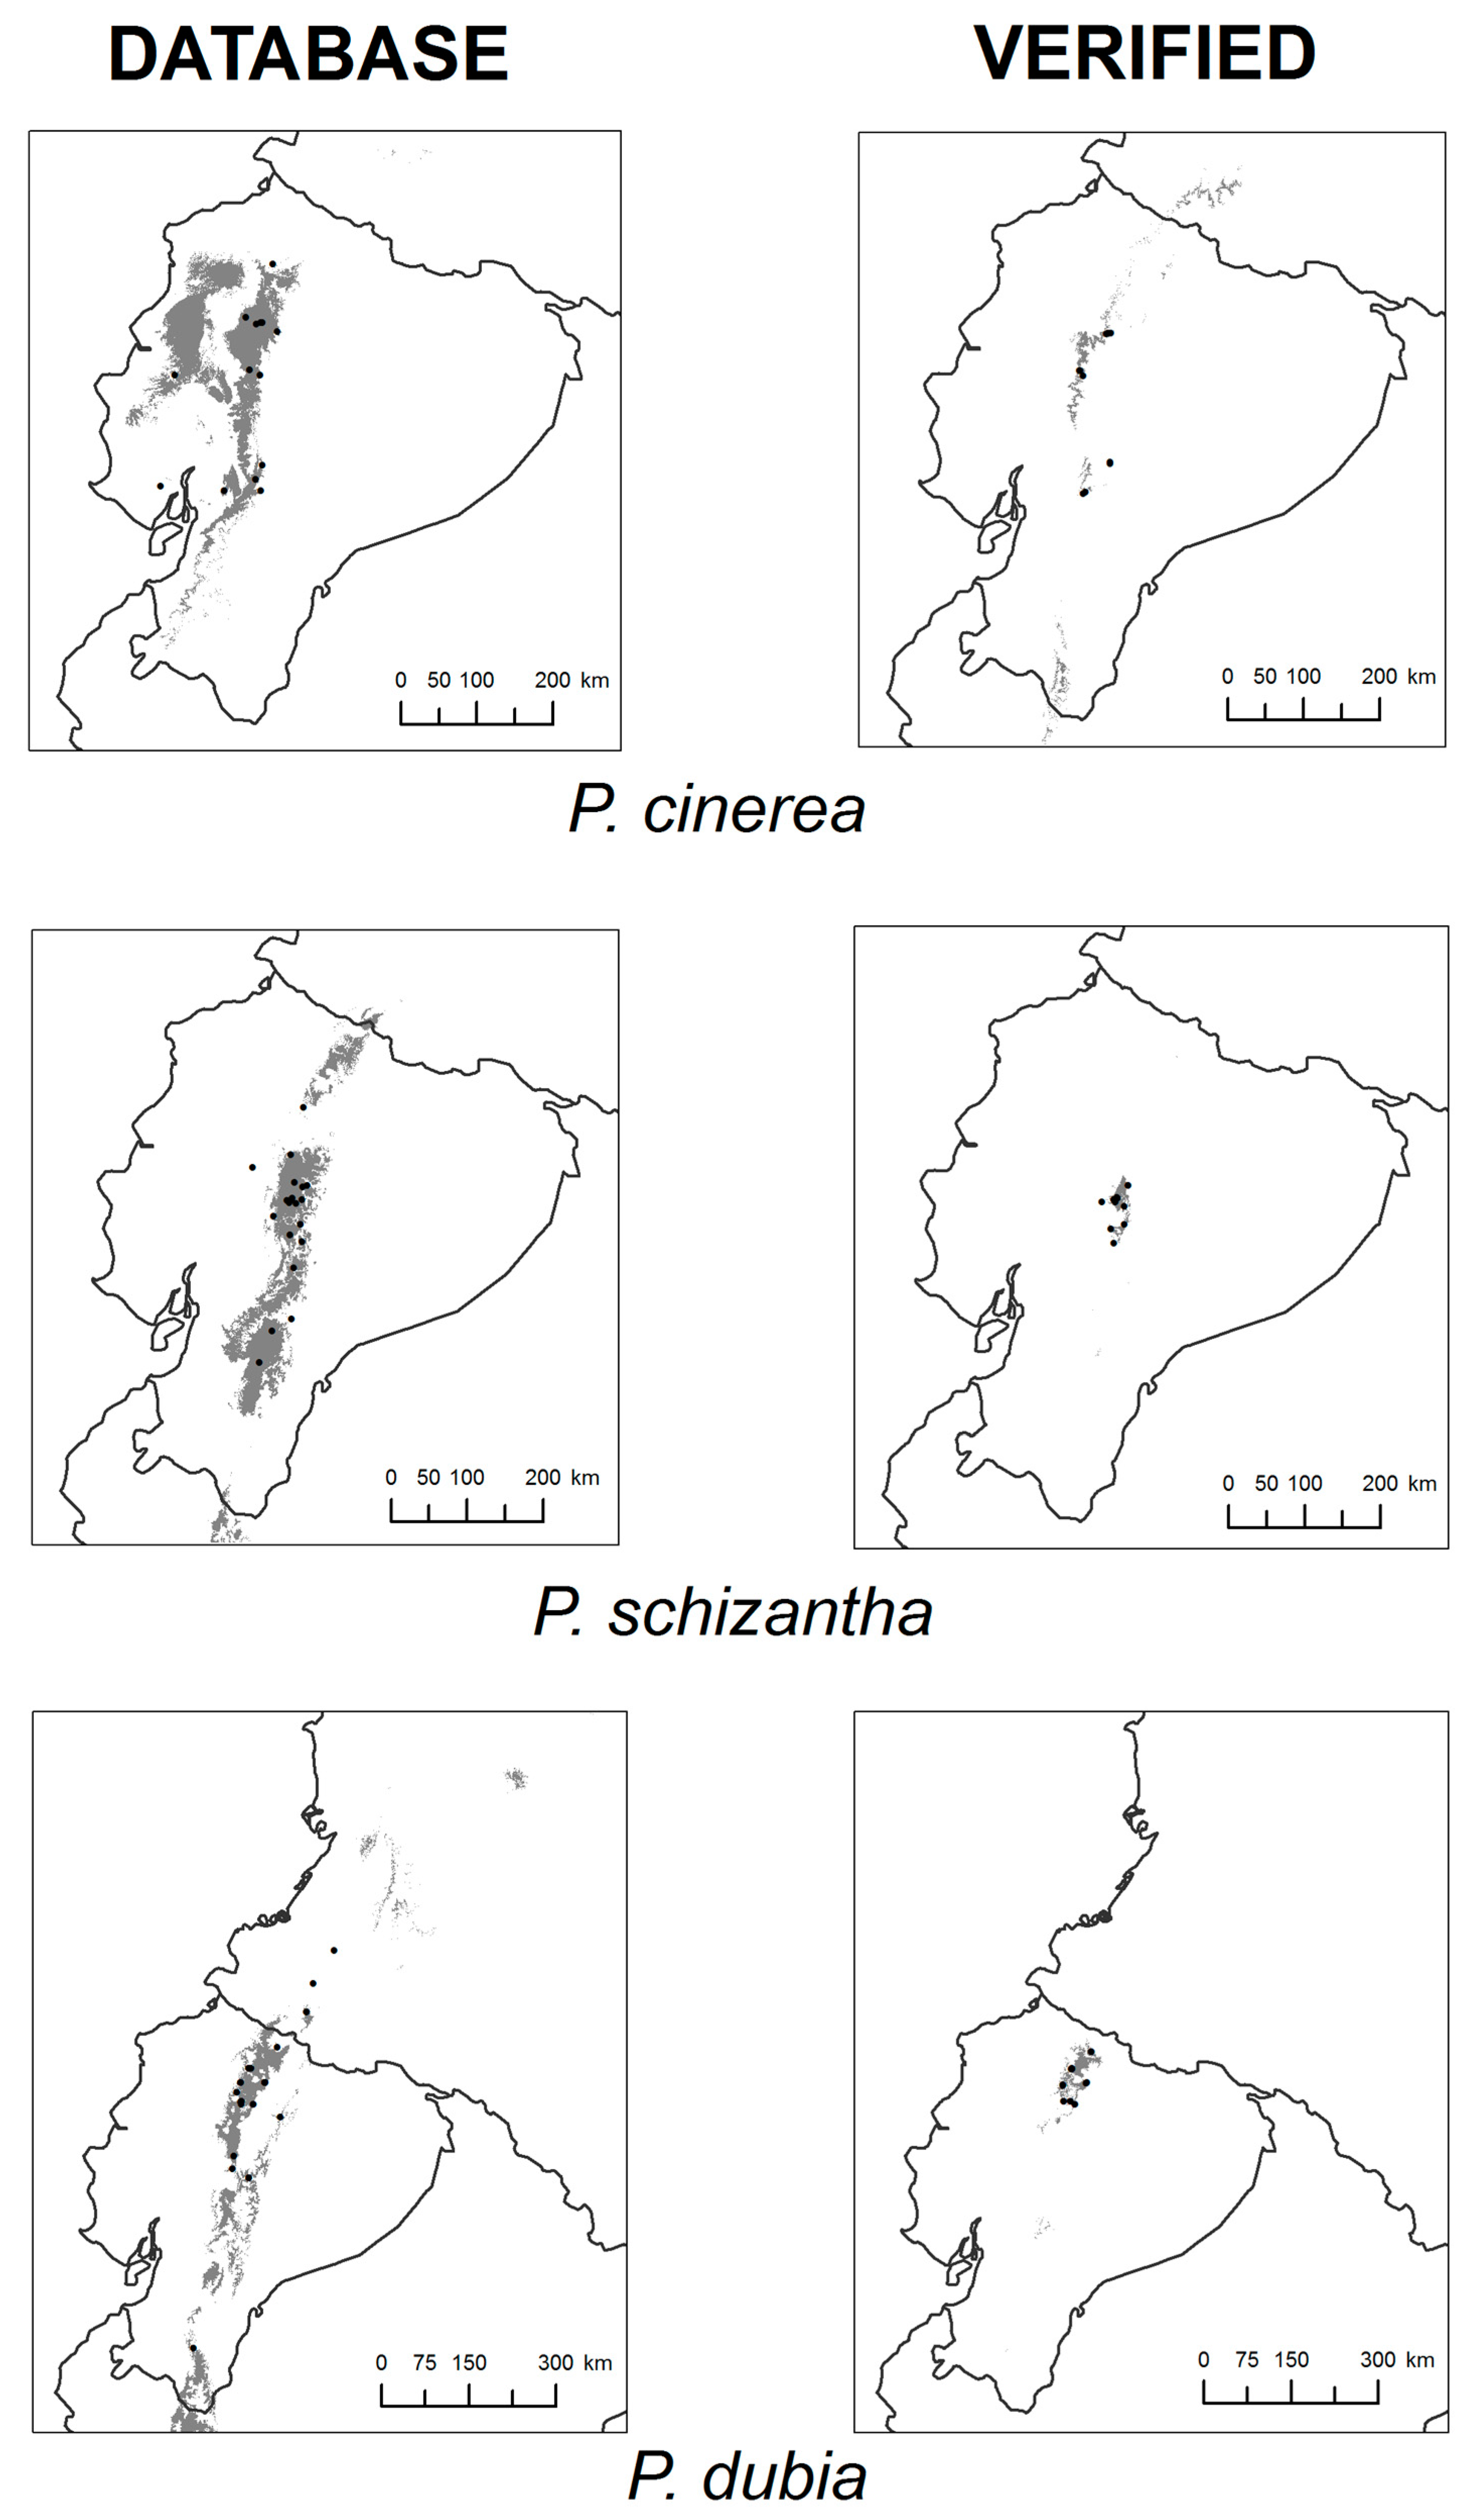
2.2. Collection of Occurrence Data

We gathered online records from the Global Biodiversity Information Facility (GBIF) [5], as is common practice to estimate SDMs. These data (hereafter denoted to as “database” records) came mostly from individual herbarium collections at (1) the Missouri Botanical Garden [35], (2) the University of Aarhus (Denmark) [36], (3) the New York Botanical Garden [37], (4) the Royal Botanical Garden Kew [38], and (5) the University of Florida Herbarium [39]. We also included records from the virtual herbarium of the Herbario Nacional de Bogotá [40]. Database records were derived from the labels of herbarium specimens, and they include species name and locality. If geographical coordinates were available at GIBF, they were included with no modification. Once the database records were obtained, we took additional common-practice steps to ensure that our database set had the best-possible quality. Specifically, we excluded any record for which the geographic coordinates were obviously incorrect (e.g., located in a large body of water) or located in a country other than Ecuador (for the two species endemic to Ecuador). Two records before the year 1900 were excluded because of uncertainties. Sixty-six percent of the database records were collected after 1950. In order to increase the amount of usable data, the listed localities of records without coordinates were georeferenced using regional maps. Georeferenced records of threatened species (sensu IUCN) are not provided in some online databases to prevent over-collection. Thus, coordinates for specimens of endangered species of Phaedranassa located in the TROPICOS database [35] were not available through GBIF [5] and were obtained directly through personal communications with staff from the herbarium of Missouri Botanical Garden (MO). The location coordinates were improved by adjusting them using Google Earth as reference [41].
Our second database comprised a corrected version of the database records. The correction process involved the taxonomic revision of each collection’s voucher and confirmation of the actual presence of the species at the field locations listed in the database records. The field searches, conducted by one of us (N.H.O.) between 1999 and 2009, were originally done as part of an extensive study of the population genetics of the genus [42]. All 60 Ecuadorean locations found in databases were visited at least twice to collect the species. During collections, the geographic position was recorded with an Etrex Garmin GPS unit on site. In addition, taxonomic identification of the records was confirmed by examining each voucher listed in the latest taxonomic treatment of the family [32]. In addition, more recent specimens were inspected personally by the author at the Herbario de la Pontificia Universidad Católica del Ecuador (QCA), Herbario Nacional del Ecuador (QCNE), and MO herbaria and identified to the species level using the keys in Meerow’s treatment [32]. The specimens from Colombia are digitally available online: we evaluated those specimens as to their species taxonomic determination.

2.3. Model Building

Species distribution models (SDMs) for the three Phaedranassa spp. were generated through ensemble models [43] implemented in BIOMOD 2.0 [44], a platform available in R that combines different modeling predictions to derive consensus models. Four techniques were used to build the ensemble models: MAXENT [45], generalized linear models (GLM) [46], gradient boosting machine (GBM) [47], and multiple adaptive regression splines (MARS) [48]. These four techniques have been considered to produce more satisfactory results [49]. Default parameters were used for the four techniques. Ensemble models were produced using the proportional weighted means of probabilities option where the predictive ability of each individual modeling method determines its proportional contribution. Ensemble models are increasing in popularity for species distribution modeling because they avoid the need for choosing a single modeling technique. Specifically, we used the TSS of each individual model to assign its proportional contribution [50].
For this study we used WorldClim Bioclimatic variables [51,52] with a spatial resolution of 30 arc second (~1 km2 at the Equator), as this is a common approach for SDMs. We removed correlated variables to avoid collinearity in the predictions, and generated models using the following variables: mean diurnal range (bio 2), isothermality (bio 3), temperature seasonality (bio 4), max temperature of warmest month (bio 5), precipitation of wettest month (bio 13), precipitation of driest month (bio 14), precipitation seasonality (bio 15), precipitation of warmest quarter (bio 18), and precipitation of coldest quarter (bio 19). Ensemble models are continuous probability maps that were transformed into a predicted bivariate map of potential presence versus absence of the species using a threshold approach. As we used presence-only data, we chose a threshold that minimizes the commission error, which predicts the presence of the species where it is not present. We allowed a commission error of 0.05 [49]. Modeling was conducted using 10,000 randomly generated pseudo-absences for each species.

2.4. Model Evaluation

We evaluated the predictive performance of each model by using a combination of three commonly used statistics, the receiver operating characteristic (ROC) and the true skill statistic (TSS) [53], and the Boyce index [54]. We incorporated a jackknife validation for small sample size [55]. We chose to evaluate the models with more than one statistic because measuring model predictive ability has been controversial, and the use of several algorithms has been recommended [56]. The ROC value shows the relationship between the false positive errors versus the true positive rate [7] and is usually reported as the area under the curve (AUC). The area under the curve is widely used because it is a threshold-independent measure that shows the probability that a random selection of species presence will show higher probability than an absence site chosen at random [7]. The TSS is a threshold-dependent statistic that has been proven superior for comparing binary models because it is independent of prevalence [53]. Both ROC and TSS values were obtained within BIOMOD 2.0, using the random pseudo-absences as part of the process. Finally, the Boyce index is a threshold-independent index that has been proposed to assess model performance of presence-only modeling methods [54]. The Boyce index was calculated for each ensemble model using the ecospat library [57] with default parameters.
Ideally, the evaluation process should be conducted using a set of data independent of the one used for the modeling. Thus, automatic altitude-based filters may not point out the error, this process was not possible because of the low number of available presences, since separating some of them to be left for the evaluation would have left too few remaining for model training, which would reduce model performance. This situation is commonly found when modeling in tropical areas [4,50]. To overcome this situation, we implemented a third step in the evaluation based on the jackknife validation approach proposed by Pearson et al. [55]. This approach represents an alternative to cross-validation with an independent dataset when fewer than 25 occurrences are available. It tests whether occurrences are correctly predicted as presences by binary models more often than expected at random [55].

2.5. Conservation Assessment

A common application of SDMs is to predict the impact of climate change on the potential range size and survivorships of focal species [58,59]. With this potential application in mind, we further evaluated the effect of using unverified data versus verified data in generating SDM range predictions. We compared the total area and elevational range of the distributions for each species obtained with each of the two datasets. Elevation ranges were based on the 95% quantiles of elevations within the predicted ranges as obtained from the altitude layer available in the WorldClim database [51].
The estimated distributional area for each species was evaluated against the IUCN criteria “extent of occurrence” (i.e., the area containing all the known or projected sites of current occurrence) for threatened species [60]. A taxon qualifies as “critically endangered” when its extent of occurrence is <100 km2, “endangered” when it is <5000 km2, and “vulnerable” when it is <20,000 km2. For this analysis, we used only P. cinerea and P. schizantha because the conservation status of endemic Ecuadorian species has been evaluated [34]. Phaedranassa dubia is located in Colombia and its global conservation status needs to be evaluated with information of both countries, which is not available at this point.

3. Results

Our results are based on a total of 66 records from databases and 34 records confirmed in the field (Table 1). We found 13, 27, and 20 records in the databases available online for P. cinerea, P. dubia, and P. schizantha, respectively. Out of those records, we could confirm a physical presence of the species in situ of 10, 14, and 10 records for P. cinerea, P. dubia, and P. schizantha, respectively. Fifty percent of the coordinates were different in the databases when compared with the records gathered in the field. We considered a different locality if the coordinate had at least a separation of one kilometer: most of the disagreements had a higher geographic separation. Taxonomic errors (misidentifications) were found in 14 records (21.21%) in the databases. Taxonomic issues were higher with P. dubia (37%).
The model performance as judged by TSS, AUC, and the Boyce index was high for the models (Table 1). Notably, the total geographic area predicted for each species was smaller when the model was generated using verified data (Figure 1; Table 1). For P. cinerea and P. dubia, the predicted range areas were over 10 times larger when based on the database versus verified records and for P. schizantha, the predicted range area was 20 times larger when based on the database versus verified records (Figure 1; Table 1). Likewise, the SDMs generated from the online database records resulted in significantly different and generally wider altitudinal range predictions for each species compared to the altitudinal range predictions generated with the verified data (Table 1).
Based on the projected extents of occurrence using the distribution models with online databases, P. cinerea does not qualify as threatened under IUCN criteria (Table 1). In contrast, when the field-verified data were used, P. schizantha (859 km2) and P. cinera (2584 km2) qualify as “endangered.” Considering only the geographic distribution of P. dubia in Ecuador (4396 km2), this species will also be “endangered.” Interestingly, we did not find P. dubia potentially distributed in Colombia and we did not find specimens of that species from Colombia.

4. Discussion

Online occurrence data available in venues such as the GBIF can contribute to a better understanding of geographic and ecological patterns in species distributions. However, the use of unverified data can potentially lead to inaccurate results and conclusions that are based on the predicted distributions. To highlight the need for careful verification, we compared range predictions of SDMs using data harvested directly from online databases (with standard levels of data filtering) to those obtained with data that has undergone more scrutiny (i.e., taxonomic and field verification).
Our results point out the necessity to carefully review and verify records from databases prior to executing modeling studies, especially in studies of a single species or in cases where sample size is limited. In this study, we found that the distribution models varied greatly on the basis of the data used even after accounting for differences in sample size. These disagreements are likely attributable to several different types of errors presented in the non-verified online data. For example, in one instance we found a collection record indicating that a specimen of P. cinerea had been collected from the Ecuadorian páramo (vegetation >4000 m) at higher altitudes than had previously been reported for this species. After further research (which involved contacting a crewmember of the botanic group that originally collected the plant specimen), we found that there was an error in the record´s label and that the specimen had been collected at a different location on the way to the páramo site. The label information on the specimen corresponded to the primary working area of the researchers and not the collection area of that particular plant. Along with this example, our results suggest that the geographic coordinates provided in the collection records were likely to be simple approximations of the actual collection locations with potentially large errors (error), which can be especially important for species that occur in topographically complex areas such as the Andes [15].
In this study, we dealt primarily with two types of errors: georeferencing errors and taxonomic misidentification. In order to minimize georeferencing error records in species occurrence data, filters using known features of the species range, such as altitude or ecosystem, can help to identify erroneous species records [4]. One potentially large source of error can be identified by reading the actual specimen labels. In this study, we found one living specimen for P. schizantha, of which the geographic coordinates was the address of the botanical garden where it is cultivated rather than the location of the natural origin of the specimen. By chance, this erroneous record fell within the natural altitudinal range of the species. Thus, automatic altitude-based filters may not point out the error.
The effects of taxonomic misidentifications have received considerably less attention. Our experience showed that taxonomic misidentification was higher in one species, P. dubia, probably because this species has the largest geographic distribution and collectors have identified the specimen using the most common species name. Furthermore, we did not find P. dubia in Colombia, because the available specimens are P. ventricosa. This has important conservation implications because based on the geographic distribution, P. dubia should be listed as endangered. Checking for taxonomic errors requires an evaluation of the physical herbarium specimen (or at least a digital image) by a specialist. Thus, checking for taxonomic errors cannot be easily automated and may be difficult to accomplish for large-scale, multi-taxa research. Taxonomic errors can be reduced by using records reported in recent taxonomic monographs because the taxonomy identification of the specimens has been verified by experts. Based on our experience, we can expect that the level of error of SDMs will be higher for species without recent taxonomic revisions.
A notable result of our comparisons is that the areas of the range predictions for the three studied species produced with the database records were always larger than those obtained with verified records. Because we have done an extensive search for the genus in the region for more than a decade, we can say that the geographic distribution predicted with online data does not represent the reality. The consistent inflation of range areas is likely the result of the georeferencing and taxonomic errors described above, which, in general, will expand estimates of species’ ranges [15]. The inflation of range predictions has very important conservation implications. The Ecuadorian endemic species P. cinerea and P. schizantha are currently listed as “vulnerable” B1ab(iii) [34]. If we were to believe the distributions as predicted from SDMs based on the online data, then both species would be removed from the threatened category. In contrast, the range predictions based on SDMs using the verified data indicate that P. cinerea and P. schizantha have a range extent of <5000 km2 and, thus, may qualify as “endangered.” In Ecuador, P. dubia also will be considered “endangered” for the same reasons, and because we have not found specimens of the species from Colombia, this category probably is correct.
Beyond geographic extent, altitudinal range is an important feature of species distributions because of the connection between elevation and temperature and the fact that species with narrow altitudinal ranges are generally predicted to be more sensitive to climate-driven extinction than altitudinal generalists [61,62]. For example, if we compare the differences we found in altitude ranges predicted using the database versus verified records into differences in thermal niche breadths (assuming an adiabatic lapse rate of ~5.5 °C colder per km elevation gain), for our most restricted species, P. schizantha, there is a difference of 5.1 °C in the estimates for the lowest altitudinal limit of the species and a difference of −4.3 °C in the upper altitudinal range limit, such as the thermal range of the species based on the online records is >9 °C wider than predicted with the verified records. In other words, the differences in thermal niche limits and breadths predicted for the study species on the basis of the different data sources is greater than some of the worst-case warming scenarios predicted for the Andes over the next century [63]. This result shows the danger of extrapolating the results of SDMs produced with unverified online records to species’ extinction risks linked to climate change.
One of the main problems for SDMs of tropical plant species, endangered species in particular, is the few species occurrence records openly available [4]. When conducting our study, we found additional specimen records in local herbaria in the country of origin that were not included in the online databases (these records were not incorporated in our analyses). An exemplary program that bypasses this problem is the partnership between the Missouri Botanical Garden herbarium and the Herbario Nacional (QCNE, Quito, Ecuador) through quick data and specimen sharing. Exchange programs between international institutions and local herbaria are greatly needed to provide a relatively inexpensive way to increase species representation in online databases.
Species distribution models are useful and powerful tools for conservation. Our results show that it is essential to address the limitations of the species occurrence data in order to avoid erroneous conclusions and posterior extrapolations. Data quality matters and records downloaded from online sources do not have the certainty and precision that comes with careful taxonomic revisions and fieldwork.

Our Recommendation List Summary

  • Be critical of each occurrence record. For the conservation of rare and endangered species, each point should be revised.
  • Check the taxonomy identification of the same collector’s number voucher. Sometimes specialists curate one of those specimens but not all and because GBIF combines data from multiple herbaria, the same collection can be identified as different species.
  • Plot the coordinates into a map. It is an easy way to identify outliers.
  • Use filters such as altitude or habitat when that kind of information is known for the species.
  • Read the original specimen label. Important annotations might not be available in the online database.
  • Besides online data, complement the number of records with information from recent taxonomy monographs, databases from permanent plots, and local herbaria. Collaborate with taxonomic specialists! Their understanding of the species is invaluable.

Author Contributions

Conceptualization, N.H.O., J.G., and K.J.F.; methodology, N.H.O., J.F., and K.J.F.; formal analysis, N.H.O., J.F., and K.J.F.; investigation, N.H.O., J.F., K.J.F., J.G., A.W.M., and J.F.-O.; data curation, N.H.O; writing—original draft preparation; N.H.O., J.F., K.J.F., J.G., A.W.M., and J.F.-O.; supervision: J.F.-O. and A.W.M; writing—review and editing, N.H.O., J.F., K.J.F., J.G., A.W.M., and J.F.-O.

Funding

This research was funded by the National Science Foundation (Grant DEB 0129179 to AWM); the Judith Evans Parker Travel Grant Program at Florida International University (to NO); the Dissertation Evidence Acquisition Fellowship at Florida International University (to NO); the South Florida Chapter of The Explorers Club (to NO); and the Universidad Tecnológica Indoamérica (Grant 207–2011 to NO).

Acknowledgments

This publication represents a chapter of the dissertation submitted in partial fulfillment of the requirements for the degree of Doctor of Philosophy in Biological Sciences at Florida International University [42] by NO under the supervision of JFO and AWM. The authors thank all of the botanists who deposit vouchers of collections from the Andes in herbaria and museums. This study was made possible by their work. We thank the GBIF and other similar efforts for compiling valuable species data and making it accessible on the web. We thank also the Missouri Botanical Garden, especially Carmen Ulloa-Ulloa, for providing access to records in the TROPICOS database. We thank Rubén G. Mateo for valuable discussions that improved this manuscript. This paper is contribution 362 from the Tropical Biology Program at Florida International University (FIU).

Conflicts of Interest

The authors declare no conflict of interest. The funders had no role in the design of the study; in the collection, analyses, or interpretation of data; in the writing of the manuscript, or in the decision to publish the results.

References

  1. Canhos, V.P.; Souza, S.; Giovanni, R.; Canhos, D.A.L. Global biodiversity informatics: Setting the scene for a “New World” of ecological modeling. Biodivers Inform. 2004. [Google Scholar] [CrossRef]
  2. Soberón, J.; Peterson, A.T. Biodiversity informatics: Managing and applying primary biodiversity data. Philos. Trans. R. Soc. Lond. Ser. B Biol. Sci. 2004, 359, 689–698. [Google Scholar] [CrossRef] [PubMed]
  3. Jiménez-Valverde, A.; Lobo, J.M.; Hortal, J. Not as good as they seem: The importance of concepts in species distribution modelling. Divers. Distrib. 2008, 14, 885–890. [Google Scholar] [CrossRef]
  4. Feeley, K.J.; Silman, M.R. The data void in modeling current and future distributions of tropical species. Glob. Chang. Biol. 2011, 17, 626–630. [Google Scholar] [CrossRef]
  5. Global Biodiversity Information Facility. Available online: www.gbif.org/ (accessed on 5 November 2018).
  6. O Projeto Species Link. Available online: Splink.cria.org.br/ (accessed on 5 November 2018).
  7. Franklin, J. Mapping Species Distributions: Spatial Inference and Prediction; Cambridge University Press: Cambridge, UK, 2009; 320p, ISBN 9780521700023. [Google Scholar]
  8. Peterson, A.T. Predicting the geography of species’ invasions via ecological niche modeling. Quat. Rev. Biol. 2003, 78, 419–433. [Google Scholar] [CrossRef]
  9. Martinez-Meyer, E. Climate change and biodiversity: Some considerations in forecasting shifts in species’ potential distributions. Biodivers. Inform. 2005, 2, 42–55. [Google Scholar] [CrossRef]
  10. Powell, M.; Accad, A.; Shapcott, A. Geographic Information System (GIS) predictions of past, present habitat distribution and areas for re-introduction of the endangered subtropical rainforest shrub Triunia robusta (Proteaceae) from south-east Queensland Australia. Biol. Conserv. 2005, 123, 165–175. [Google Scholar] [CrossRef]
  11. Guisan, A.; Broennimann, O.; Engler, R.; Vust, M.; Yoccoz, N.G.; Lehmann, A.; Zimmermann, N.E. Using niche-based models to improve the sampling of rare species. Conserv. Biol. 2006, 20, 501–511. [Google Scholar] [CrossRef]
  12. Peterson, A.T. Uses and requirements of ecological niche models and related distributional models. Biodivers. Inform. 2006, 3, 59–72. [Google Scholar] [CrossRef]
  13. Thuiller, W.; Lavorel, S.; Sykes, M.T.; Araújo, M.B. Using niche-based modelling to assess the impact of climate change on tree functional diversity in Europe. Divers. Distrib. 2006, 12, 49–60. [Google Scholar] [CrossRef]
  14. Peterson, A.T.; Nakazawa, Y. Environmental data sets matter in ecological niche modelling: An example with Solenopsis invicta and Solenopsis richteri. Glob. Ecol. Biogeogr. 2008, 17, 135–144. [Google Scholar] [CrossRef]
  15. Feeley, K.J.; Silman, M.R. Modelling the responses of Andean and Amazonian plant species to climate change: The effects of georeferencing errors and the importance of data filtering. J. Biogeogr. 2010, 37, 733–740. [Google Scholar] [CrossRef]
  16. Araújo, M.B.; Peterson, A.T. Uses and misuses of bioclimatic envelope modeling. Ecology 2012, 93, 1527–1539. [Google Scholar] [CrossRef] [PubMed] [Green Version]
  17. Hernandez, P.A.; Graham, C.H.; Master, L.L.; Albert, D.L. The effect of sample size and species characteristics on performance of different species distribution modeling methods. Ecography 2006, 29, 773–785. [Google Scholar] [CrossRef] [Green Version]
  18. Wisz, M.S.; Hijmans, R.J.; Li, J.; Peterson, A.T.; Graham, C.H.; Guisan, A.; NCEAS Predicting Species Distributions Working Group. Effects of sample size on the performance of species distribution models. Divers. Distrib. 2008, 14, 763–773. [Google Scholar] [CrossRef]
  19. Wulff, A.S.; Hollingsworth, P.M.; Ahrends, A.; Jaffré, T.; Veillon, J.M.; L’Huillier, L.; Fogliani, B. Conservation priorities in a biodiversity hotspot: Analysis of narrow endemic plant species in New Caledonia. PLoS ONE 2013, 8, e73371. [Google Scholar] [CrossRef] [PubMed]
  20. Breiner, F.T.; Guisan, A.; Bergamini, A.; Nobis, M.P. Overcoming limitations of modelling rare species by using ensembles of small models. Methods Ecol. Evol. 2015, 6, 1210–1218. [Google Scholar] [CrossRef]
  21. Fois, M.; Fenu, G.; Lombrana, A.C.; Cogoni, D.; Bacchetta, G. A practical method to speed up the discovery of unknown populations using Species Distribution Models. J. Nat. Conserv. 2015, 24, 42–48. [Google Scholar] [CrossRef]
  22. Oleas, N.H.; Meerow, A.W.; Feeley, K.J.; Gebelein, J.; Francisco-Ortega, J. Using species distribution models as a tool to discover new populations of Phaedranassa brevifolia Meerow, 1987 (Liliopsida: Amaryllidaceae) in Northern Ecuador. Check List 2014, 10, 689–691. [Google Scholar] [CrossRef]
  23. Hortal, J.; Jiménez-Valverde, A.; Gómez, J.F.; Lobo, J.M.; Baselga, A. Historical bias in biodiversity inventories affects the observed environmental niche of the species. Oikos 2008, 117, 847–858. [Google Scholar] [CrossRef]
  24. Newbold, T. Applications and limitations of museum data for conservation and ecology, with particular attention to species distribution models. Prog. Phys. Geogr. 2010, 34, 3–22. [Google Scholar] [CrossRef]
  25. Beaman, R.S.; Conn, B.J. Automated geoparsing and georeferencing of Malesian collection locality data. Telopea 2003, 10, 43–52. [Google Scholar] [CrossRef]
  26. Murphey, P.C.; Guralnick, R.P.; Glaubitz, R.; Neufeld, D.; Ryan, J.A. Georeferencing of museum collections: A review of the problems and automated tools, and the methodology developed by the Mountain and Plains Spatial-Temporal Database-informatics initiative (MaPSTeDI). PhyloInformatics 2004. [Google Scholar] [CrossRef]
  27. Guralnick, R.P.; Wieczorek, J.; Beaman, R.; Hijmans, R.J. BioGeomancer: Automated georeferencing to map the world’s biodiversity data. PLoS Biol. 2006, 4, 1908–1909. [Google Scholar] [CrossRef]
  28. Hijmans, R.J.; Schreuder, M.; Cruz, J.D.; Guarino, L. Using GIS to check co-ordinates of genebank accessions. Genet. Resour. Crop Evol. 1999, 46, 291–296. [Google Scholar] [CrossRef]
  29. Guralnick, R.P.; Hill, A.W.; Lane, M. Towards a collaborative, global infrastructure for biodiversity assessment. Ecol. Lett. 2007, 10, 663–672. [Google Scholar] [CrossRef] [PubMed] [Green Version]
  30. Lozier, J.D.; Aniello, P.; Hickerson, M.J. Predicting the distribution of Sasquatch in western North America: Anything goes with ecological niche modelling. J. Biogeogr. 2009, 36, 1623–1627. [Google Scholar] [CrossRef]
  31. Rocchini, D.; Hortal, J.; Lengyel, S.; Lobo, J.M.; Jiménez-Valverde, A.; Ricotta, C.; Bacaro, G.; Chiarucci, A. Accounting for uncertainty when mapping species distributions: The need for maps of ignorance. Prog. Phys. Geogr. 2011, 35, 211–226. [Google Scholar] [CrossRef]
  32. Meerow, A.W. Amaryllidaceae. In Flora of Ecuador; Harling, G., Andersson, L., Eds.; University of Göteborg and Pontificia Universidad Católica del Ecuador: Göteborg, Sweden; Quito, Ecuador, 1990; Volume 41, pp. 1–52. ISBN 9788788702460. [Google Scholar]
  33. Minga, D.; Ulloa, C.U.; Oleas, N.; Verdugo, A. A new species of Phaedranassa (Amaryllidaceae) from Ecuador. Phytotaxa 2015, 192, 50–53. [Google Scholar] [CrossRef]
  34. Oleas, N.H. Amaryllidaceae. In Libro Rojo de las Plantas Endémicas del Ecuador, 2nd ed.; León-Yánes, S., Valencia, R., Pitman, N., Endara, L., Ulloa Ulloa, C., Navarrete, H., Eds.; Pontificia Universidad Católica del Ecuador: Quito, Ecuador, 2011; pp. 87–90. ISBN 9789942033932. [Google Scholar]
  35. Tropicos. The Missouri Botanical Garden. Available online: Tropicos.org/ (accessed on 5 November 2018).
  36. Herbarium (AAU), Institut for Bioscience, Aarhus University. Available online: Bios.au.dk/faciliteter/herbarium/ (accessed on 5 November 2018).
  37. C. V. Starr Virtual Herbarium, The New York Botanical Garden. Available online: Sweetgum.nybg.org/science/vh/ (accessed on 5 November 2018).
  38. Kew, Royal Botanic Gardens. Welcome to the Kew Herbarium Catalogue. Available online: Apps.kew.org/herbcat/navigator.do (accessed on 5 November 2018).
  39. University of Florida Herbarium (FLAS). Florida Museum of Natural History. Available online: www.flmnh.ufl.edu/herbarium/ (accessed on 5 November 2018).
  40. Colecciones Científicas en Línea. Instituto de Ciencias Naturales, Universidad Nacional de Colombia. Available online: www.biovirtual.unal.edu.co/ICN/ (accessed on 5 November 2018).
  41. Garcia-Milagros, E.; Funk, V.A. Improving the use of information from museum specimens: Using Google Earth© to georeference Guiana Shield specimens in the US National Herbarium. Front. Biogeogr. 2010, 2, 71–77. [Google Scholar] [CrossRef]
  42. Oleas, N. Landscape Genetics of Phaedranassa Herb. (Amaryllidaceae) in Ecuador. Ph.D. Thesis, Florida International University, Miami, FL, USA, 2011; 115p. [Google Scholar]
  43. Araújo, M.B.; New, M. Ensemble forecasting of species distributions. Trends Ecol. Evol. 2007, 22, 42–47. [Google Scholar] [CrossRef] [PubMed]
  44. Thuiller, W.; Georges, D.; Engler, R.; Breiner, F. biomod2: Ensemble Platform for Species Distribution Modeling. R Package version 3.3-7. 2016. Available online: http://cran.r-project.org/package=biomod2 (accessed on 5 January 2019).
  45. Phillips, S.J.; Anderson, R.P.; Schapire, R.E. Maximum entropy modeling of species geographic distributions. Ecol. Model. 2006, 190, 231–259. [Google Scholar] [CrossRef]
  46. McCullagh, P.; Nelder, J.A. Generalized Linear Models, 2nd ed.; Chapman and Hall: London, UK, 1989; 532p, ISBN 9780412317606. [Google Scholar]
  47. Friedman, J.H. Greedy function approximation: A gradient boosting machine. Ann. Stat. 2001, 29, 1189–1232. [Google Scholar] [CrossRef]
  48. Friedman, J.H. Multivariate adaptive regression splines. Ann. Stat. 1991, 19, 123–141. [Google Scholar] [CrossRef]
  49. Elith, J.; Graham, C.H.; Anderson, R.P.; Dudík, M.; Ferrier, S.; Guisan, A.; Hijmans, R.J.; Huettmann, F.; Leathwick, J.R.; Lehmann, A.; et al. Novel methods improve prediction of species’ distributions from occurrence data. Ecography 2006, 29, 129–151. [Google Scholar] [CrossRef] [Green Version]
  50. Mateo, R.G.; de la Estrella, M.; Felicísimo, A.M.; Muñoz, J.; Guisan, A. A new spin on a compositionalist predictiv modelling framework of conservtion planning: A tropical case study in Ecuador. Biol. Conserv. 2013, 160, 150–161. [Google Scholar] [CrossRef]
  51. WorldClim—Global Climate Data. Available online: www.worldclim.org/ (accessed on 5 November 2018).
  52. Hijmans, R.J.; Cameron, J.D.; Parra, J.L.; Jones, P.; Jarvis, A. Very high resolution interpolated climate surface for global land areas. Int. J. Clim. 2005, 25, 1965–1978. [Google Scholar] [CrossRef]
  53. Allouche, O.; Tsoar, A.; Kadmon, R. Assessing the accuracy of species distribution models: Prevalence, kappa and the true skill statistics (TSS). J. Appl. Ecol. 2006. [Google Scholar] [CrossRef]
  54. Hirzel, A.H.; Le Lay, G.; Helfer, V.; Randin, C.; Guisan, A. Evaluating the ability of habitat suitability models to predict species presences. Ecol. Model. 2006, 199, 142–152. [Google Scholar] [CrossRef]
  55. Pearson, R.G.; Raxworthy, C.J.; Nakamura, M.; Peterson, A.T. Predicting species distributions from small numbers of occurrence records: A test case using cryptic geckos in Madagascar. J. Biogeogr. 2007, 34, 102–117. [Google Scholar] [CrossRef]
  56. Mouton, A.M.; De Baets, B.; Goethals, P.L.M. Ecological relevance of performance criteria for species distribution models. Ecol. Model. 2010, 221, 1995–2002. [Google Scholar] [CrossRef]
  57. Broennimann, O.; Di Cola, V.; Guisan, A. Ecospat: Spatial Ecology Miscellaneous Methods. R Package Version 3.0. 2018. Available online: https://CRAN.R-project.org/package=ecospat (accessed on 5 January 2019).
  58. Martínez, I.; González-Taboada, F.; Wiegand, T.; Camarero, J.J.; Gutiérrez, E. Dispersal limitation and spatial affect model based projections of Pinus uncinata response to climate change in the Pyrenees. Glob. Chang. Biol. 2012, 18, 1714–1724. [Google Scholar] [CrossRef]
  59. Vieilledent, G.; Cornu, C.; Sanchez, C.A.; Pock-Tsy, J.-M.L.; Danthu, P. Vulnerability of baobab species to climate change and effectiveness of the protected area network in Madagascar: Towards new conservation priorities. Biol. Conserv. 2013, 166, 11–22. [Google Scholar] [CrossRef]
  60. IUCN. IUCN Red List Categories and Criteria; Version 3.1; IUCN Species Survival Commission: Gland, Switzerland, 2001; 30p, ISBN 2831706335. [Google Scholar]
  61. Dirnböck, T.; Essl, F.; Rabitsch, W. Disproportional risk for habitat loss of high altitude endemic species under climate change. Glob. Chang. Biol. 2011, 17, 990–996. [Google Scholar] [CrossRef]
  62. Dullinger, S.; Gattringer, A.; Thuiller, W.; Moser, D.; Zimmermann, N.E.; Guisan, A.; Willner, W.; Plutzar, C.; Leitner, M.; Mang, T.; et al. Extinction debt of high-mountain plants under twenty-first-century climate change. Nat. Clim. Chang. 2012, 2, 619–622. [Google Scholar] [CrossRef]
  63. Urrutia, R.; Vuille, M. Climate change projections for the tropical Andes using a regional climate model: Temperature and precipitation simulations for the end of the 21st century. J. Geophys. Res. 2009, 114, D00G17. [Google Scholar] [CrossRef]
Figure 1. Distribution maps for Phaedranassa cinerea, P. dubia, and P. schizantha (Amaryllidaceae) in Ecuador. Darker areas indicate predicted potential ranges based on online database records (left) and verified records (right). Points show the actual species distribution.
Diversity 11 00010 g001
Table 1. Comparison between outcomes of species distribution model predictions for three species of the plant genus Phaedranassa.
SpeciesNTSSAUCBoyce Indexp-Value *Altitude (Min)Altitude (Max)Distribution Range Area
P. cinerea 1130.890.990.850.0025396420536
P. cinerea 2100.901.000.650.03101032522584
P. dubia 1270.860.980.730.001623616920416
P. dubia 2140.881.001.000.00156638442508
P. schizantha 1200.910.990.900.001623616917481
P. schizantha 2100.921.000.900.0017303826859
Notes: Number of records (N), true skill statistics (TSS), area under the curve (AUC), * p-value [54], minimum altitude in meters (Min), maximum altitude in meters (Max). Altitude values in meters (m), distribution range area in square kilometers (km2). 1 Database records, 2 verified records.

